1-Decene Market Size, Growth, Trends | Report 2023-2032
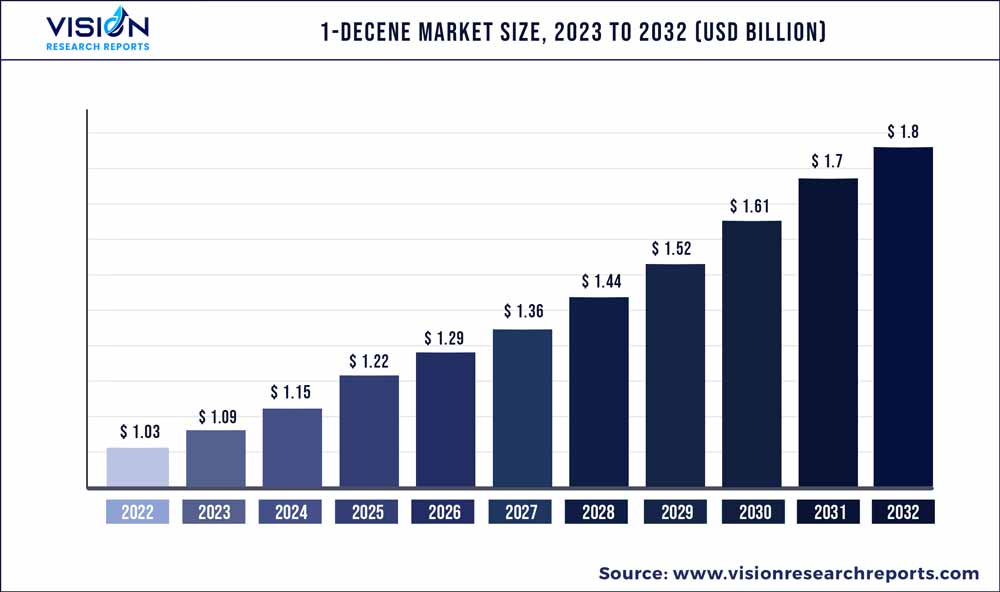
The global 1-decene market size was estimated at around USD 1.03 billion in 2022 and it is projected to hit around USD 1.8 billion by 2032, growing at a CAGR of 5.72% from 2023 to 2032.
Key Pointers
Report Scope of the 1-Decene Market
| Report Coverage | Details |
| Market Size in 2022 | USD 1.03 billion |
| Revenue Forecast by 2032 | USD 1.8 billion |
| Growth rate from 2023 to 2032 | CAGR of 5.72% |
| Base Year | 2022 |
| Forecast Period | 2023 to 2032 |
| Market Analysis (Terms Used) | Value (US$ Million/Billion) or (Volume/Units) |
| Regions Covered | North America, Europe, Asia Pacific, Latin America, Middle East & Africa |
| Companies Covered | Shell Chemicals; Chevron Phillips; INEOS; Qatar Chemicals; SASOL; ExxonMobil |
Increasing demand for group base oil among various end-use industries, such as automotive, and in the industrial sector is expected to drive the market growth significantly over the forecast period. Poly Alpha Olefin (PAO) is a 100% synthetic chemical compound and is designated at API Group IV. PAOs are used as a base stock in the production of some synthetic lubricants. The increasing popularity of the product due to the various advantages over conventional lubricants, such as excellent thermal stability and wear & tear protection, coupled with other properties, such as good load-carrying capacity and low friction, is anticipated to propel industry growth over the forecast period.
The advantage of PAO over mineral base oils is that it suits the formulation of lower viscosity gear & transmission oils and ultra-low viscosity oils in severe viscometric environments. The trends for reduced emission and increased fuel economy that presently exist in the automotive industry are causing additional pressure and strain on the driveline and crankcase lubricants, which implies there is an increasing requirement of PAO for a technical standpoint to support these formulations. Developing economies, such as China, India, Japan, Brazil, and the UAE, are shifting their preferences toward high-grade lubricants from conventional mineral lubricants. This factor is anticipated to remain the key driving factor. The increasing importance of lubrication cost, as opposed to maintenance expenditure in the manufacturing sector, is expected to propel its application in heat transfer mediums and also in transmission systems.
Application Insights
On the basis of applications, the global industry has been further categorized into poly alpha olefin, polyethylene, detergent alcohol, and others. The poly alpha olefin application segment dominated the industry in 2022 and accounted for the maximum share of more than 67.37% of the overall revenue. The segment is estimated to retain its dominance throughout the forecast period. This is attributed to the increasing demand for PAO for synthetic lubricant production.
Poly alpha olefin is anticipated to emerge as the largest as well as the fastest-growing application segment as PAO offers exceptional technical performance and also helps in the prevention of the environment. Detergent alcohols and their derivatives are key raw materials used for producing surfactants in laundry and dishwashing applications. This application segment is expected to witness an above-average growth rate over the forecast period.
Regional Insights
The Europe region dominated the global industry in 2022 and accounted for the maximum share of more than 46.25% of the overall revenue. The region is projected to expand further at a steady growth rate retaining its leading position throughout the forecast period. This is attributed to the increasing PAO and synthetic lubricant production in the region by key product manufacturers. Regional growth can also be attributed to the easy availability of raw materials. Furthermore, as the U.S. is the largest oil manufacturing country, it has been responsible for the higher penetration in the North America regional market.
Moreover, the strong presence of the major industry participants, such as ExxonMobil Corp., Shell Chemicals, Chevron Phillips Chemical Company LP, and INEOS Oligomers, having patented technology for alpha olefin production has driven 1-decene demand in North America. The Asia Pacific region is estimated to register the fastest growth rate during the forecast period. This is mainly due to the rising demand for PAO for the production of lubricants.
1-Decene Market Segmentations:
By Application
By Regional
Chapter 1. Introduction
1.1.Research Objective
1.2.Scope of the Study
1.3.Definition
Chapter 2. Research Methodology
2.1.Research Approach
2.2.Data Sources
2.3.Assumptions & Limitations
Chapter 3. Executive Summary
3.1.Market Snapshot
Chapter 4. Market Variables and Scope
4.1.Introduction
4.2.Market Classification and Scope
4.3.Industry Value Chain Analysis
4.3.1. Raw Material Procurement Analysis
4.3.2. Sales and Distribution Channel Analysis
4.3.3. Downstream Buyer Analysis
Chapter 5.COVID 19 Impact on 1-Decene Market
5.1. COVID-19 Landscape: 1-Decene Industry Impact
5.2. COVID 19 - Impact Assessment for the Industry
5.3. COVID 19 Impact: Global Major Government Policy
5.4.Market Trends and Opportunities in the COVID-19 Landscape
Chapter 6. Market Dynamics Analysis and Trends
6.1.Market Dynamics
6.1.1. Market Drivers
6.1.2. Market Restraints
6.1.3. Market Opportunities
6.2.Porter’s Five Forces Analysis
6.2.1. Bargaining power of suppliers
6.2.2. Bargaining power of buyers
6.2.3. Threat of substitute
6.2.4. Threat of new entrants
6.2.5. Degree of competition
Chapter 7. Competitive Landscape
7.1.1. Company Market Share/Positioning Analysis
7.1.2. Key Strategies Adopted by Players
7.1.3. Vendor Landscape
7.1.3.1.List of Suppliers
7.1.3.2.List of Buyers
Chapter 8. Global 1-Decene Market, By Application
8.1.1-Decene Market, by Application Type, 2023-2032
8.1.1. Poly Alpha Olefin
8.1.1.1.Market Revenue and Forecast (2020-2032)
8.1.2. Polyethylene
8.1.2.1.Market Revenue and Forecast (2020-2032)
8.1.3. Detergent Alcohols
8.1.3.1.Market Revenue and Forecast (2020-2032)
8.1.4. Others
8.1.4.1.Market Revenue and Forecast (2020-2032)
Chapter 9. Global 1-Decene Market, Regional Estimates and Trend Forecast
9.1. North America
9.1.1. Market Revenue and Forecast, by Application (2020-2032)
9.1.2. U.S.
9.1.2.1. Market Revenue and Forecast, by Application (2020-2032)
9.1.3. Rest of North America
9.1.3.1. Market Revenue and Forecast, by Application (2020-2032)
9.2. Europe
9.2.1. Market Revenue and Forecast, by Application (2020-2032)
9.2.2. UK
9.2.2.1. Market Revenue and Forecast, by Application (2020-2032)
9.2.3. Germany
9.2.3.1. Market Revenue and Forecast, by Application (2020-2032)
9.2.4. France
9.2.4.1. Market Revenue and Forecast, by Application (2020-2032)
9.2.5. Rest of Europe
9.2.5.1. Market Revenue and Forecast, by Application (2020-2032)
9.3. APAC
9.3.1. Market Revenue and Forecast, by Application (2020-2032)
9.3.2. India
9.3.2.1. Market Revenue and Forecast, by Application (2020-2032)
9.3.3. China
9.3.3.1. Market Revenue and Forecast, by Application (2020-2032)
9.3.4. Japan
9.3.4.1. Market Revenue and Forecast, by Application (2020-2032)
9.3.5. Rest of APAC
9.3.5.1. Market Revenue and Forecast, by Application (2020-2032)
9.4. MEA
9.4.1. Market Revenue and Forecast, by Application (2020-2032)
9.4.2. GCC
9.4.2.1. Market Revenue and Forecast, by Application (2020-2032)
9.4.3. North Africa
9.4.3.1. Market Revenue and Forecast, by Application (2020-2032)
9.4.4. South Africa
9.4.4.1. Market Revenue and Forecast, by Application (2020-2032)
9.4.5. Rest of MEA
9.4.5.1. Market Revenue and Forecast, by Application (2020-2032)
9.5. Latin America
9.5.1. Market Revenue and Forecast, by Application (2020-2032)
9.5.2. Brazil
9.5.2.1. Market Revenue and Forecast, by Application (2020-2032)
9.5.3. Rest of LATAM
9.5.3.1. Market Revenue and Forecast, by Application (2020-2032)
Chapter 10.Company Profiles
10.1. Shell Chemicals
10.1.1.Company Overview
10.1.2.Product Offerings
10.1.3.Financial Performance
10.1.4.Recent Initiatives
10.2. Chevron Phillips
10.2.1.Company Overview
10.2.2.Product Offerings
10.2.3.Financial Performance
10.2.4.Recent Initiatives
10.3. INEOS
10.3.1.Company Overview
10.3.2.Product Offerings
10.3.3.Financial Performance
10.3.4.Recent Initiatives
10.4. Qatar Chemicals
10.4.1.Company Overview
10.4.2.Product Offerings
10.4.3.Financial Performance
10.4.4.Recent Initiatives
10.5. SASOL
10.5.1.Company Overview
10.5.2.Product Offerings
10.5.3.Financial Performance
10.5.4.Recent Initiatives
10.6. ExxonMobil
10.6.1.Company Overview
10.6.2.Product Offerings
10.6.3.Financial Performance
10.6.4.Recent Initiatives
Chapter 11.Research Methodology
11.1.Primary Research
11.2.Secondary Research
11.3.Assumptions
Chapter 12.Appendix
12.1. About Us
12.2. Glossary of Terms
 Cross-segment Market Size and Analysis for
Mentioned Segments
Additional Company Profiles (Upto 5 With No Cost)
Additional Countries (Apart From Mentioned Countries)
Country/Region-specific Report
Go To Market Strategy
Region Specific Market DynamicsRegion Level Market Share Import Export AnalysisProduction AnalysisOthers
Cross-segment Market Size and Analysis for
Mentioned Segments
Additional Company Profiles (Upto 5 With No Cost)
Additional Countries (Apart From Mentioned Countries)
Country/Region-specific Report
Go To Market Strategy
Region Specific Market DynamicsRegion Level Market Share Import Export AnalysisProduction AnalysisOthers