Actinic Keratosis Treatment Market Size, Share, Growth, Trends, Forecast 2023 to 2032
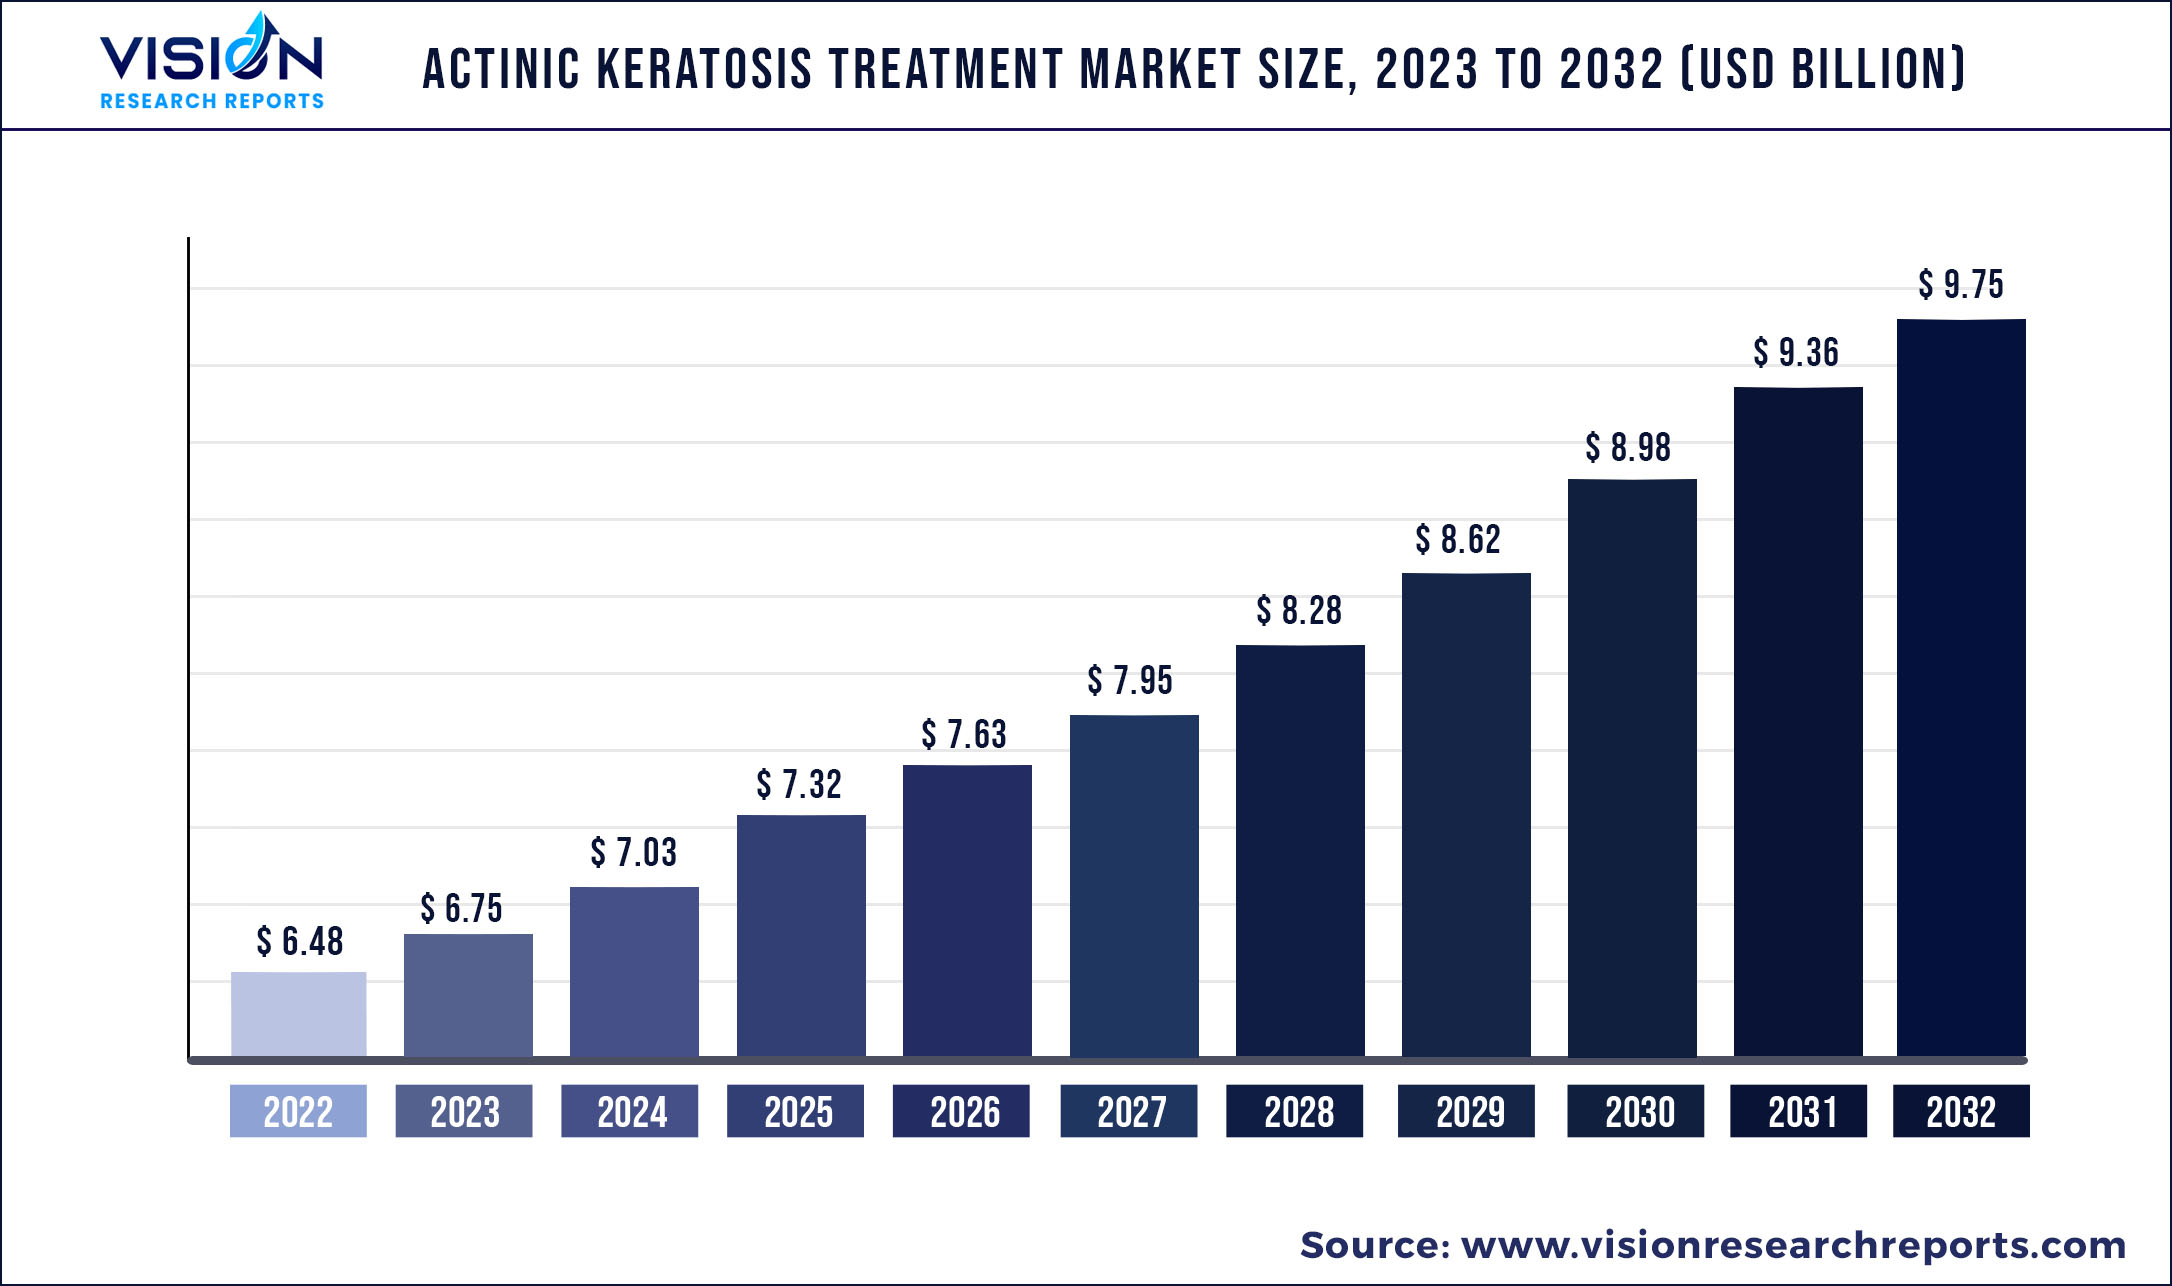
The global actinic keratosis treatment market size was estimated at around USD 6.48 billion in 2022 and it is projected to hit around USD 9.75 billion by 2032, growing at a CAGR of 4.17% from 2023 to 2032.
Key Pointers
The market is anticipated to witness growth opportunities owing to factors such as rising prevalence of actinic keratosis and wide presence and easy availability of generic drugs for the treatment of actinic keratosis. Moreover, the market is driven by increasing awareness about actinic keratosis and various strategic initiatives undertaken by industry players. Increasing consumer awareness regarding dermatological diseases, such as actinic keratosis, is a major growth booster for the market. Heightened knowledge about diagnostics and treatment strategies for this disease has driven the widespread adoption of actinic keratosis medications. Field-directed treatments such as 5-fluorouracil, diclofenac, Ingenol mebutate, and Imiquimod are poised to witness greater market penetration over the next few years. Although the products share similar efficacies, the cosmetic outcomes and adverse effects might differ. Photodynamic therapy was observed to be better than cryotherapy in terms of cosmetic outcomes. The easy accessibility and availability of treatments for actinic keratosis is expected to be a significant growth factor for this market.
The prevalence of actinic keratosis is one of the major market drivers. According to News-Medical.net in 2019, the prevalence of actinic keratosis is 37-55% in Australian adults aged over 40. This is linked to high UV exposure to the Australian population with relatively fair skin. Moreover, outdoor sports are very popular in Australia and as a result, they tend to spend their maximum time in the sun. Furthermore, according to News-Medical.net in 2019, it is being found that men are more prone to actinic keratosis than women but it is also linked with other risk factors such as time spent outside in the sun and overall exposure to sun.
Key industry players are adopting strategic initiatives such as product launches, partnerships, and expansion strategies to increase their market share. For instance, in September 2021, Almirall, S.A. announced the commercial launch of Klisyri (tirbanibulin) in Germany and the U.K. The company announced this product launch upon receiving approval from the U.K.’s Medicines & Healthcare Products Regulatory Agency (MHRA) and the European Commission for the treatment of actinic keratosis of the scalp and face in adults. Moreover, in December 2020, Almirall, S.A. announced the U.S. FDA approval of Klisyri (tirbanibulin) for the treatment of actinic keratosis.
Actinic Keratosis Treatment Market Segmentations:
| By Therapy | By Drug Class | By End-use |
|
Topical Photodynamic Therapy Surgery |
Nucleoside Metabolic Inhibitor NSAIDs Immune Response Modifiers Photoenhancers Others |
Hospitals Private Clinics Homecare Others |
Actinic Keratosis Treatment Market Key Players and Regions Segmentations:
| Key Players | Regions |
|
Almirall S.A. LEO Pharma A/S Sun Pharmaceutical Industries Ltd. Novartis AG GALDERMA Ortho Dermatologics (Bausch Health Companies Inc.) BIOFRONTERA AG Hill Dermaceuticals, Inc. |
North America Europe Asia Pacific Latin America Middle East & Africa |
Chapter 1. Introduction
1.1. Research Objective
1.2. Scope of the Study
1.3. Definition
Chapter 2. Research Methodology
2.1. Research Approach
2.2. Data Sources
2.3. Assumptions & Limitations
Chapter 3. Executive Summary
3.1. Market Snapshot
Chapter 4. Market Variables and Scope
4.1. Introduction
4.2. Market Classification and Scope
4.3. Industry Value Chain Analysis
4.3.1. Raw Material Procurement Analysis
4.3.2. Sales and Distribution Channel Analysis
4.3.3. Downstream Buyer Analysis
Chapter 5. COVID 19 Impact on Actinic Keratosis Treatment Market
5.1. COVID-19 Landscape: Actinic Keratosis Treatment Industry Impact
5.2. COVID 19 - Impact Assessment for the Industry
5.3. COVID 19 Impact: Global Major Government Policy
5.4. Market Trends and Opportunities in the COVID-19 Landscape
Chapter 6. Market Dynamics Analysis and Trends
6.1. Market Dynamics
6.1.1. Market Drivers
6.1.2. Market Restraints
6.1.3. Market Opportunities
6.2. Porter’s Five Forces Analysis
6.2.1. Bargaining power of suppliers
6.2.2. Bargaining power of buyers
6.2.3. Threat of substitute
6.2.4. Threat of new entrants
6.2.5. Degree of competition
Chapter 7. Competitive Landscape
7.1.1. Company Market Share/Positioning Analysis
7.1.2. Key Strategies Adopted by Players
7.1.3. Vendor Landscape
7.1.3.1. List of Suppliers
7.1.3.2. List of Buyers
Chapter 8. Global Actinic Keratosis Treatment Market, By Therapy
8.1. Actinic Keratosis Treatment Market, by Therapy, 2023-2032
8.1.1 Topical
8.1.1.1. Market Revenue and Forecast (2019-2032)
8.1.2. Photodynamic Therapy
8.1.2.1. Market Revenue and Forecast (2019-2032)
8.1.3. Surgery
8.1.3.1. Market Revenue and Forecast (2019-2032)
Chapter 9. Global Actinic Keratosis Treatment Market, By Nucleoside Metabolic Inhibitor
9.1. Actinic Keratosis Treatment Market, by Drug Class, 2023-2032
9.1.1. Nucleoside Metabolic Inhibitor
9.1.1.1. Market Revenue and Forecast (2019-2032)
9.1.2. NSAIDs
9.1.2.1. Market Revenue and Forecast (2019-2032)
9.1.3. Immune Response Modifiers
9.1.3.1. Market Revenue and Forecast (2019-2032)
9.1.4. Photoenhancers
9.1.4.1. Market Revenue and Forecast (2019-2032)
9.1.5. Others
9.1.5.1. Market Revenue and Forecast (2019-2032)
Chapter 10. Global Actinic Keratosis Treatment Market, By End-use
10.1. Actinic Keratosis Treatment Market, by End-use, 2023-2032
10.1.1. Hospitals
10.1.1.1. Market Revenue and Forecast (2019-2032)
10.1.2. Private Clinics
10.1.2.1. Market Revenue and Forecast (2019-2032)
10.1.3. Homecare
10.1.3.1. Market Revenue and Forecast (2019-2032)
10.1.4. Others
10.1.4.1. Market Revenue and Forecast (2019-2032)
Chapter 11. Global Actinic Keratosis Treatment Market, Regional Estimates and Trend Forecast
11.1. North America
11.1.1. Market Revenue and Forecast, by Therapy (2019-2032)
11.1.2. Market Revenue and Forecast, by Drug Class (2019-2032)
11.1.3. Market Revenue and Forecast, by End-use (2019-2032)
11.1.4. U.S.
11.1.4.1. Market Revenue and Forecast, by Therapy (2019-2032)
11.1.4.2. Market Revenue and Forecast, by Drug Class (2019-2032)
11.1.4.3. Market Revenue and Forecast, by End-use (2019-2032)
11.1.5. Rest of North America
11.1.5.1. Market Revenue and Forecast, by Therapy (2019-2032)
11.1.5.2. Market Revenue and Forecast, by Drug Class (2019-2032)
11.1.5.3. Market Revenue and Forecast, by End-use (2019-2032)
11.2. Europe
11.2.1. Market Revenue and Forecast, by Therapy (2019-2032)
11.2.2. Market Revenue and Forecast, by Drug Class (2019-2032)
11.2.3. Market Revenue and Forecast, by End-use (2019-2032)
11.2.4. UK
11.2.4.1. Market Revenue and Forecast, by Therapy (2019-2032)
11.2.4.2. Market Revenue and Forecast, by Drug Class (2019-2032)
11.2.4.3. Market Revenue and Forecast, by End-use (2019-2032)
11.2.5. Germany
11.2.5.1. Market Revenue and Forecast, by Therapy (2019-2032)
11.2.5.2. Market Revenue and Forecast, by Drug Class (2019-2032)
11.2.5.3. Market Revenue and Forecast, by End-use (2019-2032)
11.2.6. France
11.2.6.1. Market Revenue and Forecast, by Therapy (2019-2032)
11.2.6.2. Market Revenue and Forecast, by Drug Class (2019-2032)
11.2.6.3. Market Revenue and Forecast, by End-use (2019-2032)
11.2.7. Rest of Europe
11.2.7.1. Market Revenue and Forecast, by Therapy (2019-2032)
11.2.7.2. Market Revenue and Forecast, by Drug Class (2019-2032)
11.2.7.3. Market Revenue and Forecast, by End-use (2019-2032)
11.3. APAC
11.3.1. Market Revenue and Forecast, by Therapy (2019-2032)
11.3.2. Market Revenue and Forecast, by Drug Class (2019-2032)
11.3.3. Market Revenue and Forecast, by End-use (2019-2032)
11.3.4. India
11.3.4.1. Market Revenue and Forecast, by Therapy (2019-2032)
11.3.4.2. Market Revenue and Forecast, by Drug Class (2019-2032)
11.3.4.3. Market Revenue and Forecast, by End-use (2019-2032)
11.3.5. China
11.3.5.1. Market Revenue and Forecast, by Therapy (2019-2032)
11.3.5.2. Market Revenue and Forecast, by Drug Class (2019-2032)
11.3.5.3. Market Revenue and Forecast, by End-use (2019-2032)
11.3.6. Japan
11.3.6.1. Market Revenue and Forecast, by Therapy (2019-2032)
11.3.6.2. Market Revenue and Forecast, by Drug Class (2019-2032)
11.3.6.3. Market Revenue and Forecast, by End-use (2019-2032)
11.3.7. Rest of APAC
11.3.7.1. Market Revenue and Forecast, by Therapy (2019-2032)
11.3.7.2. Market Revenue and Forecast, by Drug Class (2019-2032)
11.3.7.3. Market Revenue and Forecast, by End-use (2019-2032)
11.4. MEA
11.4.1. Market Revenue and Forecast, by Therapy (2019-2032)
11.4.2. Market Revenue and Forecast, by Drug Class (2019-2032)
11.4.3. Market Revenue and Forecast, by End-use (2019-2032)
11.4.4. GCC
11.4.4.1. Market Revenue and Forecast, by Therapy (2019-2032)
11.4.4.2. Market Revenue and Forecast, by Drug Class (2019-2032)
11.4.4.3. Market Revenue and Forecast, by End-use (2019-2032)
11.4.5. North Africa
11.4.5.1. Market Revenue and Forecast, by Therapy (2019-2032)
11.4.5.2. Market Revenue and Forecast, by Drug Class (2019-2032)
11.4.5.3. Market Revenue and Forecast, by End-use (2019-2032)
11.4.6. South Africa
11.4.6.1. Market Revenue and Forecast, by Therapy (2019-2032)
11.4.6.2. Market Revenue and Forecast, by Drug Class (2019-2032)
11.4.6.3. Market Revenue and Forecast, by End-use (2019-2032)
11.4.7. Rest of MEA
11.4.7.1. Market Revenue and Forecast, by Therapy (2019-2032)
11.4.7.2. Market Revenue and Forecast, by Drug Class (2019-2032)
11.4.7.3. Market Revenue and Forecast, by End-use (2019-2032)
11.5. Latin America
11.5.1. Market Revenue and Forecast, by Therapy (2019-2032)
11.5.2. Market Revenue and Forecast, by Drug Class (2019-2032)
11.5.3. Market Revenue and Forecast, by End-use (2019-2032)
11.5.4. Brazil
11.5.4.1. Market Revenue and Forecast, by Therapy (2019-2032)
11.5.4.2. Market Revenue and Forecast, by Drug Class (2019-2032)
11.5.4.3. Market Revenue and Forecast, by End-use (2019-2032)
11.5.5. Rest of LATAM
11.5.5.1. Market Revenue and Forecast, by Therapy (2019-2032)
11.5.5.2. Market Revenue and Forecast, by Drug Class (2019-2032)
11.5.5.3. Market Revenue and Forecast, by End-use (2019-2032)
Chapter 12. Company Profiles
12.1. Almirall S.A.
12.1.1. Company Overview
12.1.2. Product Offerings
12.1.3. Financial Performance
12.1.4. Recent Initiatives
12.2. LEO Pharma A/S
12.2.1. Company Overview
12.2.2. Product Offerings
12.2.3. Financial Performance
12.2.4. Recent Initiatives
12.3. Sun Pharmaceutical Industries Ltd.
12.3.1. Company Overview
12.3.2. Product Offerings
12.3.3. Financial Performance
12.3.4. Recent Initiatives
12.4. Novartis AG
12.4.1. Company Overview
12.4.2. Product Offerings
12.4.3. Financial Performance
12.4.4. Recent Initiatives
12.5. GALDERMA
12.5.1. Company Overview
12.5.2. Product Offerings
12.5.3. Financial Performance
12.5.4. Recent Initiatives
12.6. Ortho Dermatologics (Bausch Health Companies Inc.)
12.6.1. Company Overview
12.6.2. Product Offerings
12.6.3. Financial Performance
12.6.4. Recent Initiatives
12.7. BIOFRONTERA AG
12.7.1. Company Overview
12.7.2. Product Offerings
12.7.3. Financial Performance
12.7.4. Recent Initiatives
12.8. Hill Dermaceuticals, Inc.
12.8.1. Company Overview
12.8.2. Product Offerings
12.8.3. Financial Performance
12.8.4. Recent Initiatives
Chapter 13. Research Methodology
13.1. Primary Research
13.2. Secondary Research
13.3. Assumptions
Chapter 14. Appendix
14.1. About Us
14.2. Glossary of Terms
 Cross-segment Market Size and Analysis for
Mentioned Segments
Additional Company Profiles (Upto 5 With No Cost)
Additional Countries (Apart From Mentioned Countries)
Country/Region-specific Report
Go To Market Strategy
Region Specific Market DynamicsRegion Level Market Share Import Export AnalysisProduction AnalysisOthers
Cross-segment Market Size and Analysis for
Mentioned Segments
Additional Company Profiles (Upto 5 With No Cost)
Additional Countries (Apart From Mentioned Countries)
Country/Region-specific Report
Go To Market Strategy
Region Specific Market DynamicsRegion Level Market Share Import Export AnalysisProduction AnalysisOthers