Active Pharmaceutical Ingredients (API) Market (By Manufacturer Type: In House Manufacturing and Contract Manufacturing; By Drug Type: Branded or Innovative Prescription Drugs, Generic Prescription Drugs, Over-the-counter [OTC] Drugs; By API Type; By Application; By End User) - Global Industry Analysis, Size, Share, Growth, Trends, Revenue, Regional Outlook and Forecast 2022-2030

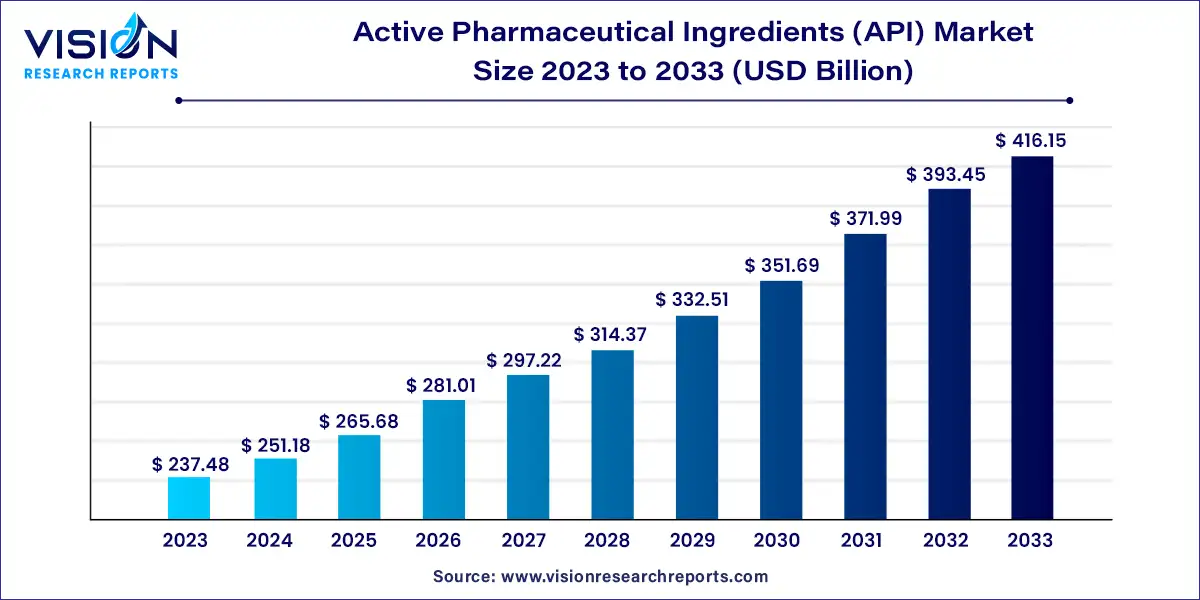
The global active pharmaceutical ingredients market size is expected to reach around US$ 328 billion by 2030. The global active pharmaceutical ingredients market size was valued at US$ 169 bn in 2020 and is anticipated to grow at a CAGR of 6.1% from 2022 to 2030.

Active Pharmaceutical Ingredients (API) Market Size 2021 to 2030

An active pharmaceutical ingredient (API) is any substance or mixture of substances used in the finished pharmaceutical product (FPP) that is intended to provide pharmacological action or to otherwise have a direct impact in the diagnosis, remedy, mitigation, therapy, or prevention of disease, or to have a direct effect in repairing, correcting, or altering physiological functions in humans.

The global active pharmaceutical ingredients (API) market has experienced significant growth in the last decade, due to increase in incidence of chronic diseases

Increase in Abbreviated New Drug Applications (ANDA) drives demand for active pharmaceutical ingredients (API). In order to market a generic drug, a company needs to file Abbreviated New Drug Application (ANDA). An ANDA approval implies that the generic drug is comparable to the original drug in terms of dosage form, strength, route of administration, quality, performance characteristics, and intended use.

However, companies cannot manufacture a drug unless the patent of a drug expires. Hence, as billion dollar drugs lose patents, other drug manufacturers grab the opportunity to manufacture low cost generics and file for ANDA to the U.S. FDA.

The pharmaceutical industry has suffered significantly due to patent expiry of blockbuster drugs in the past few years. Demand for low cost substitutes is high in low- and middle-income countries in Asia Pacific, Africa, and Latin America. This increases the number of API manufacturers, as pharmaceutical drug manufacturers did not have enough in-house capacity to meet the demand.

Currently, majority of API manufacturers is concentrated in Asia Pacific, primarily India, China, and Taiwan. Teva Active Pharmaceutical Ingredients (TAPI), Aurobindo, and Sun Pharma are the leading API manufacturers in the region.

Increase in incidence of chronic diseases drives the global active pharmaceutical ingredients (API) market. According to the International Diabetes Federation, in 2019, 463 million people across the world were diagnosed with diabetes. Moreover, the number of new cancer cases per year is expected to increase to 23.6 million by 2030. Apart from cancer, a number of other diseases have shown rise in prevalence rates. Rise in prevalence of cancer, cardiovascular diseases, and diabetes; surge in sedentary lifestyle; and increase in geriatric population are the key drivers of the active pharmaceutical ingredients (API) market.

Lung cancer is the leading cause of cancer deaths in Asia Pacific. China alone accounts for over 50% of all cancer cases in the region. Changes in lifestyle and socio-cultural factors are the leading causes of cervical cancer. Major countries affected by breast cancer in Asia Pacific are India, Thailand, and China.

Small molecule drugs account for major share of the current drug pipeline. Despite new biologic entities entering the market, small molecules are experiencing a surge in usage in the clinical pipeline. Maximum number of FDA approvals in the last decade have been for small molecule drugs, and the trend is likely to continue during the forecast period.

Type of Manufacturer Insights

The captive API segment accounted for the largest revenue share of 59.3% in 2021. It is anticipated to grow at a significant rate in the upcoming years owing to the easy availability of raw materials and extensive investments by major players to develop high-end manufacturing facilities. Furthermore, recent developments and initiatives by key players suggest that they are highly focused on in-house manufacturing over outsourcing. For instance, in November 2019, Novartis announced the acquisition of CellforCure-a France-based CDMO-for producing molecules in-house, which was earlier contracted to CellforCure. These initiatives undertaken by key players are anticipated to boost segment growth.

Major companies are looking to leverage their production capabilities in Asian countries in an attempt to provide APIs to other drugmakers. Apart from major players Government of India has also planned to provide impetus to domestic API manufacturing. For instance, in March 2020, the government of India announced a 9.4 billion package for the bulk drug industry, which will give a boost to domestic production and exports.

Top biopharmaceutical players are responsible for substantial growth in the outsourcing segment. Furthermore, the lower cost of manufacturing in countries such as India and China makes them a popular choice for players looking to outsource their API production. Outsourcing manufacturing to developing countries is a cost-effective measure that allows these companies to gain higher profits, thus accelerating segment growth.

Drug Type Insights

The global active pharmaceutical ingredients (API) market has been categorized into branded or innovative prescription drugs, generic prescription drugs, and OTC drugs. The branded or innovative prescription drugs segment accounted for a prominent share of the global active pharmaceutical ingredients (API) market in 2020. According to TMR Research, medicine use has continued to rise, with people in the U.S. filling 5.8 billion prescriptions in 2018, an increase of 2.7% over the previous year. This was largely driven by more patients receiving existing branded drugs and using newly launched drugs.

Type Insights

Innovative APIs held the largest share of 66.3% in 2021. This growth is attributed to increasing R&D initiatives for novel drug development and favorable government regulations. As a result of extensive research in this field, several innovative products are now in development and are expected to launch in the forecast period. New entrants in this segment are expected to drive market growth.

A rise in demand for targeted therapies with high potency API compounds, such as HPAPI, is anticipated to increase the demand for personalized medicines. For instance, ADCs leverage the specificity of antibodies for cancer cells. These cells use linker technology to attach themselves to the antibody. These advanced features of ADCs are anticipated to drive the market, with most pharmaceutical companies pursuing such development programs.

The patent expiry of branded molecules is a key factor that can be attributed to the lucrative growth of generic API drugs. The generic drug market is anticipated to exhibit a high growth rate in countries such as Brazil and India, owing to high unmet clinical needs and acceptance of OTC drugs.

Application Insights

The cardiovascular diseases segment accounted for the largest revenue share of 19.5% in 2021. This is attributed to the increasing prevalence of target diseases worldwide. Various organizations such as the World Heart Federation, the World Stroke Organization, and the Stroke Association are working toward increasing awareness about cardiovascular diseases. Government initiatives such as the National Cholesterol Education Program are aimed at improving awareness related to lipid and cholesterol-related diseases. High prevalence and increasing awareness about cardiovascular diseases are anticipated to drive the segment during the forecast period, thus driving demand for APIs for cardiology drugs.

Oncology is expected to be the fastest-growing application segment with a CAGR of 8.4% during the forecast period. Factors such as changing lifestyles and the growing prevalence of cancer are driving the market. The increasing adoption of a sedentary lifestyle is driving the prevalence of various metabolic disorders. Hormonal imbalance is a growing concern in most countries. These disorders include thyroid and sex hormone imbalance. Levothyroxine is a popular API used to treat hypothyroidism. Hormonal therapy is of various types: for postmenopausal women, for men on cancer treatment, and for children to enable proper growth. A rise in hormone-dependent aging problems is also expected to drive the market.

Other diseases such as diabetic retinopathy and macular degeneration are also growing in prevalence, impelling the demand for highly efficient and cost-effective medications. Diabetic retinopathy is expected to impact over 190 million people by 2030. This is expected to boost demand for both generic medications and APIs.

Type of Synthesis Insights

The synthetic API segment accounted for the largest revenue share of 72.6% in 2021. This is attributed to the higher availability of raw materials and easier protocols for the synthesis of these molecules. Many synthetic molecules are also expected to go off-patent in the coming years, which is anticipated to boost growth.

The biotech segment is expected to expand at the fastest CAGR of 7.2% during the forecast period. This segment is driven by factors such as increasing demand for biopharmaceuticals and the higher efficiency of these molecules. Furthermore, the growth of the biotech segment can be attributed to high investments in the biotechnology and biopharmaceutical sectors. This allows the innovation of new molecules that aid in the treatment of diseases, such as cancer. The high revenue of biotech-related API makes the market highly profitable, attracting major players. For instance, Proleukin (aldesleukin) by Clinigen, Inc. is a biological therapy for metastatic renal cell carcinoma.

Recombinant proteins are extensively used in gene sequencing, especially to create antibody probes within cells. Thus, recombinant proteins find extensive applications in targeted therapies. These proteins play a crucial role in the development of novel treatments, such as cell therapy. Players are investing in protein manufacturing plants. For instance, in November 2019, Bio-Techne announced an investment of over USD 40 million to upgrade its protein manufacturing facility and meet cell therapy demands. However, there are a limited number of players in the field, leading to insufficient supply for current and future demands.

High Use of API in Pharmaceutical & Biotechnology Industry

In terms of end user, the global active pharmaceutical ingredients (API) market has been categorized into pharmaceutical & biotechnological industry, CROs, CMOs, and others. The pharmaceutical & biotechnological industry segment accounted for a major share of the global active pharmaceutical ingredients (API) market in 2020. A large number of pharmaceutical & biotechnology companies and their preference for in-house manufacturing of finished dose products drives the segment. Additionally, pharma companies are opening their own manufacturing plants in emerging markets instead of imports to sell products, which drives the segment.

Regional Insights

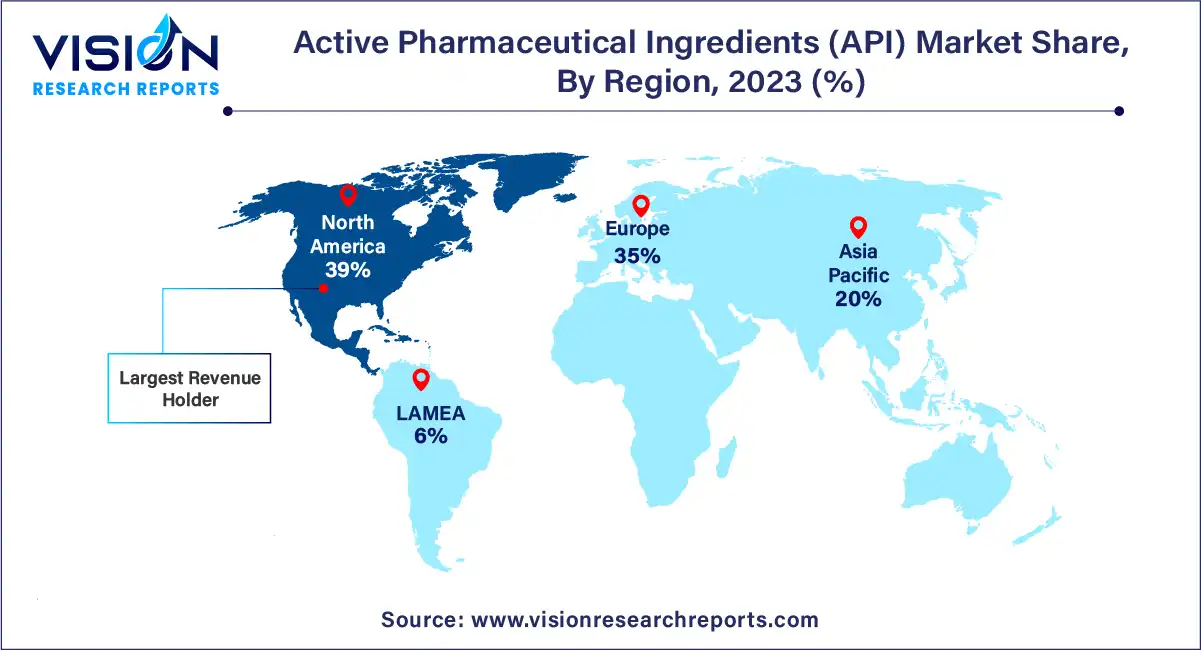
North America accounted for the largest revenue share of 40% in 2021 and is expected to maintain its lead over the forecast period. It is due to the rising incidence of cancer and other lifestyle-induced diseases, which stimulates R&D, thereby boosting the market.

Asia Pacific is anticipated to exhibit the fastest CAGR of 7.5% during the forecast period. The presence of economies such as China and India that the world relies on for the production of APIs at a lower cost is an advantage for the region. Increasing healthcare expenditure in the region is anticipated to fuel the market growth.

Europe is expected to witness significant growth during the forecast period. An increase in research funding and the local presence of key market players in this region is expected to drive the market. The number of biopharmaceutical companies is growing in Europe owing to increasing investments. For instance, in 2018, USD 20 billion was raised as an investment by the biopharma industry, which increased by 28% to USD 27.5 billion in 2019. Many key global players conduct their biopharmaceutical R&D in Europe.

Competitive Landscape and Market Share Analysis

The active pharmaceutical ingredients market competitive landscape provides details by vendors, including company overview, company total revenue (financials), market potential, global presence, active pharmaceutical ingredients sales and revenue generated, market share, price, production sites and facilities, SWOT analysis, product launch. For the period 2017-2020, this study provides the active pharmaceutical ingredients sales, revenue and market share for each player covered in this report.

  • Crucial data regarding the major contenders, product portfolio, market remuneration, and production patterns are documented in the report.
  • The report presents the pricing models followed by each company, alongside the gross margins and market share held by each company.

Key players operating in the global market include Merck & Co., Inc., Teva Pharmaceutical Industries Ltd., Sanofi, Pfizer, Inc., Novartis AG, Mylan N.V., Lonza, WuXi AppTec Co., Ltd., Piramal Pharma Solutions, Hisun USA, Inc., Ipca Laboratories Ltd., AbbVie, Inc., Alembic Pharmaceuticals Limited, BASF SE, Biocon Ltd., Boehringer Ingelheim International GmbH, Bristol-Myers Squibb Company, Cambrex Corporation, Dr. Reddy's Laboratories Ltd., Eli Lilly and Company, and GlaxoSmithKline plc.

Market: Segmentation

Market By Manufacture Type

  • In House Manufacturing
  • Contract Manufacturing

Market By Drug Type

  • Branded or Innovative Prescription Drugs
  • Generic Prescription Drugs
  • Over-the-counter (OTC) Drugs

Market By API Type

  • Synthetic
  • Biological
  • Monoclonal Antibodies
  • Recombinant Proteins
  • Vaccines
  • Plant Extracts

Market By Application

  • Anti-infective
  • Cardiovascular Diseases
  • Oncology
  • CNS and Neurology
  • Orthopedic
  • Endocrinology
  • Pulmonology
  • Gastroenterology
  • Nephrology
  • Ophthalmology
  • Others

Market By End User

  • Pharmaceutical & Biotechnological Industry
  • CROs
  • CMOs
  • Others

Market By Region

  • North America
    • U.S.
    • Canada
  • Europe
    • Germany
    • U.K.
    • France
    • Italy
    • Spain
    • Rest of Europe
  • Asia Pacific
    • China
    • India
    • Japan
    • Australia & New Zealand
    • Rest of Asia Pacific
  • Latin America
    • Brazil
    • Mexico
    • Rest of Latin America
  • Middle East & Africa
    • GCC Countries
    • South Africa
    • Rest of Middle East & Africa

This report focuses on active pharmaceutical ingredients market includes crucial information on market share, market size, and growth rate for the forecast period 2021 to 2030 at the global level, regional level and company level. From a global perspective, this report represents overall active pharmaceutical ingredients market size by analyzing historical data and future prospect. The study highlights deep analysis on the major drivers of the market, restraints, and challenges to help the business owners, suppliers, and marketing personnel in planning effective strategies for the forecast period. This will help the business and manufacturers to lead the market and gain prominent position in future. The report also presents vital information through graphical representation on factors like table, charts, and statistics. The study includes drivers and restraints of the global active pharmaceutical ingredients market.

The research not only conducts forecasts in terms of value, but also evaluates the market on the basis of essential parameters, such as Year-on-Year (Y-o-Y) growth. This helps providers to recognize the future opportunities as well predictability of the market.

In order to understand and assess opportunities in this market, the report is categorically divided into five key sections on the basis of segments. The report analyzes the global market in terms of value (US$ dollers) and volume (Million Units).

The research report includes specific segments by region (country), by company, by all segments. This study provides information about the growth and revenue during the historic and forecasted period of 2017 to 2030. Every segment is further sub-segmented into several sub-segmented that are deeply analyzed by experts to offer valuable information to the buyers and market players. Understanding the segments helps in identifying the importance of different factors that aid the market growth.

Major Key Points Covered in Report:

Executive Summary: It includes key trends of the active pharmaceutical ingredients market related to products, applications, and other crucial factors. It also provides analysis of the competitive landscape and CAGR and market size of the active pharmaceutical ingredients market based on production and revenue.

Production and Consumption by Region: It covers all regional markets to which the research study relates. Prices and key players in addition to production and consumption in each regional market are discussed.

Key Players: Here, the report throws light on financial ratios, pricing structure, production cost, gross profit, sales volume, revenue, and gross margin of leading and prominent companies competing in the Active pharmaceutical ingredients market.

Market Segments: This part of the report discusses about product, application and other segments of the active pharmaceutical ingredients market based on market share, CAGR, market size, and various other factors.

Research Methodology: This section discusses about the research methodology and approach used to prepare the report. It covers data triangulation, market breakdown, market size estimation, and research design and/or programs.

Research Methodology

The research methodology adopted by analysts for compiling the global active pharmaceutical ingredients market report is based on detailed primary as well as secondary research. With the help of in-depth insights of the market-affiliated information that is obtained and legitimated by market-admissible resources, analysts have offered riveting observations and authentic forecasts for the global market.

During the primary research phase, analysts interviewed market stakeholders, investors, brand managers, vice presidents, and sales and marketing managers. Based on data obtained through interviews of genuine resources, analysts have emphasized the changing scenario of the global market.

For secondary research, analysts scrutinized numerous annual report publications, white papers, market association publications, and company websites to obtain the necessary understanding of the global active pharmaceutical ingredients market.

The study objectives of this report are:

  • To analyze and study the global market capacity, production, value, consumption, status (2017-2021) and forecast (2021-2030);
  • Focuses on the key manufacturers, to study the capacity, production, value, market share and development plans in future.
  • Comprehensive company profiles covering the product offerings, key financial information, recent developments, SWOT analysis, and strategies employed by the major market players
  • To define, describe and forecast the market by type, application and region.
  • To analyze the global and key regions market potential and advantage, opportunity and challenge, restraints and risks.
  • To identify significant trends and factors driving or inhibiting the market growth.
  • To analyze the opportunities in the market for stakeholders by identifying the high growth segments.
  • To strategically analyze each submarket with respect to individual growth trend and their contribution to the market
  • To analyze competitive developments such as expansions, agreements, new product launches, and acquisitions in the market
  • To strategically profile the key players and comprehensively analyze their growth strategies.

Report Detail

Proceed To Buy

USD 4500
USD 7900

Customization Offered

  • check-imgCross-segment Market Size and Analysis for Mentioned Segments
  • check-imgAdditional Company Profiles (Upto 5 With No Cost)
  • check-img Additional Countries (Apart From Mentioned Countries)
  • check-img Country/Region-specific Report
  • check-img Go To Market Strategy
  • check-imgRegion Specific Market Dynamics
  • check-imgRegion Level Market Share
  • check-img Import Export Analysis
  • check-imgProduction Analysis
  • check-imgOthers