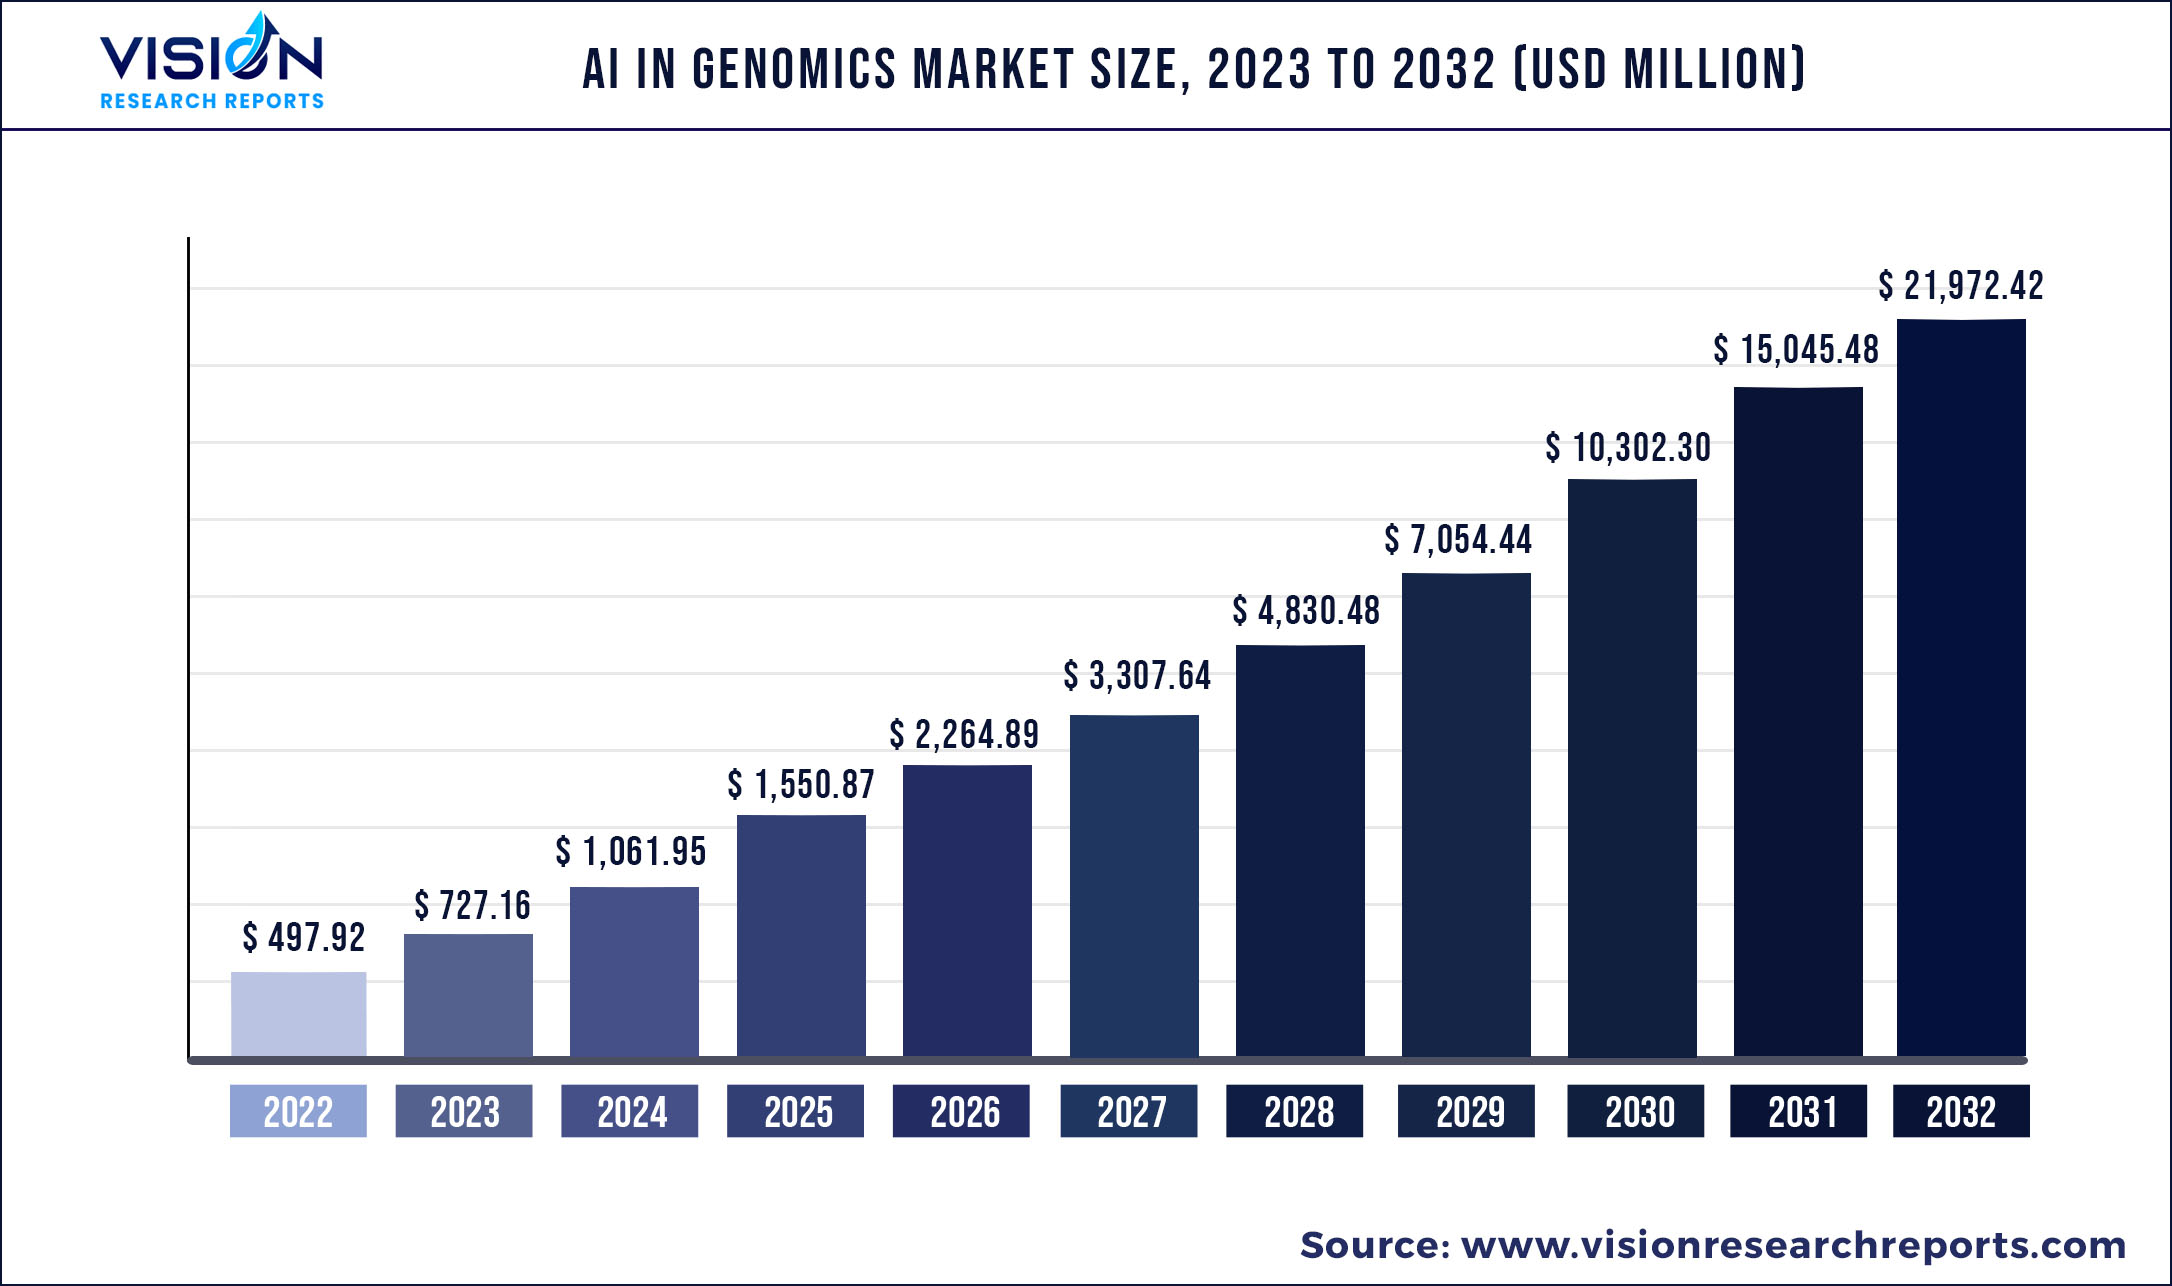
The global AI in genomics market was valued at USD 497.92 million in 2022 and it is predicted to surpass around USD 21,972.42 million by 2032 with a CAGR of 46.04% from 2023 to 2032.
Key Pointers
Report Scope of the AI In Genomics Market
| Report Coverage | Details |
| Market Size in 2022 | USD 497.92 million |
| Revenue Forecast by 2032 | USD 21,972.42 million |
| Growth rate from 2023 to 2032 | CAGR of 46.04% |
| Base Year | 2022 |
| Forecast Period | 2023 to 2032 |
| Regions Covered | North America, Europe, Asia Pacific, Latin America, Middle East & Africa |
| Companies Covered | IBM; Microsoft Corporation; NVIDIA Corporation; DEEP GENOMICS; Data4Cure, Inc.; Freenome Holdings, Inc.; Thermo Fisher Scientific; Illumina, Inc.; SOPHiA GENETICS; BenevolentAI; Fabric Genomics |
The rising demand for tailored medications along with the increasing R&D expenditure is driving the growth of AI in genomics market. The key factors driving the demand for AI in the genomics industry are the rapid advancements in AI technology and its cost-effectiveness. With the rapid advancements in AI technology, new AI-powered software solutions are being developed that are specifically designed for the genomics industry. These solutions are more sophisticated and efficient, enabling researchers to analyze and manage genomic data more effectively than ever before. AI algorithms and software solutions can help automate many of the manual tasks involved in genomic research, reducing the need for human labor and making the process more cost-effective.
The COVID-19 pandemic had a positive impact on the market as it accelerated the development of computing solutions that sped up the understanding of the scope, scale, and severity of the pandemic. Key market players in the healthcare sector collaborated to create new computing solutions to develop vaccines and drugs at a significant speed. For instance, NVIDIA created new tools for genomic sequencing and artificial intelligence to aid researchers in tracking and treating COVID-19 cases. Researchers and medical professionals were able to better grasp the COVID-19 genetic variants with the use of powerful artificial intelligence (AI) tools and genome sequence analysis.
Genomics is a rapidly advancing field that is increasingly reliant on artificial intelligence. AI can identify patterns and connections in genetic data that would be difficult for humans to detect, leading to improvements in the development of new therapies for diseases, more accurate diagnoses, and personalized patient care. In addition, AI is being used to create digital models of the human body, which can be used to assess the safety and effectiveness of potential new drugs.
Regional Insights
In 2022, North America held a majority of the global AI in genomics market share of around 29.04% in terms of revenue owing to the presence of many market players including Danone; Abbott; Nestlé; Targeted Medical Pharma, Inc.; and Mead Johnson & Company, LLC; among others. North America is home to some of the largest and most well-funded research institutions and biotechnology companies in the world, and these organizations are investing heavily in the development of AI-powered solutions for genomics. This is driving the development of new software and tools for genomic data analysis, and it is contributing to the growth of the AI in genomics market in North America.
Asia Pacific is expected to witness the fastest CAGR of 47.12% over the forecast period. The demand for AI in genomics in the region is driven by a combination of rapidly increasing healthcare expenditure, a growing focus on precision medicine, advances in genomics technology, and a large and growing population. Some Asian countries have started their own national genomics initiatives, establishing their own population genetic databases by sequencing the DNA of healthy people. In Thailand, a five-year Genomics Initiative worth USD 150 million was authorized by the government in 2019 to characterize the genomes of 50,000 citizens.
AI In Genomics Market Segmentations:
| By Component | By Technology | By Functionality | By Application | By End-use |
|
Hardware Software Services |
Machine Learning Computer Vision |
Genome Sequencing Gene Editing Others |
Drug Discovery & Development Precision Medicine Diagnostics Others |
Pharmaceutical and Biotech Companies Healthcare Providers Research Centers Others |
Chapter 1. Introduction
1.1. Research Objective
1.2. Scope of the Study
1.3. Definition
Chapter 2. Research Methodology
2.1. Research Approach
2.2. Data Sources
2.3. Assumptions & Limitations
Chapter 3. Executive Summary
3.1. Market Snapshot
Chapter 4. Market Variables and Scope
4.1. Introduction
4.2. Market Classification and Scope
4.3. Industry Value Chain Analysis
4.3.1. Raw Material Procurement Analysis
4.3.2. Sales and Distribution Channel Analysis
4.3.3. Downstream Buyer Analysis
Chapter 5. COVID 19 Impact on AI In Genomics Market
5.1. COVID-19 Landscape: AI In Genomics Industry Impact
5.2. COVID 19 - Impact Assessment for the Industry
5.3. COVID 19 Impact: Global Major Government Policy
5.4. Market Trends and Opportunities in the COVID-19 Landscape
Chapter 6. Market Dynamics Analysis and Trends
6.1. Market Dynamics
6.1.1. Market Drivers
6.1.2. Market Restraints
6.1.3. Market Opportunities
6.2. Porter’s Five Forces Analysis
6.2.1. Bargaining power of suppliers
6.2.2. Bargaining power of buyers
6.2.3. Threat of substitute
6.2.4. Threat of new entrants
6.2.5. Degree of competition
Chapter 7. Competitive Landscape
7.1.1. Company Market Share/Positioning Analysis
7.1.2. Key Strategies Adopted by Players
7.1.3. Vendor Landscape
7.1.3.1. List of Suppliers
7.1.3.2. List of Buyers
Chapter 8. Global AI In Genomics Market, By Component
8.1. AI In Genomics Market, by Component, 2023-2032
8.1.1. Hardware
8.1.1.1. Market Revenue and Forecast (2020-2032)
8.1.2. Software
8.1.2.1. Market Revenue and Forecast (2020-2032)
8.1.3. Services
8.1.3.1. Market Revenue and Forecast (2020-2032)
Chapter 9. Global AI In Genomics Market, By Technology
9.1. AI In Genomics Market, by Technology, 2023-2032
9.1.1. Machine Learning
9.1.1.1. Market Revenue and Forecast (2020-2032)
9.1.2. Computer Vision
9.1.2.1. Market Revenue and Forecast (2020-2032)
Chapter 10. Global AI In Genomics Market, By Functionality
10.1. AI In Genomics Market, by Functionality, 2023-2032
10.1.1. Genome Sequencing
10.1.1.1. Market Revenue and Forecast (2020-2032)
10.1.2. Gene Editing
10.1.2.1. Market Revenue and Forecast (2020-2032)
10.1.3. Others
10.1.3.1. Market Revenue and Forecast (2020-2032)
Chapter 11. Global AI In Genomics Market, By Application
11.1. AI In Genomics Market, by Application, 2023-2032
11.1.1. Drug Discovery & Development
11.1.1.1. Market Revenue and Forecast (2020-2032)
11.1.2. Precision Medicine
11.1.2.1. Market Revenue and Forecast (2020-2032)
11.1.3. Diagnostics
11.1.3.1. Market Revenue and Forecast (2020-2032)
11.1.4. Others
11.1.4.1. Market Revenue and Forecast (2020-2032)
Chapter 12. Global AI In Genomics Market, By End-use
12.1. AI In Genomics Market, by End-use, 2023-2032
12.1.1. Pharmaceutical and Biotech Companies
12.1.1.1. Market Revenue and Forecast (2020-2032)
12.1.2. Healthcare Providers
12.1.2.1. Market Revenue and Forecast (2020-2032)
12.1.3. Research Centers
12.1.3.1. Market Revenue and Forecast (2020-2032)
12.1.4. Others
12.1.4.1. Market Revenue and Forecast (2020-2032)
Chapter 13. Global AI In Genomics Market, Regional Estimates and Trend Forecast
13.1. North America
13.1.1. Market Revenue and Forecast, by Component (2020-2032)
13.1.2. Market Revenue and Forecast, by Technology (2020-2032)
13.1.3. Market Revenue and Forecast, by Functionality (2020-2032)
13.1.4. Market Revenue and Forecast, by Application (2020-2032)
13.1.5. Market Revenue and Forecast, by End-use (2020-2032)
13.1.6. U.S.
13.1.6.1. Market Revenue and Forecast, by Component (2020-2032)
13.1.6.2. Market Revenue and Forecast, by Technology (2020-2032)
13.1.6.3. Market Revenue and Forecast, by Functionality (2020-2032)
13.1.6.4. Market Revenue and Forecast, by Application (2020-2032)
13.1.7. Market Revenue and Forecast, by End-use (2020-2032)
13.1.8. Rest of North America
13.1.8.1. Market Revenue and Forecast, by Component (2020-2032)
13.1.8.2. Market Revenue and Forecast, by Technology (2020-2032)
13.1.8.3. Market Revenue and Forecast, by Functionality (2020-2032)
13.1.8.4. Market Revenue and Forecast, by Application (2020-2032)
13.1.8.5. Market Revenue and Forecast, by End-use (2020-2032)
13.2. Europe
13.2.1. Market Revenue and Forecast, by Component (2020-2032)
13.2.2. Market Revenue and Forecast, by Technology (2020-2032)
13.2.3. Market Revenue and Forecast, by Functionality (2020-2032)
13.2.4. Market Revenue and Forecast, by Application (2020-2032)
13.2.5. Market Revenue and Forecast, by End-use (2020-2032)
13.2.6. UK
13.2.6.1. Market Revenue and Forecast, by Component (2020-2032)
13.2.6.2. Market Revenue and Forecast, by Technology (2020-2032)
13.2.6.3. Market Revenue and Forecast, by Functionality (2020-2032)
13.2.7. Market Revenue and Forecast, by Application (2020-2032)
13.2.8. Market Revenue and Forecast, by End-use (2020-2032)
13.2.9. Germany
13.2.9.1. Market Revenue and Forecast, by Component (2020-2032)
13.2.9.2. Market Revenue and Forecast, by Technology (2020-2032)
13.2.9.3. Market Revenue and Forecast, by Functionality (2020-2032)
13.2.10. Market Revenue and Forecast, by Application (2020-2032)
13.2.11. Market Revenue and Forecast, by End-use (2020-2032)
13.2.12. France
13.2.12.1. Market Revenue and Forecast, by Component (2020-2032)
13.2.12.2. Market Revenue and Forecast, by Technology (2020-2032)
13.2.12.3. Market Revenue and Forecast, by Functionality (2020-2032)
13.2.12.4. Market Revenue and Forecast, by Application (2020-2032)
13.2.13. Market Revenue and Forecast, by End-use (2020-2032)
13.2.14. Rest of Europe
13.2.14.1. Market Revenue and Forecast, by Component (2020-2032)
13.2.14.2. Market Revenue and Forecast, by Technology (2020-2032)
13.2.14.3. Market Revenue and Forecast, by Functionality (2020-2032)
13.2.14.4. Market Revenue and Forecast, by Application (2020-2032)
13.2.15. Market Revenue and Forecast, by End-use (2020-2032)
13.3. APAC
13.3.1. Market Revenue and Forecast, by Component (2020-2032)
13.3.2. Market Revenue and Forecast, by Technology (2020-2032)
13.3.3. Market Revenue and Forecast, by Functionality (2020-2032)
13.3.4. Market Revenue and Forecast, by Application (2020-2032)
13.3.5. Market Revenue and Forecast, by End-use (2020-2032)
13.3.6. India
13.3.6.1. Market Revenue and Forecast, by Component (2020-2032)
13.3.6.2. Market Revenue and Forecast, by Technology (2020-2032)
13.3.6.3. Market Revenue and Forecast, by Functionality (2020-2032)
13.3.6.4. Market Revenue and Forecast, by Application (2020-2032)
13.3.7. Market Revenue and Forecast, by End-use (2020-2032)
13.3.8. China
13.3.8.1. Market Revenue and Forecast, by Component (2020-2032)
13.3.8.2. Market Revenue and Forecast, by Technology (2020-2032)
13.3.8.3. Market Revenue and Forecast, by Functionality (2020-2032)
13.3.8.4. Market Revenue and Forecast, by Application (2020-2032)
13.3.9. Market Revenue and Forecast, by End-use (2020-2032)
13.3.10. Japan
13.3.10.1. Market Revenue and Forecast, by Component (2020-2032)
13.3.10.2. Market Revenue and Forecast, by Technology (2020-2032)
13.3.10.3. Market Revenue and Forecast, by Functionality (2020-2032)
13.3.10.4. Market Revenue and Forecast, by Application (2020-2032)
13.3.10.5. Market Revenue and Forecast, by End-use (2020-2032)
13.3.11. Rest of APAC
13.3.11.1. Market Revenue and Forecast, by Component (2020-2032)
13.3.11.2. Market Revenue and Forecast, by Technology (2020-2032)
13.3.11.3. Market Revenue and Forecast, by Functionality (2020-2032)
13.3.11.4. Market Revenue and Forecast, by Application (2020-2032)
13.3.11.5. Market Revenue and Forecast, by End-use (2020-2032)
13.4. MEA
13.4.1. Market Revenue and Forecast, by Component (2020-2032)
13.4.2. Market Revenue and Forecast, by Technology (2020-2032)
13.4.3. Market Revenue and Forecast, by Functionality (2020-2032)
13.4.4. Market Revenue and Forecast, by Application (2020-2032)
13.4.5. Market Revenue and Forecast, by End-use (2020-2032)
13.4.6. GCC
13.4.6.1. Market Revenue and Forecast, by Component (2020-2032)
13.4.6.2. Market Revenue and Forecast, by Technology (2020-2032)
13.4.6.3. Market Revenue and Forecast, by Functionality (2020-2032)
13.4.6.4. Market Revenue and Forecast, by Application (2020-2032)
13.4.7. Market Revenue and Forecast, by End-use (2020-2032)
13.4.8. North Africa
13.4.8.1. Market Revenue and Forecast, by Component (2020-2032)
13.4.8.2. Market Revenue and Forecast, by Technology (2020-2032)
13.4.8.3. Market Revenue and Forecast, by Functionality (2020-2032)
13.4.8.4. Market Revenue and Forecast, by Application (2020-2032)
13.4.9. Market Revenue and Forecast, by End-use (2020-2032)
13.4.10. South Africa
13.4.10.1. Market Revenue and Forecast, by Component (2020-2032)
13.4.10.2. Market Revenue and Forecast, by Technology (2020-2032)
13.4.10.3. Market Revenue and Forecast, by Functionality (2020-2032)
13.4.10.4. Market Revenue and Forecast, by Application (2020-2032)
13.4.10.5. Market Revenue and Forecast, by End-use (2020-2032)
13.4.11. Rest of MEA
13.4.11.1. Market Revenue and Forecast, by Component (2020-2032)
13.4.11.2. Market Revenue and Forecast, by Technology (2020-2032)
13.4.11.3. Market Revenue and Forecast, by Functionality (2020-2032)
13.4.11.4. Market Revenue and Forecast, by Application (2020-2032)
13.4.11.5. Market Revenue and Forecast, by End-use (2020-2032)
13.5. Latin America
13.5.1. Market Revenue and Forecast, by Component (2020-2032)
13.5.2. Market Revenue and Forecast, by Technology (2020-2032)
13.5.3. Market Revenue and Forecast, by Functionality (2020-2032)
13.5.4. Market Revenue and Forecast, by Application (2020-2032)
13.5.5. Market Revenue and Forecast, by End-use (2020-2032)
13.5.6. Brazil
13.5.6.1. Market Revenue and Forecast, by Component (2020-2032)
13.5.6.2. Market Revenue and Forecast, by Technology (2020-2032)
13.5.6.3. Market Revenue and Forecast, by Functionality (2020-2032)
13.5.6.4. Market Revenue and Forecast, by Application (2020-2032)
13.5.7. Market Revenue and Forecast, by End-use (2020-2032)
13.5.8. Rest of LATAM
13.5.8.1. Market Revenue and Forecast, by Component (2020-2032)
13.5.8.2. Market Revenue and Forecast, by Technology (2020-2032)
13.5.8.3. Market Revenue and Forecast, by Functionality (2020-2032)
13.5.8.4. Market Revenue and Forecast, by Application (2020-2032)
13.5.8.5. Market Revenue and Forecast, by End-use (2020-2032)
Chapter 14. Company Profiles
14.1. IBM
14.1.1. Company Overview
14.1.2. Product Offerings
14.1.3. Financial Performance
14.1.4. Recent Initiatives
14.2. Microsoft Corporation
14.2.1. Company Overview
14.2.2. Product Offerings
14.2.3. Financial Performance
14.2.4. Recent Initiatives
14.3. NVIDIA Corporation
14.3.1. Company Overview
14.3.2. Product Offerings
14.3.3. Financial Performance
14.3.4. Recent Initiatives
14.4. DEEP GENOMICS
14.4.1. Company Overview
14.4.2. Product Offerings
14.4.3. Financial Performance
14.4.4. Recent Initiatives
14.5. Data4Cure, Inc.
14.5.1. Company Overview
14.5.2. Product Offerings
14.5.3. Financial Performance
14.5.4. Recent Initiatives
14.6. Freenome Holdings, Inc.
14.6.1. Company Overview
14.6.2. Product Offerings
14.6.3. Financial Performance
14.6.4. Recent Initiatives
14.7. Thermo Fisher Scientific
14.7.1. Company Overview
14.7.2. Product Offerings
14.7.3. Financial Performance
14.7.4. Recent Initiatives
14.8. Illumina, Inc.
14.8.1. Company Overview
14.8.2. Product Offerings
14.8.3. Financial Performance
14.8.4. Recent Initiatives
14.9. SOPHiA GENETICS
14.9.1. Company Overview
14.9.2. Product Offerings
14.9.3. Financial Performance
14.9.4. Recent Initiatives
14.10. BenevolentAI
14.10.1. Company Overview
14.10.2. Product Offerings
14.10.3. Financial Performance
14.10.4. Recent Initiatives
Chapter 15. Research Methodology
15.1. Primary Research
15.2. Secondary Research
15.3. Assumptions
Chapter 16. Appendix
16.1. About Us
16.2. Glossary of Terms
 Cross-segment Market Size and Analysis for
Mentioned Segments
Additional Company Profiles (Upto 5 With No Cost)
Additional Countries (Apart From Mentioned Countries)
Country/Region-specific Report
Go To Market Strategy
Region Specific Market DynamicsRegion Level Market Share Import Export AnalysisProduction AnalysisOthers
Cross-segment Market Size and Analysis for
Mentioned Segments
Additional Company Profiles (Upto 5 With No Cost)
Additional Countries (Apart From Mentioned Countries)
Country/Region-specific Report
Go To Market Strategy
Region Specific Market DynamicsRegion Level Market Share Import Export AnalysisProduction AnalysisOthers