Allogeneic Cell Therapy Market Size, Share | Report 2023-2032
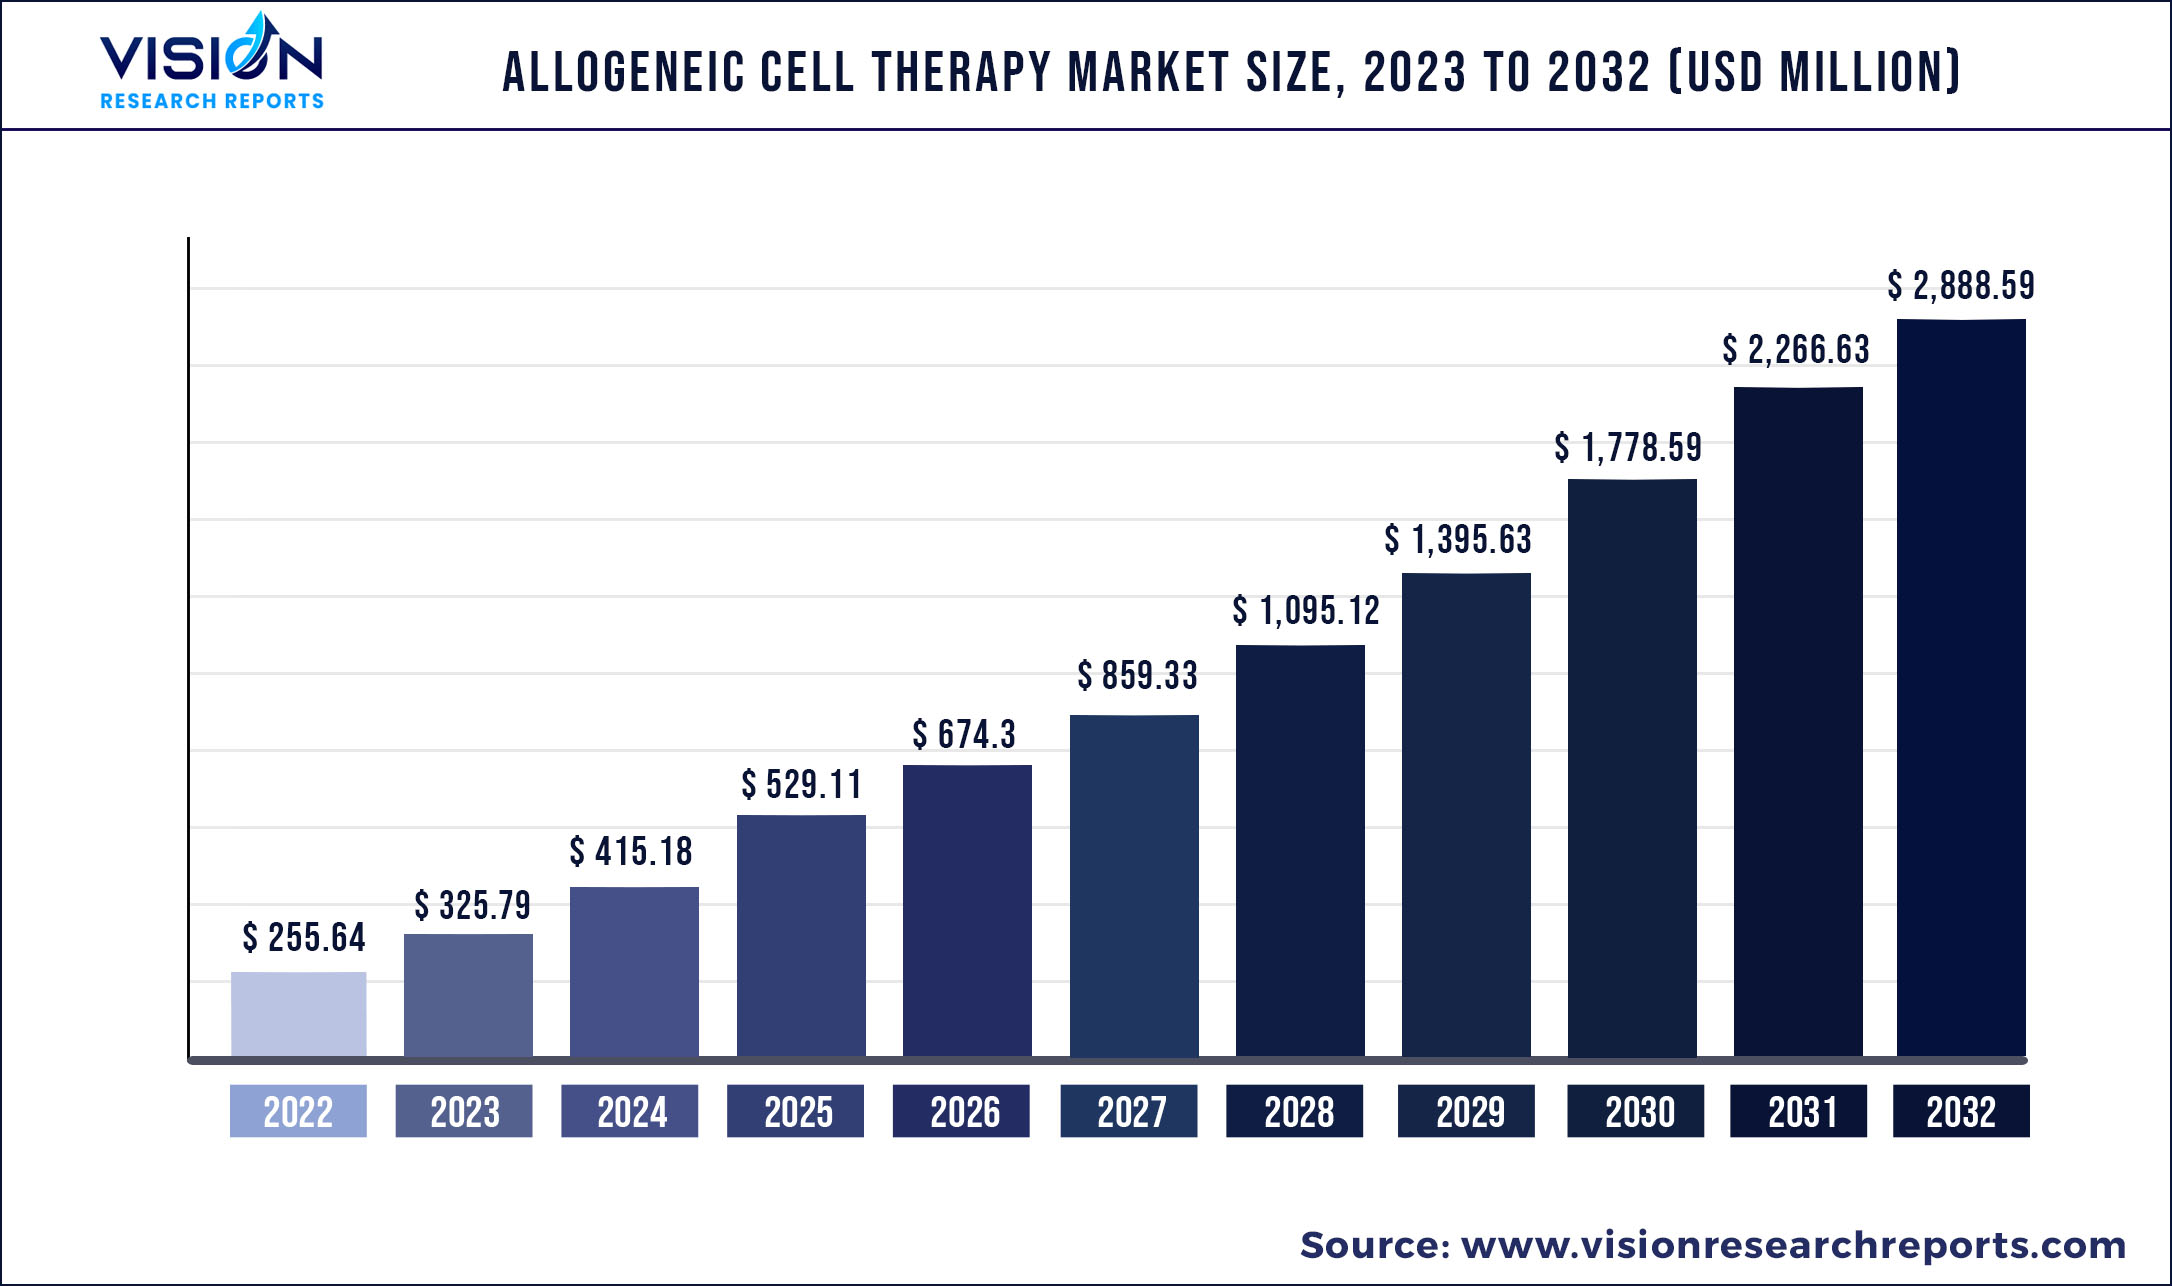
The global allogeneic cell therapy market size was estimated at around USD 255.64 million in 2022 and it is projected to hit around USD 2,888.59 million by 2032, growing at a CAGR of 27.44% from 2023 to 2032.
Key Pointers
Report Scope of the Allogeneic Cell Therapy Market
| Report Coverage | Details |
| Market Size in 2022 | USD 255.64 million |
| Revenue Forecast by 2032 | USD 2,888.59 million |
| Growth rate from 2023 to 2032 | CAGR of 27.44% |
| Base Year | 2022 |
| Forecast Period | 2023 to 2032 |
| Market Analysis (Terms Used) | Value (US$ Million/Billion) or (Volume/Units) |
| Regions Covered | North America, Europe, Asia Pacific, Latin America, Middle East & Africa |
| Companies Covered | SSM Cardinal Glennon Children's Medical Center; Cleveland Cord Blood Center; Duke University School of Medicine; New York Blood Center; Clinimmune Labs; University of Colorado Cord Blood Bank; MD Anderson Cord Blood Bank; LifeSouth Community Blood Centers, Inc.; Bloodworks Northwest; JCR Pharmaceuticals Co., Ltd.; Sumitomo Pharma Co., Ltd.; Atara Biotherapeutics; Mallinckrodt Pharmaceuticals; Tego Science Inc; Takeda Pharmaceutical Company Limited; STEMPEUTICS RESEARCH PVT LTD; Biosolution Co., Ltd.; MEDIPOST Co., Ltd. |
The growing incidence of chronic diseases such as cancer, cardiovascular diseases, autoimmune disorders, and genetic diseases is expected to drive the growth of the allogeneic cell therapy industry. According to estimates published by the American Cancer Society, 1.9 million new cancer cases were diagnosed in the U.S. alone in 2022, resulting in over 609,000 deaths. Moreover, the aging population worldwide is expected to contribute to a further increase in the global burden of chronic diseases. These factors indicate the critical need for advanced medical treatments, such as allogeneic cell therapy, to treat chronic diseases and improve patient outcomes.
The COVID-19 pandemic had an unfavorable impact on the allogeneic cell therapy industry, causing a decline in research and development activities. This disrupted various processes, including research, clinical trials, manufacturing, and logistics, ultimately affecting the quality of clinical evidence for cell and gene therapies. As a result, evaluating the treatment benefits and economic impacts of these therapies has become more challenging.
However, the pandemic has also raised awareness about the use of cell therapy as a potential treatment option for COVID-19. This increasing awareness is expected to have a positive impact on the market in the coming years. For instance, in May 2020, Lineage Cell Therapeutics received USD 5 million in emergency funding from the California Institute for Regenerative Medicine (CIRM) to develop a potential vaccine against SARS-CoV-2 using VAC, their allogeneic dendritic cell therapy.
Furthermore, the increasing need for advanced medical treatments for chronic diseases has led to a surge in clinical trials for cell therapies. According to data published by ClinicalTrials.gov, as of April 2021, there were 1,358 active cell therapy trials, representing a 43% increase from 2020 to 2021, compared to a 24% increase from 2019 to 2020. The majority of this growth has been due to CAR-T cell clinical trials, which have increased by 83%.
Moreover, there has been a shift in the focus of clinical trials from autologous to allogeneic cell therapy, with many companies conducting clinical trials on allogeneic cell therapy candidates for various diseases, such as cancer, genetic disorders, and autoimmune diseases. This trend is expected to continue, as there is increasing interest from governments, private organizations, and biotechnology companies in the development of allogeneic cell therapies.
Furthermore, the allogeneic cell therapy industry is expected to grow due to the increasing investments in research and development by governments and private & public organizations. For instance, in November 2022, the California Institute for Regenerative Medicine (CIRM) Board awarded over USD 6 million to Jianhua Yu at the Beckman Research Institute of City of Hope for developing a new approach to target hypoxia metastatic breast tumors with allogeneic off-the-shelf anti-EGFR CAR NK cells. This approach aims to improve the efficacy and safety of cancer therapy.
Allogeneic Cell Therapy Market Segmentations:
By Therapy Type
By Therapeutic Area
Chapter 1. Introduction
1.1. Research Objective
1.2. Scope of the Study
1.3. Definition
Chapter 2. Research Methodology
2.1. Research Approach
2.2. Data Sources
2.3. Assumptions & Limitations
Chapter 3. Executive Summary
3.1. Market Snapshot
Chapter 4. Market Variables and Scope
4.1. Introduction
4.2. Market Classification and Scope
4.3. Industry Value Chain Analysis
4.3.1. Raw Material Procurement Analysis
4.3.2. Sales and Distribution Channel Analysis
4.3.3. Downstream Buyer Analysis
Chapter 5. COVID 19 Impact on Allogeneic Cell Therapy Market
5.1. COVID-19 Landscape: Allogeneic Cell Therapy Industry Impact
5.2. COVID 19 - Impact Assessment for the Industry
5.3. COVID 19 Impact: Global Major Government Policy
5.4. Market Trends and Opportunities in the COVID-19 Landscape
Chapter 6. Market Dynamics Analysis and Trends
6.1. Market Dynamics
6.1.1. Market Drivers
6.1.2. Market Restraints
6.1.3. Market Opportunities
6.2. Porter’s Five Forces Analysis
6.2.1. Bargaining power of suppliers
6.2.2. Bargaining power of buyers
6.2.3. Threat of substitute
6.2.4. Threat of new entrants
6.2.5. Degree of competition
Chapter 7. Competitive Landscape
7.1.1. Company Market Share/Positioning Analysis
7.1.2. Key Strategies Adopted by Players
7.1.3. Vendor Landscape
7.1.3.1. List of Suppliers
7.1.3.2. List of Buyers
Chapter 8. Global Allogeneic Cell Therapy Market, By Therapy Type
8.1. Allogeneic Cell Therapy Market, by Therapy Type, 2023-2032
8.1.1. Stem Cell Therapies
8.1.1.1. Market Revenue and Forecast (2020-2032)
8.1.2. Non-stem Cell Therapies
8.1.2.1. Market Revenue and Forecast (2020-2032)
Chapter 9. Global Allogeneic Cell Therapy Market, By Therapeutic Area
9.1. Allogeneic Cell Therapy Market, by Therapeutic Area, 2023-2032
9.1.1. Hematological Disorders
9.1.1.1. Market Revenue and Forecast (2020-2032)
9.1.2. Dermatological Disorders
9.1.2.1. Market Revenue and Forecast (2020-2032)
9.1.3. Others
9.1.3.1. Market Revenue and Forecast (2020-2032)
Chapter 10. Global Allogeneic Cell Therapy Market, Regional Estimates and Trend Forecast
10.1. North America
10.1.1. Market Revenue and Forecast, by Therapy Type (2020-2032)
10.1.2. Market Revenue and Forecast, by Therapeutic Area (2020-2032)
10.1.3. U.S.
10.1.3.1. Market Revenue and Forecast, by Therapy Type (2020-2032)
10.1.3.2. Market Revenue and Forecast, by Therapeutic Area (2020-2032)
10.1.4. Rest of North America
10.1.4.1. Market Revenue and Forecast, by Therapy Type (2020-2032)
10.1.4.2. Market Revenue and Forecast, by Therapeutic Area (2020-2032)
10.2. Europe
10.2.1. Market Revenue and Forecast, by Therapy Type (2020-2032)
10.2.2. Market Revenue and Forecast, by Therapeutic Area (2020-2032)
10.2.3. UK
10.2.3.1. Market Revenue and Forecast, by Therapy Type (2020-2032)
10.2.3.2. Market Revenue and Forecast, by Therapeutic Area (2020-2032)
10.2.4. Germany
10.2.4.1. Market Revenue and Forecast, by Therapy Type (2020-2032)
10.2.4.2. Market Revenue and Forecast, by Therapeutic Area (2020-2032)
10.2.5. France
10.2.5.1. Market Revenue and Forecast, by Therapy Type (2020-2032)
10.2.5.2. Market Revenue and Forecast, by Therapeutic Area (2020-2032)
10.2.6. Rest of Europe
10.2.6.1. Market Revenue and Forecast, by Therapy Type (2020-2032)
10.2.6.2. Market Revenue and Forecast, by Therapeutic Area (2020-2032)
10.3. APAC
10.3.1. Market Revenue and Forecast, by Therapy Type (2020-2032)
10.3.2. Market Revenue and Forecast, by Therapeutic Area (2020-2032)
10.3.3. India
10.3.3.1. Market Revenue and Forecast, by Therapy Type (2020-2032)
10.3.3.2. Market Revenue and Forecast, by Therapeutic Area (2020-2032)
10.3.4. China
10.3.4.1. Market Revenue and Forecast, by Therapy Type (2020-2032)
10.3.4.2. Market Revenue and Forecast, by Therapeutic Area (2020-2032)
10.3.5. Japan
10.3.5.1. Market Revenue and Forecast, by Therapy Type (2020-2032)
10.3.5.2. Market Revenue and Forecast, by Therapeutic Area (2020-2032)
10.3.6. Rest of APAC
10.3.6.1. Market Revenue and Forecast, by Therapy Type (2020-2032)
10.3.6.2. Market Revenue and Forecast, by Therapeutic Area (2020-2032)
10.4. MEA
10.4.1. Market Revenue and Forecast, by Therapy Type (2020-2032)
10.4.2. Market Revenue and Forecast, by Therapeutic Area (2020-2032)
10.4.3. GCC
10.4.3.1. Market Revenue and Forecast, by Therapy Type (2020-2032)
10.4.3.2. Market Revenue and Forecast, by Therapeutic Area (2020-2032)
10.4.4. North Africa
10.4.4.1. Market Revenue and Forecast, by Therapy Type (2020-2032)
10.4.4.2. Market Revenue and Forecast, by Therapeutic Area (2020-2032)
10.4.5. South Africa
10.4.5.1. Market Revenue and Forecast, by Therapy Type (2020-2032)
10.4.5.2. Market Revenue and Forecast, by Therapeutic Area (2020-2032)
10.4.6. Rest of MEA
10.4.6.1. Market Revenue and Forecast, by Therapy Type (2020-2032)
10.4.6.2. Market Revenue and Forecast, by Therapeutic Area (2020-2032)
10.5. Latin America
10.5.1. Market Revenue and Forecast, by Therapy Type (2020-2032)
10.5.2. Market Revenue and Forecast, by Therapeutic Area (2020-2032)
10.5.3. Brazil
10.5.3.1. Market Revenue and Forecast, by Therapy Type (2020-2032)
10.5.3.2. Market Revenue and Forecast, by Therapeutic Area (2020-2032)
10.5.4. Rest of LATAM
10.5.4.1. Market Revenue and Forecast, by Therapy Type (2020-2032)
10.5.4.2. Market Revenue and Forecast, by Therapeutic Area (2020-2032)
Chapter 11. Company Profiles
11.1. SSM Cardinal Glennon Children's Medical Center
11.1.1. Company Overview
11.1.2. Product Offerings
11.1.3. Financial Performance
11.1.4. Recent Initiatives
11.2. Cleveland Cord Blood Cente
11.2.1. Company Overview
11.2.2. Product Offerings
11.2.3. Financial Performance
11.2.4. Recent Initiatives
11.3. Duke University School of Medicine
11.3.1. Company Overview
11.3.2. Product Offerings
11.3.3. Financial Performance
11.3.4. Recent Initiatives
11.4. New York Blood Center
11.4.1. Company Overview
11.4.2. Product Offerings
11.4.3. Financial Performance
11.4.4. LTE Scientific
11.5. Clinimmune Labs
11.5.1. Company Overview
11.5.2. Product Offerings
11.5.3. Financial Performance
11.5.4. Recent Initiatives
11.6. University of Colorado Cord Blood Bank
11.6.1. Company Overview
11.6.2. Product Offerings
11.6.3. Financial Performance
11.6.4. Recent Initiatives
11.7. MD Anderson Cord Blood Bank
11.7.1. Company Overview
11.7.2. Product Offerings
11.7.3. Financial Performance
11.7.4. Recent Initiatives
11.8. LifeSouth Community Blood Centers, Inc.
11.8.1. Company Overview
11.8.2. Product Offerings
11.8.3. Financial Performance
11.8.4. Recent Initiatives
11.9. Bloodworks Northwest
11.9.1. Company Overview
11.9.2. Product Offerings
11.9.3. Financial Performance
11.9.4. Recent Initiatives
11.10. JCR Pharmaceuticals Co., Ltd.
11.10.1. Company Overview
11.10.2. Product Offerings
11.10.3. Financial Performance
11.10.4. Recent Initiatives
Chapter 12. Research Methodology
12.1. Primary Research
12.2. Secondary Research
12.3. Assumptions
Chapter 13. Appendix
13.1. About Us
13.2. Glossary of Terms
 Cross-segment Market Size and Analysis for
Mentioned Segments
Additional Company Profiles (Upto 5 With No Cost)
Additional Countries (Apart From Mentioned Countries)
Country/Region-specific Report
Go To Market Strategy
Region Specific Market DynamicsRegion Level Market Share Import Export AnalysisProduction AnalysisOthers
Cross-segment Market Size and Analysis for
Mentioned Segments
Additional Company Profiles (Upto 5 With No Cost)
Additional Countries (Apart From Mentioned Countries)
Country/Region-specific Report
Go To Market Strategy
Region Specific Market DynamicsRegion Level Market Share Import Export AnalysisProduction AnalysisOthers