Artemisinic Acid Market Size, Share, Growth, Trends | Report 2023-2032
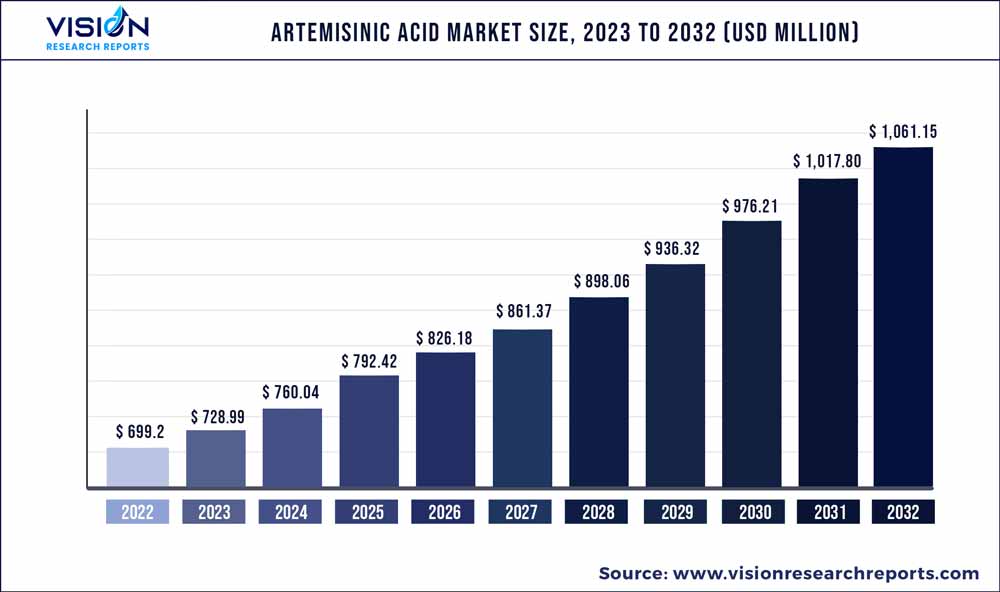
The global artemisinic acid market size was estimated at around USD 699.2 million in 2022 and it is projected to hit around USD 1,061.15 million by 2032, growing at a CAGR of 4.26% from 2023 to 2032.
Key Pointers
Report Scope of the Artemisinic Acid Market
| Report Coverage | Details |
| Market Size in 2022 | USD 699.2 million |
| Revenue Forecast by 2032 | USD 1,061.15 million |
| Growth rate from 2023 to 2032 | CAGR of 4.26% |
| Base Year | 2022 |
| Forecast Period | 2023 to 2032 |
| Market Analysis (Terms Used) | Value (US$ Million/Billion) or (Volume/Units) |
| Regions Covered | North America, Europe, Asia Pacific, Latin America, Middle East & Africa |
| Companies Covered | Sanofi; KPC Pharmaceuticals, Inc.; Guilin Pharmaceutical Co., Ltd; Calyx Chemicals and Pharmaceuticals Ltd.; Novartis AG; Ipca Laboratories Ltd.; Cipla Inc.; Shin Poong Pharm Co., Ltd.; Rupus Global Limited; AdvacarePharma |
Growth can be attributed to the high burden of malaria in underdeveloped and developing economies, a large number of research studies concerning Malaria, and initiatives by public organizations such as the WHO, UNICEF, and others. These organizations are committed to controlling the incidences of malaria globally by creating awareness about malaria treatment.
Developing and underdeveloped economies suffer from a high burden of malaria. For instance, as per UNICEF, malaria is a major cause of death among children in Africa. The WHO states that 95% of total malaria cases were reported in Africa region. The high burden of diseases in this region is expected to boost the demand for artemisinic acid, especially in these regions, and thus boost the market.
Public organizations globally are trying to reduce the incidence of malaria by improving access to detection, treatment, and prevention of the disease. Moreover, organizations such as WHO, UNICEF, the government organization are actively involved in raising awareness about malaria treatment to reduce the spread of the infection. This is expected to improve the demand for artemisinic acid during the forecast period.
The Global Fund states that there was a fall in malaria diagnosis and treatment in 2020 as compared to the previous year. This is because the majority of diagnosis was done for testing COVID-19. This initially hampered the market of artemisinic acid. However, World Malaria Report states that malaria incidences totaled 247 million in 2021, whereas in 2020, the figure stood at 245 million. The increase in the incidence of malaria is expected to boost the demand for malaria treatments and boost the market in the post-pandemic period.
Type Insights
The antimalarial tablets segment led the market with the highest revenue share of 80.81% in 2022. The segment is also expected to grow at the fastest rate of 4.35% CAGR. Based on type, the market is segmented into antimalarial injections and antimalarial tablets. Tablets are an oral way of drug administration. Tablets are self-administering and do not require a trained physician for drug administration, which is one of the major reasons for the high acceptance of tablet formulations. Moreover, tablet formulations offer high patient compliance, accurate dosing, control of drug release, and stability. This further improves the demand for antimalarial tablet formulations in the market.
The antimalarial injection segment is anticipated to witness a growth rate of 4.2% over the forecast period. Antimalarial injections are used for severe malaria cases, especially during the time of emergencies. The high bioavailability of injectable formulations leading to the immediate onset of action is the prime factor for its demand in the market. The high number of hospitalizations due to malaria worldwide is expected to boost the segment market growth further.
Regional Insights
The Middle East region registered the largest market share of 56.9% in 2022. The regional market growth is expected to grow at the fastest rate of 4.33% across the forecast. Africa is one of the major countries which suffers significantly from malaria. For instance, UNICEF reports that every minute a child under 5 years dies from malaria in Africa. In MEA, public organizations are keen to provide treatment to reduce the number of deaths associated with the disease.
For instance, the WHO in 2021 stated that The African Region of the WHO accounts for a large part of the global malaria burden. In 2021, the region accounted to have 95% of malaria cases and 96% of malaria deaths. The high burden of the disease and the initiative by public organizations to raise awareness regarding the treatment for malaria is benefiting the growth of the regional market.
The Asia Pacific region accounted for the second largest share of 31.85% in 2022. Countries such as India, Pakistan, Indonesia, and others suffer from a high burden of malaria cases in the region. India is known for the world's third-highest malaria burden. The initiatives taken by public organizations in the APAC countries to reduce the burden of malaria and provide proper treatment are expected to boost the market in Asia Pacific. For instance, The government of India developed a National Strategic Plan (NSP, 2017-2022) and National Framework for Malaria Elimination (2016-2030) to eradicate malaria disease by providing treatment at a low cost. Such initiatives are likely to support the market in Asia Pacific in the forecast.
Artemisinic Acid Market Segmentations:
By Type
By Regional
Chapter 1. Introduction
1.1.Research Objective
1.2.Scope of the Study
1.3.Definition
Chapter 2. Research Methodology
2.1.Research Approach
2.2.Data Sources
2.3.Assumptions & Limitations
Chapter 3. Executive Summary
3.1.Market Snapshot
Chapter 4. Market Variables and Scope
4.1.Introduction
4.2.Market Classification and Scope
4.3.Industry Value Chain Analysis
4.3.1. Raw Material Procurement Analysis
4.3.2. Sales and Distribution Channel Analysis
4.3.3. Downstream Buyer Analysis
Chapter 5.COVID 19 Impact on Artemisinic Acid Market
5.1. COVID-19 Landscape: Artemisinic Acid Industry Impact
5.2. COVID 19 - Impact Assessment for the Industry
5.3. COVID 19 Impact: Global Major Government Policy
5.4.Market Trends and Opportunities in the COVID-19 Landscape
Chapter 6. Market Dynamics Analysis and Trends
6.1.Market Dynamics
6.1.1. Market Drivers
6.1.2. Market Restraints
6.1.3. Market Opportunities
6.2.Porter’s Five Forces Analysis
6.2.1. Bargaining power of suppliers
6.2.2. Bargaining power of buyers
6.2.3. Threat of substitute
6.2.4. Threat of new entrants
6.2.5. Degree of competition
Chapter 7. Competitive Landscape
7.1.1. Company Market Share/Positioning Analysis
7.1.2. Key Strategies Adopted by Players
7.1.3. Vendor Landscape
7.1.3.1.List of Suppliers
7.1.3.2.List of Buyers
Chapter 8. Global Artemisinic Acid Market, By Type
8.1.Artemisinic Acid Market, by Type Type, 2023-2032
8.1.1. Antimalarial Injections
8.1.1.1.Market Revenue and Forecast (2020-2032)
8.1.2. Antimalarial Tablets
8.1.2.1.Market Revenue and Forecast (2020-2032)
Chapter 9. Global Artemisinic Acid Market, Regional Estimates and Trend Forecast
9.1. North America
9.1.1. Market Revenue and Forecast, by Type (2020-2032)
9.1.2. U.S.
9.1.2.1. Market Revenue and Forecast, by Type (2020-2032)
9.1.3. Rest of North America
9.1.3.1. Market Revenue and Forecast, by Type (2020-2032)
9.2. Europe
9.2.1. Market Revenue and Forecast, by Type (2020-2032)
9.2.2. UK
9.2.2.1. Market Revenue and Forecast, by Type (2020-2032)
9.2.3. Germany
9.2.3.1. Market Revenue and Forecast, by Type (2020-2032)
9.2.4. France
9.2.4.1. Market Revenue and Forecast, by Type (2020-2032)
9.2.5. Rest of Europe
9.2.5.1. Market Revenue and Forecast, by Type (2020-2032)
9.3. APAC
9.3.1. Market Revenue and Forecast, by Type (2020-2032)
9.3.2. India
9.3.2.1. Market Revenue and Forecast, by Type (2020-2032)
9.3.3. China
9.3.3.1. Market Revenue and Forecast, by Type (2020-2032)
9.3.4. Japan
9.3.4.1. Market Revenue and Forecast, by Type (2020-2032)
9.3.5. Rest of APAC
9.3.5.1. Market Revenue and Forecast, by Type (2020-2032)
9.4. MEA
9.4.1. Market Revenue and Forecast, by Type (2020-2032)
9.4.2. GCC
9.4.2.1. Market Revenue and Forecast, by Type (2020-2032)
9.4.3. North Africa
9.4.3.1. Market Revenue and Forecast, by Type (2020-2032)
9.4.4. South Africa
9.4.4.1. Market Revenue and Forecast, by Type (2020-2032)
9.4.5. Rest of MEA
9.4.5.1. Market Revenue and Forecast, by Type (2020-2032)
9.5. Latin America
9.5.1. Market Revenue and Forecast, by Type (2020-2032)
9.5.2. Brazil
9.5.2.1. Market Revenue and Forecast, by Type (2020-2032)
9.5.3. Rest of LATAM
9.5.3.1. Market Revenue and Forecast, by Type (2020-2032)
Chapter 10.Company Profiles
10.1. Sanofi
10.1.1.Company Overview
10.1.2.Product Offerings
10.1.3.Financial Performance
10.1.4.Recent Initiatives
10.2. KPC Pharmaceuticals, Inc.
10.2.1.Company Overview
10.2.2.Product Offerings
10.2.3.Financial Performance
10.2.4.Recent Initiatives
10.3. Guilin Pharmaceutical Co., Ltd
10.3.1.Company Overview
10.3.2.Product Offerings
10.3.3.Financial Performance
10.3.4.Recent Initiatives
10.4. Calyx Chemicals and Pharmaceuticals Ltd.
10.4.1.Company Overview
10.4.2.Product Offerings
10.4.3.Financial Performance
10.4.4.Recent Initiatives
10.5. Novartis AG
10.5.1.Company Overview
10.5.2.Product Offerings
10.5.3.Financial Performance
10.5.4.Recent Initiatives
10.6. Ipca Laboratories Ltd.
10.6.1.Company Overview
10.6.2.Product Offerings
10.6.3.Financial Performance
10.6.4.Recent Initiatives
10.7. Cipla Inc.
10.7.1.Company Overview
10.7.2.Product Offerings
10.7.3.Financial Performance
10.7.4.Recent Initiatives
10.8. Shin Poong Pharm Co., Ltd.
10.8.1.Company Overview
10.8.2.Product Offerings
10.8.3.Financial Performance
10.8.4.Recent Initiatives
10.9. Rupus Global Limited
10.9.1.Company Overview
10.9.2.Product Offerings
10.9.3.Financial Performance
10.9.4.Recent Initiatives
10.10. AdvacarePharma
10.10.1. Company Overview
10.10.2. Product Offerings
10.10.3. Financial Performance
10.10.4. Recent Initiatives
Chapter 11.Research Methodology
11.1.Primary Research
11.2.Secondary Research
11.3.Assumptions
Chapter 12.Appendix
12.1. About Us
12.2. Glossary of Terms
 Cross-segment Market Size and Analysis for
Mentioned Segments
Additional Company Profiles (Upto 5 With No Cost)
Additional Countries (Apart From Mentioned Countries)
Country/Region-specific Report
Go To Market Strategy
Region Specific Market DynamicsRegion Level Market Share Import Export AnalysisProduction AnalysisOthers
Cross-segment Market Size and Analysis for
Mentioned Segments
Additional Company Profiles (Upto 5 With No Cost)
Additional Countries (Apart From Mentioned Countries)
Country/Region-specific Report
Go To Market Strategy
Region Specific Market DynamicsRegion Level Market Share Import Export AnalysisProduction AnalysisOthers