Augmented Reality & Virtual Reality In Healthcare Market Size, Share | Report 2023-2032
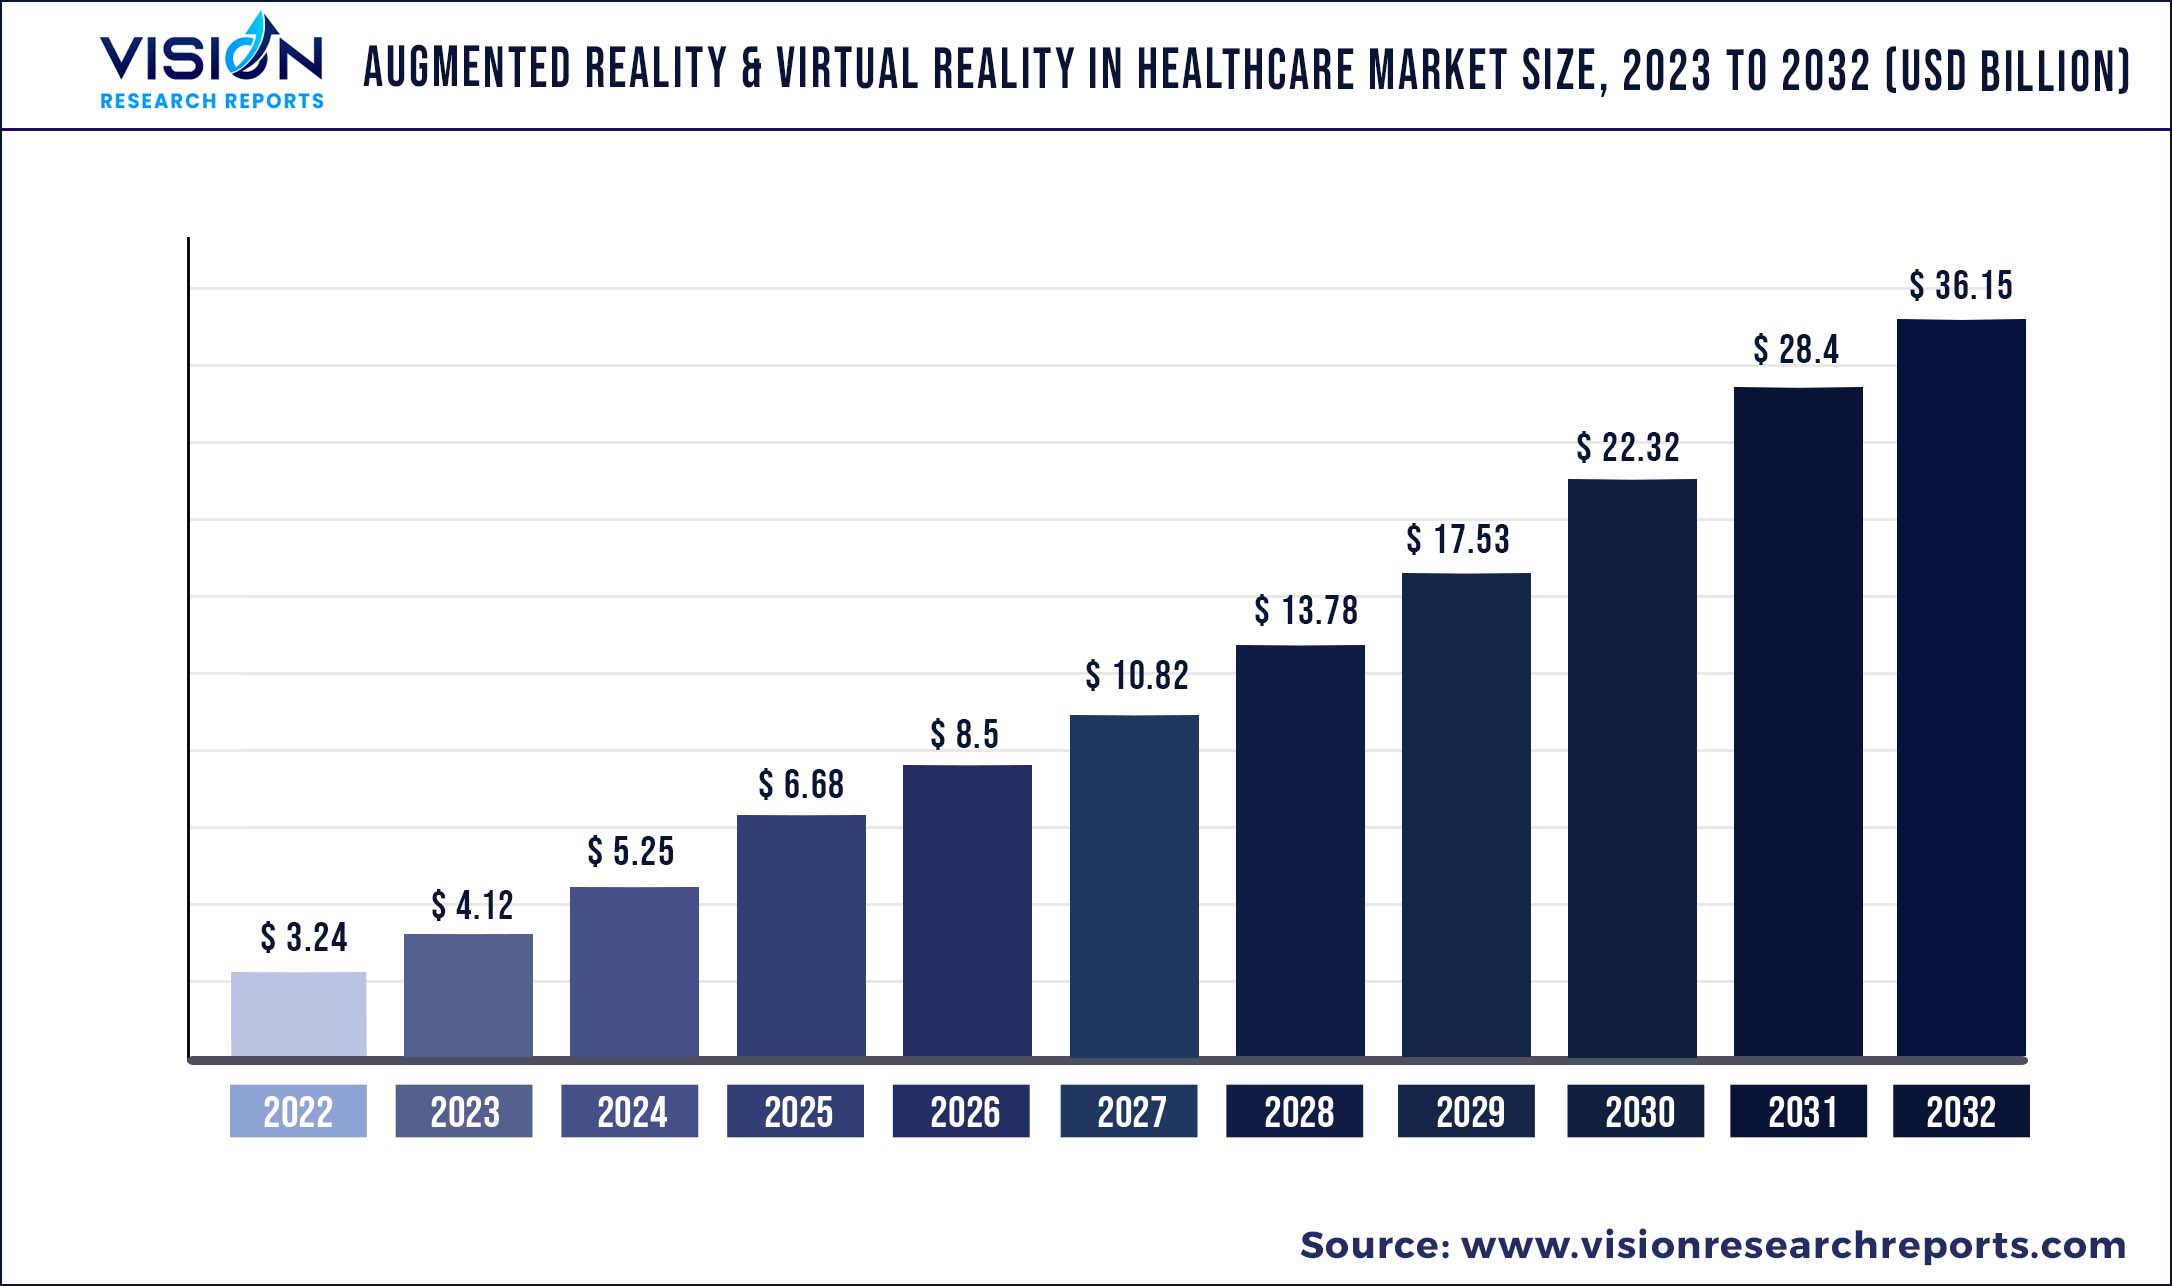
The global augmented reality & virtual reality in healthcare market size was estimated at around USD 3.24 billion in 2022 and it is projected to hit around USD 36.15 billion by 2032, growing at a CAGR of 27.28% from 2023 to 2032.
Key Pointers
Report Scope of the Augmented Reality & Virtual Reality In Healthcare Market
| Report Coverage | Details |
| Market Size in 2022 | USD 3.24 billion |
| Revenue Forecast by 2032 | USD 36.15 billion |
| Growth rate from 2023 to 2032 | CAGR of 27.28% |
| Base Year | 2022 |
| Forecast Period | 2023 to 2032 |
| Regions Covered | North America, Europe, Asia Pacific, Latin America, Middle East & Africa |
| Companies Covered | CAE; GE Healthcare; Koninklijke Philips N.V.; Intuitive Surgical; Siemens Ltd.; Eon Reality, Inc.; Layar; BioflightVR; WorldViz; TheraSim Inc.; Mindmaze |
Technological advancements and digitalization in healthcare, favorable government initiatives, rising healthcare expenditure, growing usage in surgical procedures, and medical training are some of the fundamental factors anticipated to boost the growth and adoption of the augmented reality (AR) and virtual reality (VR) technologies in the healthcare industry. These technologies have wide applications in healthcare including surgeries, diagnostics, rehabilitation, training, and education.
Augmented and virtual reality techniques are being increasingly adopted in surgeries and diagnostics. Systems such as touch surgery use virtual reality to provide a view of the patient’s anatomy and physiology, thereby providing opportunities for surgeons in the operating room, This, in turn, is expected to augment the growth of the market for augmented reality and virtual reality in healthcare. The growing adoption of Augmented Reality (AR) and Virtual Reality (VR) technologies in medical surgeries to optimize surgical procedures and increase the efficiency of treatment is one of the key factors driving market growth over the past few years. For instance, in December 2019, Augmedics launched the Xvision Spine AR guidance system for spine surgeries in the U.S. This solution allows the surgeon to view the 3D spinal anatomy of the patient during the surgery. Augmedics also received the U.S. FDA approval for Xvision in December 2019. Moreover, the increasing practice of storing medical images and patient data on the AR/VR platform helps in reducing requirements for expensive screens and unnecessary staff.
Additionally, AR is being widely adopted for education and training purposes for medical personnel. Since AR-based learning modules provide anatomical visualization and simulation it gives the medical personnel a more wholesome complete learning experience. Moreover, these learning modules are even being used to train patients and helps them understand the treatment flow and care management better. AR-based image visualization assists the surgeons and enhancing their accuracy and precision during complex surgeries. For instance, in February 2019 Philips Healthcare collaborated with Azurion and Microsoft to develop a mixed reality concept to provide a 3D holographic AR environment derived from multiple image modalities to assist surgeons.
During the outbreak of the COVID-19 pandemic, AR & VR in healthcare was influenced positively owing to the technological advancements in this space. For instance, in April 2020 XRHealth extended its application by raising USD 7 million to expand its telehealth platform. Similarly, Imperial College and St. Mary’s Hospital in London are using augmented reality glasses to visualize 3D imaging of blood vessels during reconstructive surgeries. Augmented reality and virtual reality in healthcare help in efficiently managing the treatment schedules, treatment delivery, and plans, and thereby it is anticipated to exponentially grow during the pandemic. Additionally, the decreasing costs in healthcare, rapid digitalization of healthcare, and improved delivery of effective health services are expected to drive growth. AR and VR in healthcare are gaining momentum due to widespread adoption in telemedicine, medical training & education, patient care management, medical marketing during the COVID-19 pandemic.
Augmented Reality & Virtual Reality In Healthcare Market Segmentations:
By Component
By Technology
Chapter 1. Introduction
1.1. Research Objective
1.2. Scope of the Study
1.3. Definition
Chapter 2. Research Methodology
2.1. Research Approach
2.2. Data Sources
2.3. Assumptions & Limitations
Chapter 3. Executive Summary
3.1. Market Snapshot
Chapter 4. Market Variables and Scope
4.1. Introduction
4.2. Market Classification and Scope
4.3. Industry Value Chain Analysis
4.3.1. Raw Material Procurement Analysis
4.3.2. Sales and Distribution Channel Analysis
4.3.3. Downstream Buyer Analysis
Chapter 5. COVID 19 Impact on Augmented Reality & Virtual Reality In Healthcare Market
5.1. COVID-19 Landscape: Augmented Reality & Virtual Reality In Healthcare Industry Impact
5.2. COVID 19 - Impact Assessment for the Industry
5.3. COVID 19 Impact: Global Major Government Policy
5.4. Market Trends and Opportunities in the COVID-19 Landscape
Chapter 6. Market Dynamics Analysis and Trends
6.1. Market Dynamics
6.1.1. Market Drivers
6.1.2. Market Restraints
6.1.3. Market Opportunities
6.2. Porter’s Five Forces Analysis
6.2.1. Bargaining power of suppliers
6.2.2. Bargaining power of buyers
6.2.3. Threat of substitute
6.2.4. Threat of new entrants
6.2.5. Degree of competition
Chapter 7. Competitive Landscape
7.1.1. Company Market Share/Positioning Analysis
7.1.2. Key Strategies Adopted by Players
7.1.3. Vendor Landscape
7.1.3.1. List of Suppliers
7.1.3.2. List of Buyers
Chapter 8. Global Augmented Reality & Virtual Reality In Healthcare Market, By Component
8.1. Augmented Reality & Virtual Reality In Healthcare Market, by Component, 2023-2032
8.1.1. Hardware
8.1.1.1. Market Revenue and Forecast (2020-2032)
8.1.2. Software
8.1.2.1. Market Revenue and Forecast (2020-2032)
8.1.3. Services
8.1.3.1. Market Revenue and Forecast (2020-2032)
Chapter 9. Global Augmented Reality & Virtual Reality In Healthcare Market, By Technology
9.1. Augmented Reality & Virtual Reality In Healthcare Market, by Technology, 2023-2032
9.1.1. Augmented Reality
9.1.1.1. Market Revenue and Forecast (2020-2032)
9.1.2. Virtual Reality
9.1.2.1. Market Revenue and Forecast (2020-2032)
Chapter 10. Global Augmented Reality & Virtual Reality In Healthcare Market, Regional Estimates and Trend Forecast
10.1. North America
10.1.1. Market Revenue and Forecast, by Component (2020-2032)
10.1.2. Market Revenue and Forecast, by Technology (2020-2032)
10.1.3. U.S.
10.1.3.1. Market Revenue and Forecast, by Component (2020-2032)
10.1.3.2. Market Revenue and Forecast, by Technology (2020-2032)
10.1.4. Rest of North America
10.1.4.1. Market Revenue and Forecast, by Component (2020-2032)
10.1.4.2. Market Revenue and Forecast, by Technology (2020-2032)
10.2. Europe
10.2.1. Market Revenue and Forecast, by Component (2020-2032)
10.2.2. Market Revenue and Forecast, by Technology (2020-2032)
10.2.3. UK
10.2.3.1. Market Revenue and Forecast, by Component (2020-2032)
10.2.3.2. Market Revenue and Forecast, by Technology (2020-2032)
10.2.4. Germany
10.2.4.1. Market Revenue and Forecast, by Component (2020-2032)
10.2.4.2. Market Revenue and Forecast, by Technology (2020-2032)
10.2.5. France
10.2.5.1. Market Revenue and Forecast, by Component (2020-2032)
10.2.5.2. Market Revenue and Forecast, by Technology (2020-2032)
10.2.6. Rest of Europe
10.2.6.1. Market Revenue and Forecast, by Component (2020-2032)
10.2.6.2. Market Revenue and Forecast, by Technology (2020-2032)
10.3. APAC
10.3.1. Market Revenue and Forecast, by Component (2020-2032)
10.3.2. Market Revenue and Forecast, by Technology (2020-2032)
10.3.3. India
10.3.3.1. Market Revenue and Forecast, by Component (2020-2032)
10.3.3.2. Market Revenue and Forecast, by Technology (2020-2032)
10.3.4. China
10.3.4.1. Market Revenue and Forecast, by Component (2020-2032)
10.3.4.2. Market Revenue and Forecast, by Technology (2020-2032)
10.3.5. Japan
10.3.5.1. Market Revenue and Forecast, by Component (2020-2032)
10.3.5.2. Market Revenue and Forecast, by Technology (2020-2032)
10.3.6. Rest of APAC
10.3.6.1. Market Revenue and Forecast, by Component (2020-2032)
10.3.6.2. Market Revenue and Forecast, by Technology (2020-2032)
10.4. MEA
10.4.1. Market Revenue and Forecast, by Component (2020-2032)
10.4.2. Market Revenue and Forecast, by Technology (2020-2032)
10.4.3. GCC
10.4.3.1. Market Revenue and Forecast, by Component (2020-2032)
10.4.3.2. Market Revenue and Forecast, by Technology (2020-2032)
10.4.4. North Africa
10.4.4.1. Market Revenue and Forecast, by Component (2020-2032)
10.4.4.2. Market Revenue and Forecast, by Technology (2020-2032)
10.4.5. South Africa
10.4.5.1. Market Revenue and Forecast, by Component (2020-2032)
10.4.5.2. Market Revenue and Forecast, by Technology (2020-2032)
10.4.6. Rest of MEA
10.4.6.1. Market Revenue and Forecast, by Component (2020-2032)
10.4.6.2. Market Revenue and Forecast, by Technology (2020-2032)
10.5. Latin America
10.5.1. Market Revenue and Forecast, by Component (2020-2032)
10.5.2. Market Revenue and Forecast, by Technology (2020-2032)
10.5.3. Brazil
10.5.3.1. Market Revenue and Forecast, by Component (2020-2032)
10.5.3.2. Market Revenue and Forecast, by Technology (2020-2032)
10.5.4. Rest of LATAM
10.5.4.1. Market Revenue and Forecast, by Component (2020-2032)
10.5.4.2. Market Revenue and Forecast, by Technology (2020-2032)
Chapter 11. Company Profiles
11.1. CAE
11.1.1. Company Overview
11.1.2. Product Offerings
11.1.3. Financial Performance
11.1.4. Recent Initiatives
11.2. GE Healthcare
11.2.1. Company Overview
11.2.2. Product Offerings
11.2.3. Financial Performance
11.2.4. Recent Initiatives
11.3. Koninklijke Philips N.V.
11.3.1. Company Overview
11.3.2. Product Offerings
11.3.3. Financial Performance
11.3.4. Recent Initiatives
11.4. Intuitive Surgical
11.4.1. Company Overview
11.4.2. Product Offerings
11.4.3. Financial Performance
11.4.4. LTE Scientific
11.5. Siemens Ltd.
11.5.1. Company Overview
11.5.2. Product Offerings
11.5.3. Financial Performance
11.5.4. Recent Initiatives
11.6. Eon Reality, Inc.
11.6.1. Company Overview
11.6.2. Product Offerings
11.6.3. Financial Performance
11.6.4. Recent Initiatives
11.7. Layar
11.7.1. Company Overview
11.7.2. Product Offerings
11.7.3. Financial Performance
11.7.4. Recent Initiatives
11.8. BioflightVR
11.8.1. Company Overview
11.8.2. Product Offerings
11.8.3. Financial Performance
11.8.4. Recent Initiatives
11.9. WorldViz
11.9.1. Company Overview
11.9.2. Product Offerings
11.9.3. Financial Performance
11.9.4. Recent Initiatives
11.10. TheraSim Inc.
11.10.1. Company Overview
11.10.2. Product Offerings
11.10.3. Financial Performance
11.10.4. Recent Initiatives
Chapter 12. Research Methodology
12.1. Primary Research
12.2. Secondary Research
12.3. Assumptions
Chapter 13. Appendix
13.1. About Us
13.2. Glossary of Terms
 Cross-segment Market Size and Analysis for
Mentioned Segments
Additional Company Profiles (Upto 5 With No Cost)
Additional Countries (Apart From Mentioned Countries)
Country/Region-specific Report
Go To Market Strategy
Region Specific Market DynamicsRegion Level Market Share Import Export AnalysisProduction AnalysisOthers
Cross-segment Market Size and Analysis for
Mentioned Segments
Additional Company Profiles (Upto 5 With No Cost)
Additional Countries (Apart From Mentioned Countries)
Country/Region-specific Report
Go To Market Strategy
Region Specific Market DynamicsRegion Level Market Share Import Export AnalysisProduction AnalysisOthers