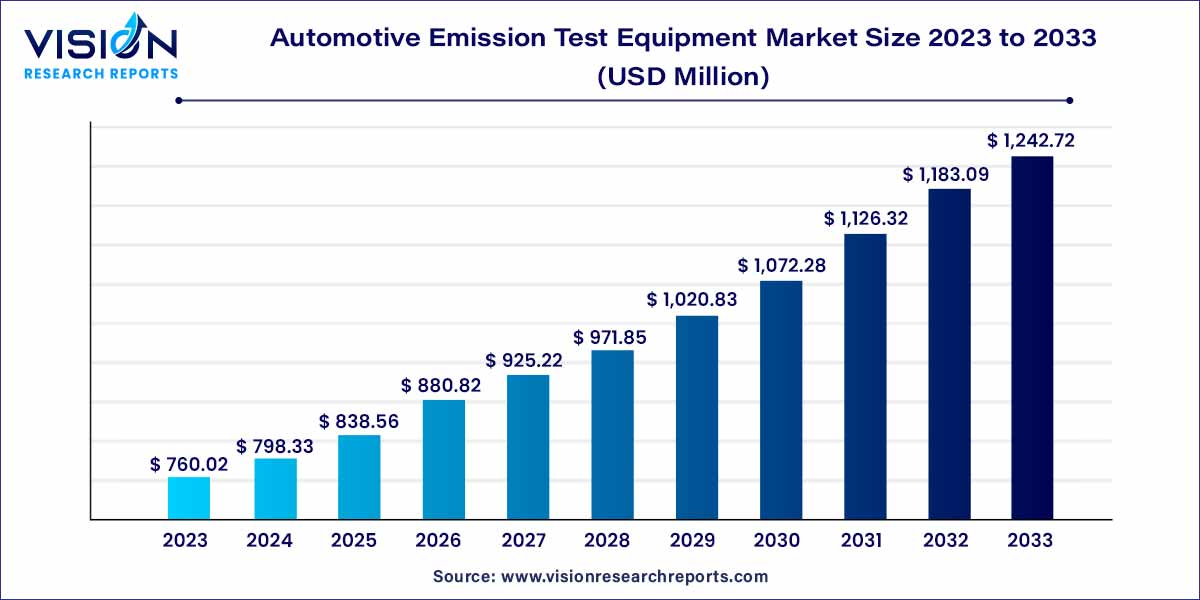
The global automotive emission test equipment market size was estimated at around USD 760.02 million in 2023 and it is projected to hit around USD 1,242.72 million by 2033, growing at a CAGR of 5.04% from 2024 to 2033. Factors that are expected to propel market expansion include the growing requirement for road vehicle allowable emission limits, laws governing the discharge of hazardous substances, and strict adherence to mandates and rules.

The automotive industry is undergoing a paradigm shift towards environmentally conscious practices, with a heightened focus on reducing vehicular emissions. The automotive emission test equipment market serves as a crucial component in ensuring compliance with stringent emission standards set forth by regulatory bodies globally. This overview provides a glimpse into the key aspects driving the market's significance.
The growth of the automotive emission test equipment market is fueled by several key factors. Firstly, the tightening grip of emission regulations worldwide has become a major growth driver, compelling automotive manufacturers to invest in advanced testing technologies to ensure compliance. Secondly, continuous technological advancements in sensing technologies and data analytics have led to the development of more accurate and efficient emission testing equipment, stimulating market growth. Furthermore, the escalating production within the global automotive industry amplifies the demand for emission test equipment, as manufacturers strive to meet and surpass regional and international emission standards. This confluence of regulatory pressures, technological progress, and increased automotive production collectively propels the expansion of the automotive emission test equipment market.
| Report Coverage | Details |
| Market Revenue by 2033 | USD 1,242.72 million |
| Growth Rate from 2024 to 2033 | CAGR of 5.04% |
| Revenue Share of Europe in 2023 | 34% |
| CAGR of Asia Pacific from 2024 to 2033 | 6.26% |
| Base Year | 2023 |
| Forecast Period | 2024 to 2033 |
| Market Analysis (Terms Used) | Value (US$ Million/Billion) or (Volume/Units) |
Growing Automotive Production:
The expansion of the global automotive industry is a key driver for the market. With the rise in vehicle production, manufacturers seek reliable and efficient emission testing solutions to ensure compliance with regional and international emission norms, further boosting the market's growth.
Public Health Concerns:
The link between vehicular emissions and public health issues intensifies the demand for accurate emission testing. As the impact of pollutants on respiratory health and overall well-being becomes more evident, there is a heightened focus on minimizing emissions through rigorous testing measures.
Integration Challenges:
Integrating new emission test equipment into existing automotive production processes can be challenging. Compatibility issues, workflow disruptions, and the need for additional training can slow down the adoption of advanced technologies, particularly in established manufacturing setups.
Limited Awareness and Training:
Despite the growing importance of emission testing, there remains a level of limited awareness and understanding among industry stakeholders. The lack of comprehensive training programs and educational initiatives may hinder the effective utilization of advanced emission test equipment, slowing down market growth.
Rising Demand for Electric and Hybrid Vehicles:
The transition to electric and hybrid vehicles presents a significant opportunity for the automotive emission test equipment market. As the automotive industry shifts towards cleaner technologies, there is a growing need for specialized emission testing equipment tailored to these alternative propulsion systems.
Development of Portable and Onboard Testing Solutions:
The demand for portable and onboard emission testing solutions is on the rise. This presents an opportunity for market players to develop compact and mobile equipment that can be used for on-the-road emissions testing, providing a more comprehensive assessment of vehicle emissions in real-world conditions.
The emission test equipment segment held the largest market share of 48% in 2023. Moreover, this segment is anticipated to continue its dominance over the forecast period on account of the rising demand for testing equipment worldwide. The segment holds a substantial market share as compared to the software segment.
The emission test services segment is expected to register the highest CAGR of 5.83% during the forecast period. The strong demand can be attributed to the increasing emphasis placed on reducing the release of greenhouse gases by passenger and light-duty vehicles, especially in developing countries such as China and India.
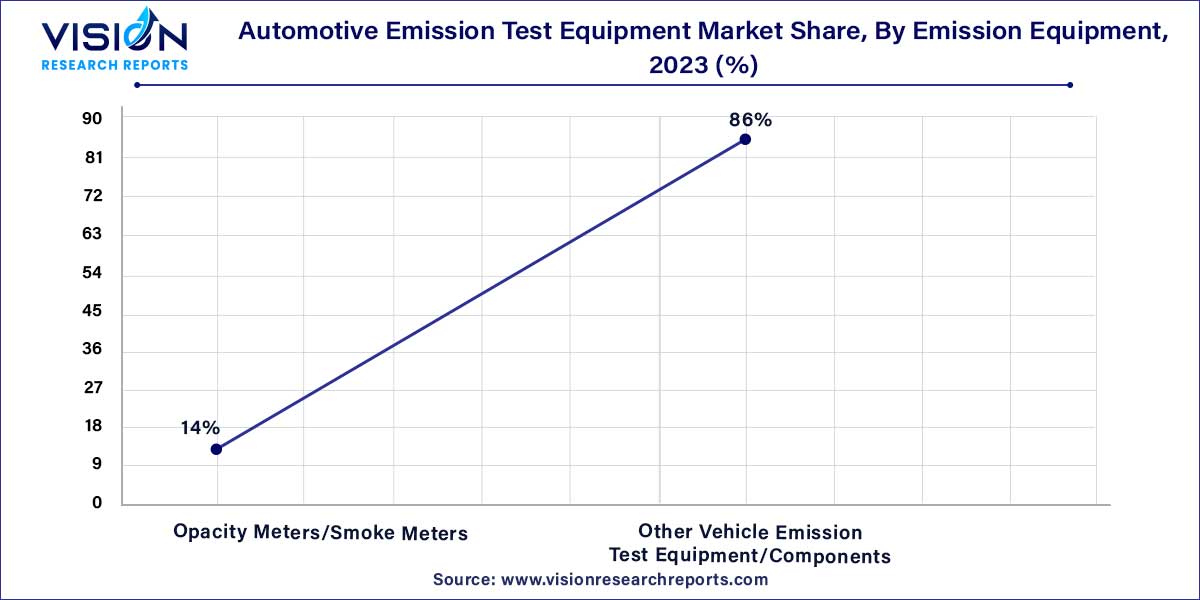
The other vehicle emission test equipment/components segment dominated the market with 86% of the global revenue share in 2023. The segment is anticipated to maintain its dominance over the forecast period. The growth is attributed to the rising demand for automotive emission test systems by a large number of automobile manufacturers across the world. Advancements in vehicle emission diagnostic systems, such as onboard diagnostic tools, are also driving the growth of the other equipment segment.

The opacity meters/smoke meters segment is projected to expand at a significant CAGR of 3.14% during the forecast period. The demand for smoke meters is rising steadily, as they are used to detect and measure smoke emitted from diesel engines. Opacity meters find significant utilization in periodic technical inspection (PTI) and inspection & maintenance (I&M) programs.
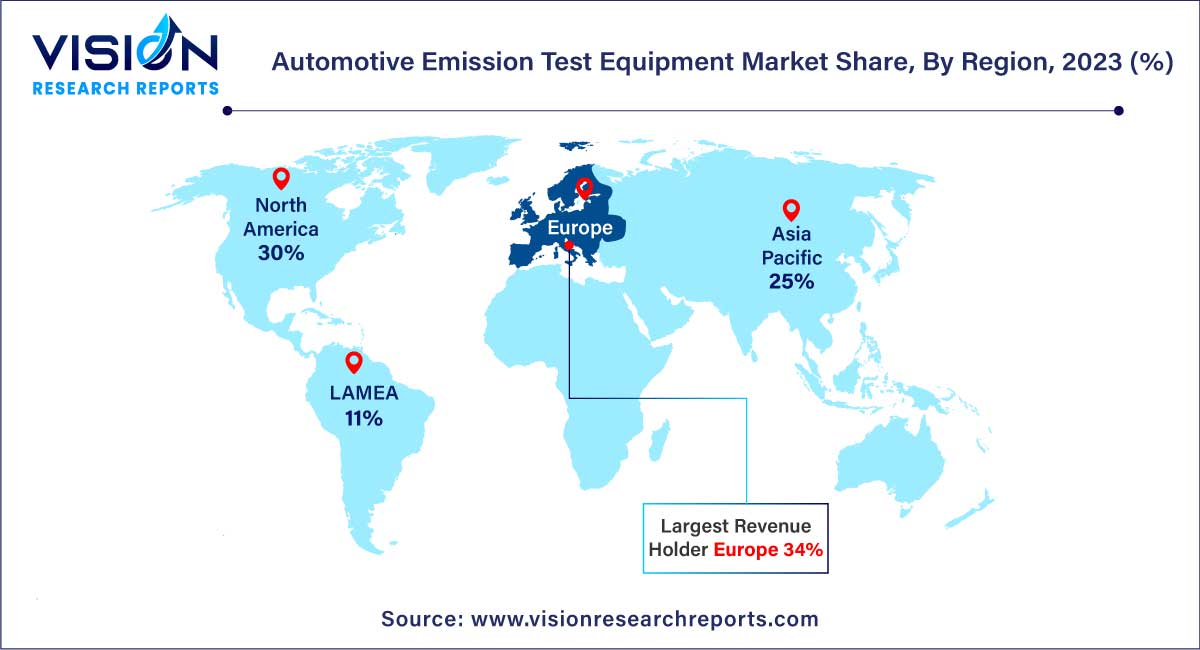
Europe dominated the market with the highest revenue share of 34% in 2023. Countries in the region, such as the U.K., Germany, and the Netherlands, are at the forefront of adopting vehicle emission testing norms, as well as stringent rules and regulations as prescribed by the European Union.

The Asia Pacific region is expected to expand at the fastest CAGR of 6.26% during the forecast period. The increasing urbanization in this region is encouraging the introduction and implementation of numerous initiatives taken by regional countries that are aimed at regulating and monitoring vehicle exhausts. Besides, the region is transforming into the largest automobile manufacturing hub owing to the low production costs, creating significant market opportunities.
In January 2021, Capelec, in partnership with IFPEN, developed Real-e, a connected tool that measures emissions in a vehicle’s exhaust gases in actual driving conditions. These measurements are based on the driving style, traffic conditions, and the kind of journey
In February 2021, HORIBA announced that its vehicle emission test automation software, STAR VETS, had been made available for the Windows 10 64-bit operating system. The software ensures that vehicle emission tests run efficiently and smoothly with preloaded processes, configuration data, and results calculations for a broad range of regulatory compliances
By Solution
By Emission Equipment
By Region
Chapter 1. Introduction
1.1. Research Objective
1.2. Scope of the Study
1.3. Definition
Chapter 2. Research Methodology
2.1. Research Approach
2.2. Data Sources
2.3. Assumptions & Limitations
Chapter 3. Executive Summary
3.1. Market Snapshot
Chapter 4. Market Variables and Scope
4.1. Introduction
4.2. Market Classification and Scope
4.3. Industry Value Chain Analysis
4.3.1. Raw Material Procurement Analysis
4.3.2. Sales and Distribution Channel Analysis
4.3.3. Downstream Buyer Analysis
Chapter 5. COVID 19 Impact on Automotive Emission Test Equipment Market
5.1. COVID-19 Landscape: Automotive Emission Test Equipment Industry Impact
5.2. COVID 19 - Impact Assessment for the Industry
5.3. COVID 19 Impact: Global Major Government Policy
5.4. Market Trends and Opportunities in the COVID-19 Landscape
Chapter 6. Market Dynamics Analysis and Trends
6.1. Market Dynamics
6.1.1. Market Drivers
6.1.2. Market Restraints
6.1.3. Market Opportunities
6.2. Porter’s Five Forces Analysis
6.2.1. Bargaining power of suppliers
6.2.2. Bargaining power of buyers
6.2.3. Threat of substitute
6.2.4. Threat of new entrants
6.2.5. Degree of competition
Chapter 7. Competitive Landscape
7.1.1. Company Market Share/Positioning Analysis
7.1.2. Key Strategies Adopted by Players
7.1.3. Vendor Landscape
7.1.3.1. List of Suppliers
7.1.3.2. List of Buyers
Chapter 8. Global Automotive Emission Test Equipment Market, By Solution
8.1. Automotive Emission Test Equipment Market, by Solution, 2024-2033
8.1.1. Emission Test Equipment
8.1.1.1. Market Revenue and Forecast (2021-2033)
8.1.2. Emission Test Software
8.1.2.1. Market Revenue and Forecast (2021-2033)
8.1.3. Emission Test Services
8.1.3.1. Market Revenue and Forecast (2021-2033)
Chapter 9. Global Automotive Emission Test Equipment Market, By Emission Equipment
9.1. Automotive Emission Test Equipment Market, by Emission Equipment, 2024-2033
9.1.1. Opacity Meters/Smoke Meters
9.1.1.1. Market Revenue and Forecast (2021-2033)
9.1.2. Other Vehicle Emission Test Equipment/Components
9.1.2.1. Market Revenue and Forecast (2021-2033)
Chapter 10. Global Automotive Emission Test Equipment Market, Regional Estimates and Trend Forecast
10.1. North America
10.1.1. Market Revenue and Forecast, by Solution (2021-2033)
10.1.2. Market Revenue and Forecast, by Emission Equipment (2021-2033)
10.1.3. U.S.
10.1.3.1. Market Revenue and Forecast, by Solution (2021-2033)
10.1.3.2. Market Revenue and Forecast, by Emission Equipment (2021-2033)
10.1.4. Rest of North America
10.1.4.1. Market Revenue and Forecast, by Solution (2021-2033)
10.1.4.2. Market Revenue and Forecast, by Emission Equipment (2021-2033)
10.2. Europe
10.2.1. Market Revenue and Forecast, by Solution (2021-2033)
10.2.2. Market Revenue and Forecast, by Emission Equipment (2021-2033)
10.2.3. UK
10.2.3.1. Market Revenue and Forecast, by Solution (2021-2033)
10.2.3.2. Market Revenue and Forecast, by Emission Equipment (2021-2033)
10.2.4. Germany
10.2.4.1. Market Revenue and Forecast, by Solution (2021-2033)
10.2.4.2. Market Revenue and Forecast, by Emission Equipment (2021-2033)
10.2.5. France
10.2.5.1. Market Revenue and Forecast, by Solution (2021-2033)
10.2.5.2. Market Revenue and Forecast, by Emission Equipment (2021-2033)
10.2.6. Rest of Europe
10.2.6.1. Market Revenue and Forecast, by Solution (2021-2033)
10.2.6.2. Market Revenue and Forecast, by Emission Equipment (2021-2033)
10.3. APAC
10.3.1. Market Revenue and Forecast, by Solution (2021-2033)
10.3.2. Market Revenue and Forecast, by Emission Equipment (2021-2033)
10.3.3. India
10.3.3.1. Market Revenue and Forecast, by Solution (2021-2033)
10.3.3.2. Market Revenue and Forecast, by Emission Equipment (2021-2033)
10.3.4. China
10.3.4.1. Market Revenue and Forecast, by Solution (2021-2033)
10.3.4.2. Market Revenue and Forecast, by Emission Equipment (2021-2033)
10.3.5. Japan
10.3.5.1. Market Revenue and Forecast, by Solution (2021-2033)
10.3.5.2. Market Revenue and Forecast, by Emission Equipment (2021-2033)
10.3.6. Rest of APAC
10.3.6.1. Market Revenue and Forecast, by Solution (2021-2033)
10.3.6.2. Market Revenue and Forecast, by Emission Equipment (2021-2033)
10.4. MEA
10.4.1. Market Revenue and Forecast, by Solution (2021-2033)
10.4.2. Market Revenue and Forecast, by Emission Equipment (2021-2033)
10.4.3. GCC
10.4.3.1. Market Revenue and Forecast, by Solution (2021-2033)
10.4.3.2. Market Revenue and Forecast, by Emission Equipment (2021-2033)
10.4.4. North Africa
10.4.4.1. Market Revenue and Forecast, by Solution (2021-2033)
10.4.4.2. Market Revenue and Forecast, by Emission Equipment (2021-2033)
10.4.5. South Africa
10.4.5.1. Market Revenue and Forecast, by Solution (2021-2033)
10.4.5.2. Market Revenue and Forecast, by Emission Equipment (2021-2033)
10.4.6. Rest of MEA
10.4.6.1. Market Revenue and Forecast, by Solution (2021-2033)
10.4.6.2. Market Revenue and Forecast, by Emission Equipment (2021-2033)
10.5. Latin America
10.5.1. Market Revenue and Forecast, by Solution (2021-2033)
10.5.2. Market Revenue and Forecast, by Emission Equipment (2021-2033)
10.5.3. Brazil
10.5.3.1. Market Revenue and Forecast, by Solution (2021-2033)
10.5.3.2. Market Revenue and Forecast, by Emission Equipment (2021-2033)
10.5.4. Rest of LATAM
10.5.4.1. Market Revenue and Forecast, by Solution (2021-2033)
10.5.4.2. Market Revenue and Forecast, by Emission Equipment (2021-2033)
Chapter 11. Company Profiles
11.1. Opus Inspection
11.1.1. Company Overview
11.1.2. Product Offerings
11.1.3. Financial Performance
11.1.4. Recent Initiatives
11.2. GEMCO Equipment Ltd.
11.2.1. Company Overview
11.2.2. Product Offerings
11.2.3. Financial Performance
11.2.4. Recent Initiatives
11.3. TÜV Nord Group
11.3.1. Company Overview
11.3.2. Product Offerings
11.3.3. Financial Performance
11.3.4. Recent Initiatives
11.4. CAPELEC
11.4.1. Company Overview
11.4.2. Product Offerings
11.4.3. Financial Performance
11.4.4. LTE Scientific
11.5. HORIBA, Ltd.
11.5.1. Company Overview
11.5.2. Product Offerings
11.5.3. Financial Performance
11.5.4. Recent Initiatives
11.6. Applus+
11.6.1. Company Overview
11.6.2. Product Offerings
11.6.3. Financial Performance
11.6.4. Recent Initiatives
11.7. SGS SA
11.7.1. Company Overview
11.7.2. Product Offerings
11.7.3. Financial Performance
11.7.4. Recent Initiatives
11.8. AVL List GmbH
11.8.1. Company Overview
11.8.2. Product Offerings
11.8.3. Financial Performance
11.8.4. Recent Initiatives
11.9. TEXA S.p.A.
11.9.1. Company Overview
11.9.2. Product Offerings
11.9.3. Financial Performance
11.9.4. Recent Initiatives
Chapter 12. Research Methodology
12.1. Primary Research
12.2. Secondary Research
12.3. Assumptions
Chapter 13. Appendix
13.1. About Us
13.2. Glossary of Terms
 Cross-segment Market Size and Analysis for
Mentioned Segments
 Additional Company Profiles (Upto 5 With No Cost)
 Additional Countries (Apart From Mentioned Countries)
 Country/Region-specific Report
 Go To Market Strategy
 Region Specific Market Dynamics
 Region Level Market Share
 Import Export Analysis
 Production Analysis
 Others