The global bio-LNG market was surpassed at USD 0.63 billion in 2022 and is expected to hit around USD 28.46 billion by 2032, growing at a CAGR of 46.43%from 2023 to 2032. The bio-LNG market in the United States was accounted for USD 110 million in 2022.

Key Pointers
Report Scope of the Bio-LNG Market
| Report Coverage | Details |
| Revenue Share of Europe in 2022 | 60% |
| Revenue Forecast by 2032 | USD 28.46 billion |
| Growth Rate from 2023 to 2032 | CAGR of 46.43% |
| Base Year | 2022 |
| Forecast Period | 2023 to 2032 |
| Market Analysis (Terms Used) | Value (US$ Million/Billion) or (Volume/Units) |
| Companies Covered | Linde plc; Nordsol; Flogas Britain Ltd.; MEGA a.s.; AXEGAZ T&T; TotalEnergies; Titan LNG; DBG Group B.V.; BoxLNG Pvt. Ltd.; Shell Plc |
As more organic waste streams become available, such as agricultural and forestry residues and food waste, there is an increasing supply of feedstock for bio-LNG production. This has helped to drive down the cost of production and increase the viability of bio-LNG as a fuel source. The U.S. emerged as the largest market in North America in 2022. The U.S. government has implemented several programs to encourage the production and use of renewable fuels, including bio-LNG. For example, the Renewable Fuel Standard (RFS) requires a certain quantity of renewable fuels to be blended into transportation fuels each year. Similarly, several states have implemented their own renewable fuel standards or incentives, further driving demand for bio-LNG.
The increasing market for bio-LNG is also being driven by the transportation sector. As more companies look to reduce their carbon emissions, bio-LNG is becoming an attractive alternative to diesel and gasoline. It can be used in a variety of transportation applications, including heavy-duty trucks, buses, and even ships. In fact, several major shipping companies have already started using bio-LNG as fuel for their vessels, further driving the demand for bio-LNG.
Application Insights
In terms of revenue, the transportation fuel segment led the bio-LNG market in 2022, accounting for a revenue share of 55%. The demand for bio-LNG has been growing in transportation fuel and power generation segments, owing to low pollution caused by the fuel. Bio-LNG is a low-carbon fuel that emits significantly less greenhouse gases (GHGs) than diesel or gasoline. It can reduce GHG emissions by up to 90% compared to diesel, which makes it an attractive option for companies and governments seeking to reduce their carbon footprint.
While bio-LNG may be more expensive than diesel in some cases, the cost differential is narrowing as production scales up and technology improves. As a result, bio-LNG is becoming increasingly cost-competitive with traditional fuels, particularly in regions where there are incentives or regulations in place to promote the use of low-carbon fuels. Bio-LNG can be transported using existing natural gas pipelines and infrastructure, which makes it relatively easy to distribute and use. Some companies are investing in dedicated bio-LNG production and distribution infrastructure to further promote its usage.
Source Type Insights
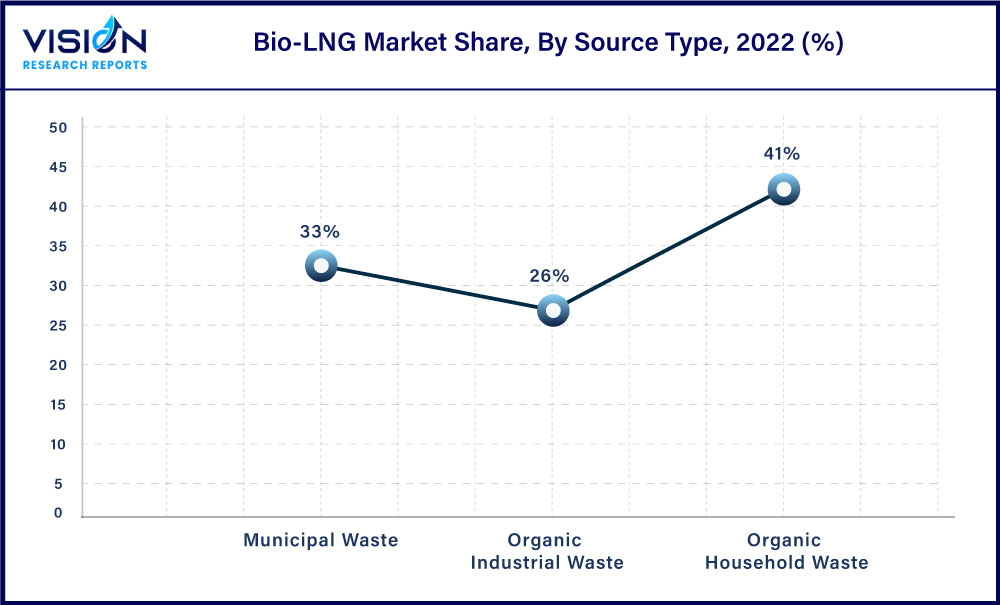
In terms of revenue, the organic household waste segment led the market for bio-LNG in 2022, accounting for a share of 41%. The growth of this segment can be attributed to incentives and tax rebates offered by governments of different countries to promote the adoption of renewable energy and the conversion of organic waste to energy.

The utilization of organic household waste to produce bio-LNG offers several advantages. It helps divert waste from landfills, reducing its environmental impact and emissions associated with its disposal. By converting this waste into renewable energy, bio-LNG production contributes to the circular economy and supports sustainable waste management practices. The versatility of organic industrial waste as a feedstock in the market for bio-LNG is remarkable. It encompasses various organic materials such as food waste, agricultural residues, and organic byproducts from manufacturing processes.
Municipal waste serves as a driving factor for the market growth of bio-LNG, due to several key factors. Firstly, stricter environmental regulations and targets for reducing greenhouse gas emissions have incentivized the use of sustainable waste management practices. Municipal waste, when converted into bio-LNG, offers a lower carbon footprint compared to traditional fossil fuels, making it an attractive feedstock. Secondly, financial incentives and subsidies promote the development of bio-LNG production facilities, as they offer an environment-friendly solution to waste management challenges.
Regional Insights
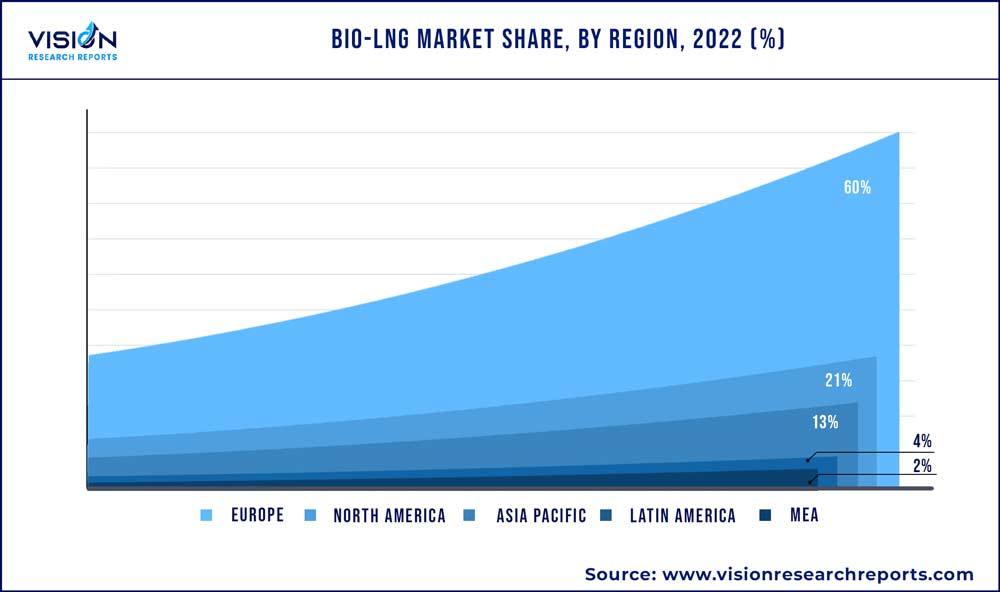
Europe accounted for the largest revenue share of 60% in 2022. Countries such as Germany, the UK, Spain, and France are expected to witness high growth rates in the industry, owing to the rising product demand from the transportation and power generation application sectors, boosting the market growth during the forecast period.

North America occupied a significant revenue share in 2022, with the U.S. being a major contributor to the regional market growth. The surge in the usage of alternative fuels for energy generation to reduce greenhouse gas emissions is expected to drive the growth of the North American market for bio-LNG in the coming years.
Asia Pacific is expected to witness a significant CAGR over the forecast period, owing to the presence of large emerging countries such as China and India. Bio-LNG has reduced the reliance of regional economies on other countries for energy generation, as bio-LNG can be produced domestically. This is expected to boost the market in similar regions without significant oil and gas reserves.
Bio-LNG Market Segmentations:
By Application
By Source Type
By Regional
Chapter 1. Introduction
1.1. Research Objective
1.2. Scope of the Study
1.3. Definition
Chapter 2. Research Methodology
2.1. Research Approach
2.2. Data Sources
2.3. Assumptions & Limitations
Chapter 3. Executive Summary
3.1. Market Snapshot
Chapter 4. Market Variables and Scope
4.1. Introduction
4.2. Market Classification and Scope
4.3. Industry Value Chain Analysis
4.3.1. Raw Material Procurement Analysis
4.3.2. Sales and Distribution Channel Analysis
4.3.3. Downstream Buyer Analysis
Chapter 5. COVID 19 Impact on Bio-LNG Market
5.1. COVID-19 Landscape: Bio-LNG Industry Impact
5.2. COVID 19 - Impact Assessment for the Industry
5.3. COVID 19 Impact: Global Major Government Policy
5.4. Market Trends and Opportunities in the COVID-19 Landscape
Chapter 6. Market Dynamics Analysis and Trends
6.1. Market Dynamics
6.1.1. Market Drivers
6.1.2. Market Restraints
6.1.3. Market Opportunities
6.2. Porter’s Five Forces Analysis
6.2.1. Bargaining power of suppliers
6.2.2. Bargaining power of buyers
6.2.3. Threat of substitute
6.2.4. Threat of new entrants
6.2.5. Degree of competition
Chapter 7. Competitive Landscape
7.1.1. Company Market Share/Positioning Analysis
7.1.2. Key Strategies Adopted by Players
7.1.3. Vendor Landscape
7.1.3.1. List of Suppliers
7.1.3.2. List of Buyers
Chapter 8. Global Bio-LNG Market, By Application
8.1. Bio-LNG Market, by Application, 2023-2032
8.1.1. Transportation Fuel
8.1.1.1. Market Revenue and Forecast (2020-2032)
8.1.2. Power Generation
8.1.2.1. Market Revenue and Forecast (2020-2032)
8.1.3. Others
8.1.3.1. Market Revenue and Forecast (2020-2032)
Chapter 9. Global Bio-LNG Market, By Source Type
9.1. Bio-LNG Market, by Source Type, 2023-2032
9.1.1. Organic household waste
9.1.1.1. Market Revenue and Forecast (2020-2032)
9.1.2. Organic industrial waste
9.1.2.1. Market Revenue and Forecast (2020-2032)
9.1.3. Municipal waste
9.1.3.1. Market Revenue and Forecast (2020-2032)
Chapter 10. Global Bio-LNG Market, Regional Estimates and Trend Forecast
10.1. North America
10.1.1. Market Revenue and Forecast, by Application (2020-2032)
10.1.2. Market Revenue and Forecast, by Source Type (2020-2032)
10.1.3. U.S.
10.1.3.1. Market Revenue and Forecast, by Application (2020-2032)
10.1.3.2. Market Revenue and Forecast, by Source Type (2020-2032)
10.1.4. Rest of North America
10.1.4.1. Market Revenue and Forecast, by Application (2020-2032)
10.1.4.2. Market Revenue and Forecast, by Source Type (2020-2032)
10.2. Europe
10.2.1. Market Revenue and Forecast, by Application (2020-2032)
10.2.2. Market Revenue and Forecast, by Source Type (2020-2032)
10.2.3. UK
10.2.3.1. Market Revenue and Forecast, by Application (2020-2032)
10.2.3.2. Market Revenue and Forecast, by Source Type (2020-2032)
10.2.4. Germany
10.2.4.1. Market Revenue and Forecast, by Application (2020-2032)
10.2.4.2. Market Revenue and Forecast, by Source Type (2020-2032)
10.2.5. France
10.2.5.1. Market Revenue and Forecast, by Application (2020-2032)
10.2.5.2. Market Revenue and Forecast, by Source Type (2020-2032)
10.2.6. Rest of Europe
10.2.6.1. Market Revenue and Forecast, by Application (2020-2032)
10.2.6.2. Market Revenue and Forecast, by Source Type (2020-2032)
10.3. APAC
10.3.1. Market Revenue and Forecast, by Application (2020-2032)
10.3.2. Market Revenue and Forecast, by Source Type (2020-2032)
10.3.3. India
10.3.3.1. Market Revenue and Forecast, by Application (2020-2032)
10.3.3.2. Market Revenue and Forecast, by Source Type (2020-2032)
10.3.4. China
10.3.4.1. Market Revenue and Forecast, by Application (2020-2032)
10.3.4.2. Market Revenue and Forecast, by Source Type (2020-2032)
10.3.5. Japan
10.3.5.1. Market Revenue and Forecast, by Application (2020-2032)
10.3.5.2. Market Revenue and Forecast, by Source Type (2020-2032)
10.3.6. Rest of APAC
10.3.6.1. Market Revenue and Forecast, by Application (2020-2032)
10.3.6.2. Market Revenue and Forecast, by Source Type (2020-2032)
10.4. MEA
10.4.1. Market Revenue and Forecast, by Application (2020-2032)
10.4.2. Market Revenue and Forecast, by Source Type (2020-2032)
10.4.3. GCC
10.4.3.1. Market Revenue and Forecast, by Application (2020-2032)
10.4.3.2. Market Revenue and Forecast, by Source Type (2020-2032)
10.4.4. North Africa
10.4.4.1. Market Revenue and Forecast, by Application (2020-2032)
10.4.4.2. Market Revenue and Forecast, by Source Type (2020-2032)
10.4.5. South Africa
10.4.5.1. Market Revenue and Forecast, by Application (2020-2032)
10.4.5.2. Market Revenue and Forecast, by Source Type (2020-2032)
10.4.6. Rest of MEA
10.4.6.1. Market Revenue and Forecast, by Application (2020-2032)
10.4.6.2. Market Revenue and Forecast, by Source Type (2020-2032)
10.5. Latin America
10.5.1. Market Revenue and Forecast, by Application (2020-2032)
10.5.2. Market Revenue and Forecast, by Source Type (2020-2032)
10.5.3. Brazil
10.5.3.1. Market Revenue and Forecast, by Application (2020-2032)
10.5.3.2. Market Revenue and Forecast, by Source Type (2020-2032)
10.5.4. Rest of LATAM
10.5.4.1. Market Revenue and Forecast, by Application (2020-2032)
10.5.4.2. Market Revenue and Forecast, by Source Type (2020-2032)
Chapter 11. Company Profiles
11.1. Linde plc
11.1.1. Company Overview
11.1.2. Product Offerings
11.1.3. Financial Performance
11.1.4. Recent Initiatives
11.2. Nordsol
11.2.1. Company Overview
11.2.2. Product Offerings
11.2.3. Financial Performance
11.2.4. Recent Initiatives
11.3. Flogas Britain Ltd.
11.3.1. Company Overview
11.3.2. Product Offerings
11.3.3. Financial Performance
11.3.4. Recent Initiatives
11.4. MEGA a.s.
11.4.1. Company Overview
11.4.2. Product Offerings
11.4.3. Financial Performance
11.4.4. LTE Scientific
11.5. AXEGAZ T&T
11.5.1. Company Overview
11.5.2. Product Offerings
11.5.3. Financial Performance
11.5.4. Recent Initiatives
11.6. TotalEnergies
11.6.1. Company Overview
11.6.2. Product Offerings
11.6.3. Financial Performance
11.6.4. Recent Initiatives
11.7. Titan LNG
11.7.1. Company Overview
11.7.2. Product Offerings
11.7.3. Financial Performance
11.7.4. Recent Initiatives
11.8. DBG Group B.V.
11.8.1. Company Overview
11.8.2. Product Offerings
11.8.3. Financial Performance
11.8.4. Recent Initiatives
11.9. BoxLNG Pvt. Ltd.
11.9.1. Company Overview
11.9.2. Product Offerings
11.9.3. Financial Performance
11.9.4. Recent Initiatives
11.10. Shell Plc
11.10.1. Company Overview
11.10.2. Product Offerings
11.10.3. Financial Performance
11.10.4. Recent Initiatives
Chapter 12. Research Methodology
12.1. Primary Research
12.2. Secondary Research
12.3. Assumptions
Chapter 13. Appendix
13.1. About Us
13.2. Glossary of Terms
 Cross-segment Market Size and Analysis for
Mentioned Segments
 Additional Company Profiles (Upto 5 With No Cost)
 Additional Countries (Apart From Mentioned Countries)
 Country/Region-specific Report
 Go To Market Strategy
 Region Specific Market Dynamics
 Region Level Market Share
 Import Export Analysis
 Production Analysis
 Others