Bio Plasticizers Market Size, Trends, Share, Growth | Report 2023-2032
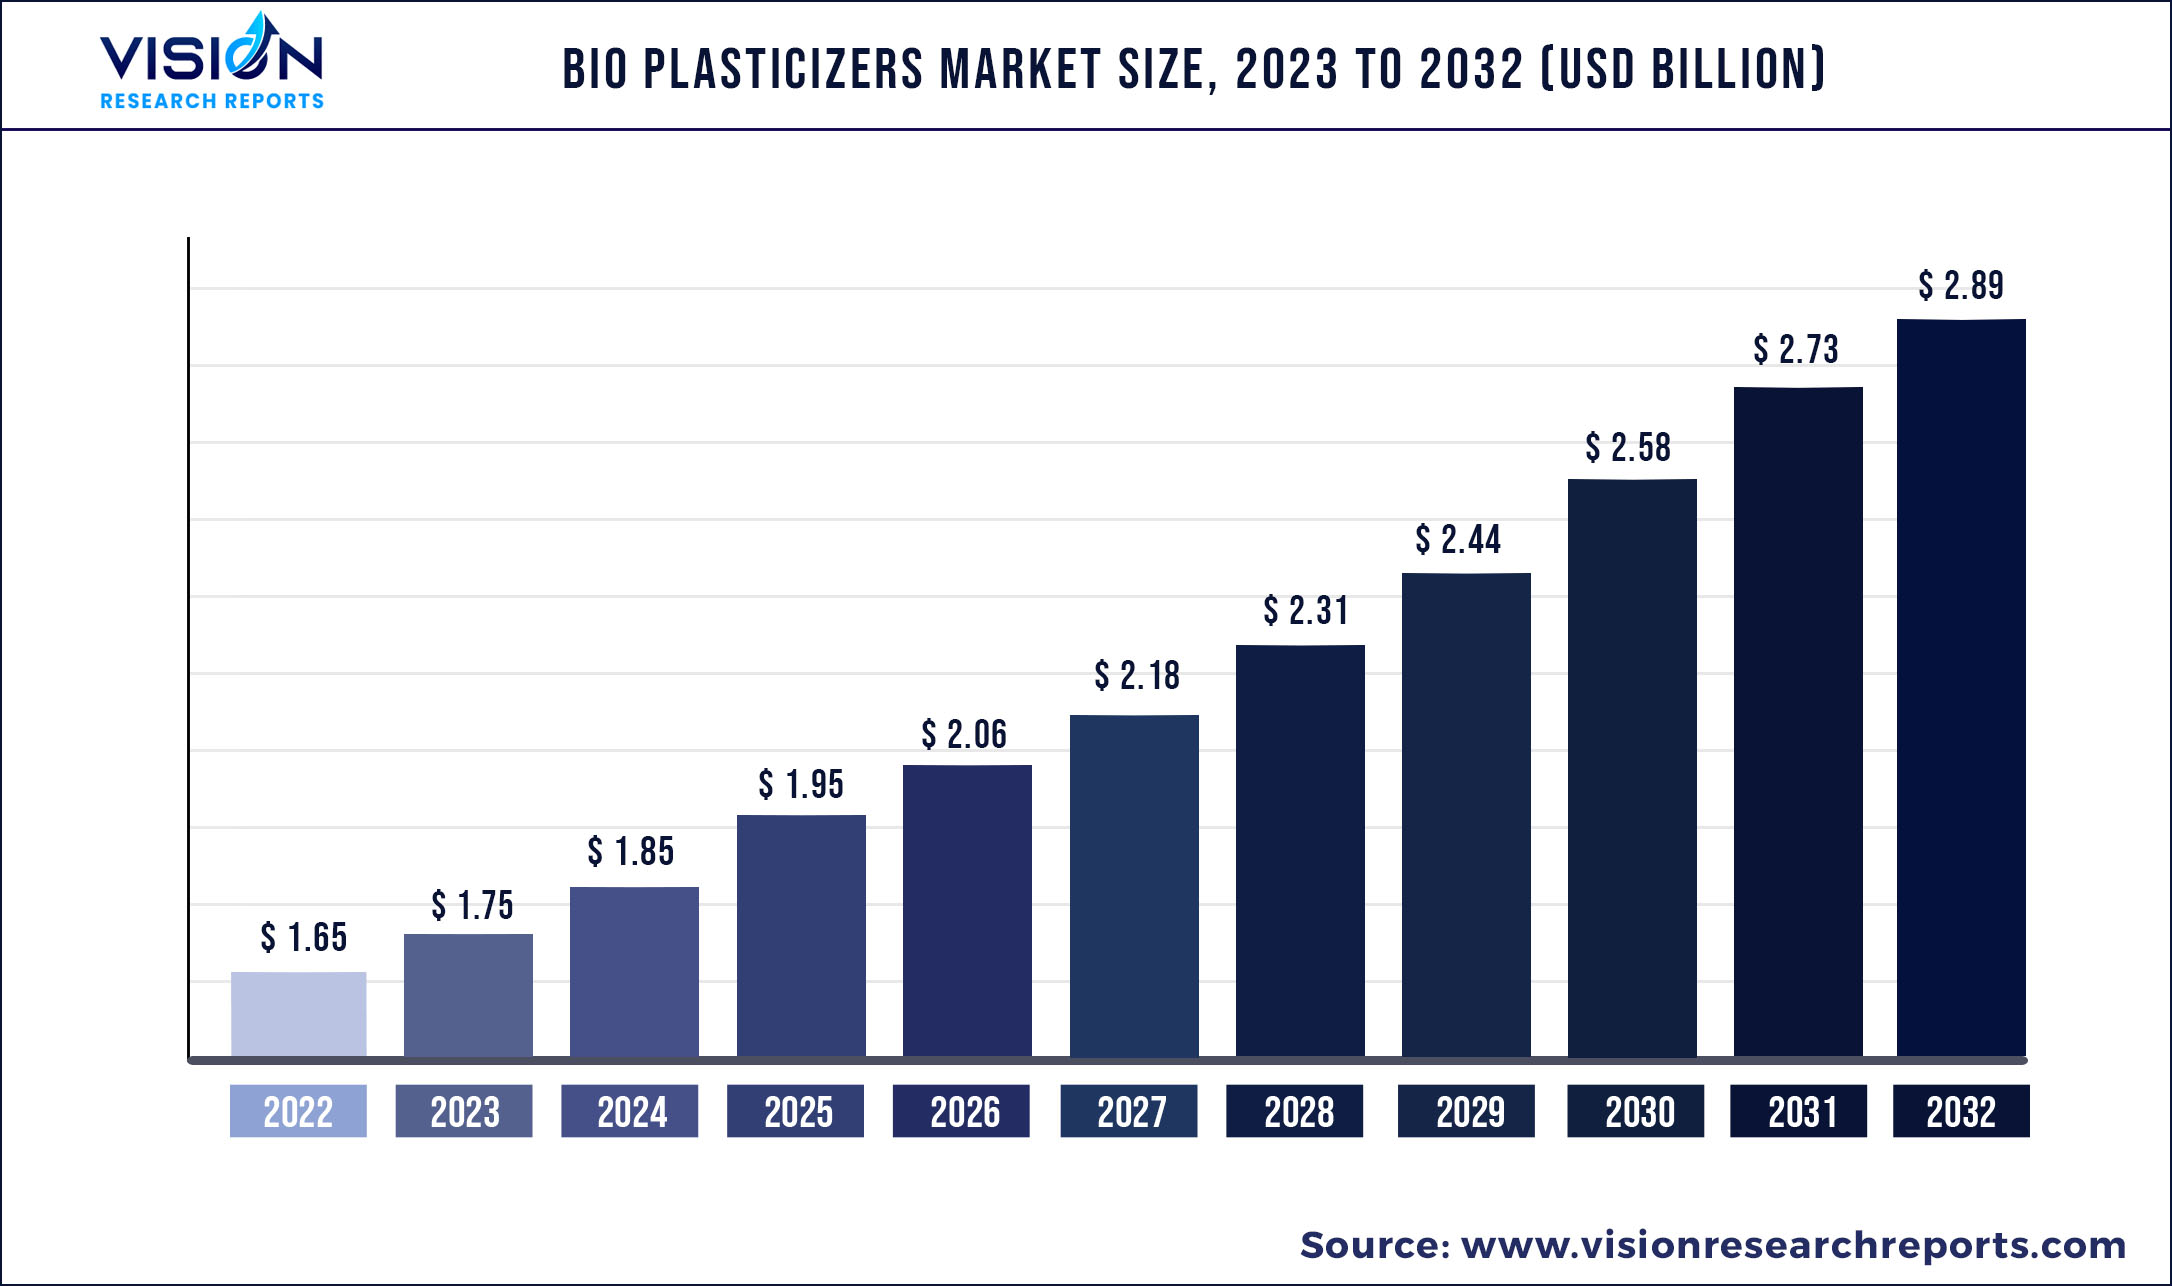
The global bio plasticizers market was surpassed at USD 1.65 billion in 2022 and is expected to hit around USD 2.89 billion by 2032, growing at a CAGR of 5.76% from 2023 to 2032.
Key Pointers
Report Scope of the Bio Plasticizers Market
| Report Coverage | Details |
| Market Size in 2022 | USD 1.65 billion |
| Revenue Forecast by 2032 | USD 2.89 billion |
| Growth rate from 2023 to 2032 | CAGR of 5.76% |
| Base Year | 2022 |
| Forecast Period | 2023 to 2032 |
| Regions Covered | North America, Europe, Asia Pacific, Latin America, Middle East & Africa |
| Companies Covered | The Dow Chemical Company; Evonik Industries AG; Solvay S.A.; PolyOne Corporation; BioAmber Inc.; Danisco US Inc.; Emery Oleochemicals LLC; Myriant Corporation; Lanxess AG; BASF SE |
Bio-plasticizers are additives with moderate side effects than synthetic chemicals, high safety, and biodegradability levels. The growing demand for bio-based materials in various end-use industries is anticipated to increase its production and consumption globally. These green polymers are widely utilized for the manufacturing of surface coatings for polymers, cables, and as an additive in plastic industries.
The supply of toxic phthalates including dibutyl phthalate (DBP), benzyl butyl phthalate (BBP), dioctyl phthalate (DOP), and diethyl phthalate (DEP) has led to the growing consumer awareness in emerging economies such as China and India, which is expected to propel the demand for bio-based plasticizers. It offers several benefits such as temperature as well as electrical functioning as compared to conventional synthetic polymers when used for manufacturing cables. These additives are derived from renewable feedstock such as succinic acid, castor oil, epoxidized soybean oil (ESBO), citrates, and others that help in reducing carbon footprints.
In addition, the ban on phthalate-based additives due to stringent regulatory policies in the major packaging segments of food and pharmaceutical industries has fueled the growth of environmental-friendly plastic resins. However, fluctuations in raw materials prices and high costs associated with bio plasticizers are anticipated to restrain the market growth during the forecast period.
The U.S. market is driven by increasing demand for bio-plasticizers used in producing a broad range of finished product packaging, textiles, building & construction, agriculture, automotive, and transport. High implementation of innovative and advanced extraction technologies and processes to support the rising demand from global clients are some of the significant factors influencing the regional industry growth in the coming years.
Bio-plasticizers are primarily manufactured from vegetable raw materials, and it is used as an alternative to traditional petroleum-based plasticizers. ESBO and succinic acid are the two most commonly utilized raw materials for the production of these additives. ESBO is one of the most preferred additives in food packaging particularly used in PVC gaskets. Myriant and BioAmber are major succinic acid manufacturers which are the key supply the raw materials to the product manufacturers through the North American region.
However, continuous changes in environmental guidelines, protocols, and blending policies are critical constraints faced by manufacturers, intensifying the threat to affect the global bio-plasticizers trade. Moreover, packaging companies are opting for low-cost, yet eco-friendly petrochemical alternatives without compromising on product performance are expected to trigger the market growth in the eight years.
Rising awareness about the adverse effects of using petroleum-based plastics has led to several key U.S. consumers of polymers to shift to green materials, resulting in a steady surge in the global industry. These resins are essential to alter a polymer’s characteristics to suit a particular application in which it is to be used.
Bio Plasticizers Market Segmentations:
| By Product | By Application |
|
Epoxidized Soybean Oil (ESBO) Castor Oil-Based Plasticizers Citrates Succinic Acid Others |
Packaging Materials Consumer Goods Automotive & transport Building & construction Textiles Agriculture & horticulture Others |
Chapter 1. Introduction
1.1. Research Objective
1.2. Scope of the Study
1.3. Definition
Chapter 2. Research Methodology
2.1. Research Approach
2.2. Data Sources
2.3. Assumptions & Limitations
Chapter 3. Executive Summary
3.1. Market Snapshot
Chapter 4. Market Variables and Scope
4.1. Introduction
4.2. Market Classification and Scope
4.3. Industry Value Chain Analysis
4.3.1. Raw Material Procurement Analysis
4.3.2. Sales and Distribution Channel Analysis
4.3.3. Downstream Buyer Analysis
Chapter 5. COVID 19 Impact on Bio Plasticizers Market
5.1. COVID-19 Landscape: Bio Plasticizers Industry Impact
5.2. COVID 19 - Impact Assessment for the Industry
5.3. COVID 19 Impact: Global Major Government Policy
5.4. Market Trends and Opportunities in the COVID-19 Landscape
Chapter 6. Market Dynamics Analysis and Trends
6.1. Market Dynamics
6.1.1. Market Drivers
6.1.2. Market Restraints
6.1.3. Market Opportunities
6.2. Porter’s Five Forces Analysis
6.2.1. Bargaining power of suppliers
6.2.2. Bargaining power of buyers
6.2.3. Threat of substitute
6.2.4. Threat of new entrants
6.2.5. Degree of competition
Chapter 7. Competitive Landscape
7.1.1. Company Market Share/Positioning Analysis
7.1.2. Key Strategies Adopted by Players
7.1.3. Vendor Landscape
7.1.3.1. List of Suppliers
7.1.3.2. List of Buyers
Chapter 8. Global Bio Plasticizers Market, By Product
8.1. Bio Plasticizers Market, by Product, 2023-2032
8.1.1. Epoxidized Soybean Oil (ESBO)
8.1.1.1. Market Revenue and Forecast (2020-2032)
8.1.2. Castor Oil-Based Plasticizers
8.1.2.1. Market Revenue and Forecast (2020-2032)
8.1.3. Citrates
8.1.3.1. Market Revenue and Forecast (2020-2032)
8.1.4. Succinic Acid
8.1.4.1. Market Revenue and Forecast (2020-2032)
8.1.5. Others
8.1.5.1. Market Revenue and Forecast (2020-2032)
Chapter 9. Global Bio Plasticizers Market, By Packaging Materials
9.1. Bio Plasticizers Market, by Application, 2023-2032
9.1.1. Packaging Materials
9.1.1.1. Market Revenue and Forecast (2020-2032)
9.1.2. Consumer Goods
9.1.2.1. Market Revenue and Forecast (2020-2032)
9.1.3. Automotive & transport
9.1.3.1. Market Revenue and Forecast (2020-2032)
9.1.4. Building & construction
9.1.4.1. Market Revenue and Forecast (2020-2032)
9.1.5. Textiles
9.1.5.1. Market Revenue and Forecast (2020-2032)
9.1.6. Agriculture & horticulture
9.1.6.1. Market Revenue and Forecast (2020-2032)
9.1.7. Others
9.1.7.1. Market Revenue and Forecast (2020-2032)
Chapter 10. Global Bio Plasticizers Market, Regional Estimates and Trend Forecast
10.1. North America
10.1.1. Market Revenue and Forecast, by Product (2020-2032)
10.1.2. Market Revenue and Forecast, by Application (2020-2032)
10.1.3. U.S.
10.1.3.1. Market Revenue and Forecast, by Product (2020-2032)
10.1.3.2. Market Revenue and Forecast, by Application (2020-2032)
10.1.4. Rest of North America
10.1.4.1. Market Revenue and Forecast, by Product (2020-2032)
10.1.4.2. Market Revenue and Forecast, by Application (2020-2032)
10.2. Europe
10.2.1. Market Revenue and Forecast, by Product (2020-2032)
10.2.2. Market Revenue and Forecast, by Application (2020-2032)
10.2.3. UK
10.2.3.1. Market Revenue and Forecast, by Product (2020-2032)
10.2.3.2. Market Revenue and Forecast, by Application (2020-2032)
10.2.4. Germany
10.2.4.1. Market Revenue and Forecast, by Product (2020-2032)
10.2.4.2. Market Revenue and Forecast, by Application (2020-2032)
10.2.5. France
10.2.5.1. Market Revenue and Forecast, by Product (2020-2032)
10.2.5.2. Market Revenue and Forecast, by Application (2020-2032)
10.2.6. Rest of Europe
10.2.6.1. Market Revenue and Forecast, by Product (2020-2032)
10.2.6.2. Market Revenue and Forecast, by Application (2020-2032)
10.3. APAC
10.3.1. Market Revenue and Forecast, by Product (2020-2032)
10.3.2. Market Revenue and Forecast, by Application (2020-2032)
10.3.3. India
10.3.3.1. Market Revenue and Forecast, by Product (2020-2032)
10.3.3.2. Market Revenue and Forecast, by Application (2020-2032)
10.3.4. China
10.3.4.1. Market Revenue and Forecast, by Product (2020-2032)
10.3.4.2. Market Revenue and Forecast, by Application (2020-2032)
10.3.5. Japan
10.3.5.1. Market Revenue and Forecast, by Product (2020-2032)
10.3.5.2. Market Revenue and Forecast, by Application (2020-2032)
10.3.6. Rest of APAC
10.3.6.1. Market Revenue and Forecast, by Product (2020-2032)
10.3.6.2. Market Revenue and Forecast, by Application (2020-2032)
10.4. MEA
10.4.1. Market Revenue and Forecast, by Product (2020-2032)
10.4.2. Market Revenue and Forecast, by Application (2020-2032)
10.4.3. GCC
10.4.3.1. Market Revenue and Forecast, by Product (2020-2032)
10.4.3.2. Market Revenue and Forecast, by Application (2020-2032)
10.4.4. North Africa
10.4.4.1. Market Revenue and Forecast, by Product (2020-2032)
10.4.4.2. Market Revenue and Forecast, by Application (2020-2032)
10.4.5. South Africa
10.4.5.1. Market Revenue and Forecast, by Product (2020-2032)
10.4.5.2. Market Revenue and Forecast, by Application (2020-2032)
10.4.6. Rest of MEA
10.4.6.1. Market Revenue and Forecast, by Product (2020-2032)
10.4.6.2. Market Revenue and Forecast, by Application (2020-2032)
10.5. Latin America
10.5.1. Market Revenue and Forecast, by Product (2020-2032)
10.5.2. Market Revenue and Forecast, by Application (2020-2032)
10.5.3. Brazil
10.5.3.1. Market Revenue and Forecast, by Product (2020-2032)
10.5.3.2. Market Revenue and Forecast, by Application (2020-2032)
10.5.4. Rest of LATAM
10.5.4.1. Market Revenue and Forecast, by Product (2020-2032)
10.5.4.2. Market Revenue and Forecast, by Application (2020-2032)
Chapter 11. Company Profiles
11.1. The Dow Chemical Company
11.1.1. Company Overview
11.1.2. Product Offerings
11.1.3. Financial Performance
11.1.4. Recent Initiatives
11.2. Evonik Industries AG
11.2.1. Company Overview
11.2.2. Product Offerings
11.2.3. Financial Performance
11.2.4. Recent Initiatives
11.3. Solvay S.A.
11.3.1. Company Overview
11.3.2. Product Offerings
11.3.3. Financial Performance
11.3.4. Recent Initiatives
11.4. PolyOne Corporation
11.4.1. Company Overview
11.4.2. Product Offerings
11.4.3. Financial Performance
11.4.4. LTE Scientific
11.5. BioAmber Inc.
11.5.1. Company Overview
11.5.2. Product Offerings
11.5.3. Financial Performance
11.5.4. Recent Initiatives
11.6. Danisco US Inc.
11.6.1. Company Overview
11.6.2. Product Offerings
11.6.3. Financial Performance
11.6.4. Recent Initiatives
11.7. Emery Oleochemicals LLC
11.7.1. Company Overview
11.7.2. Product Offerings
11.7.3. Financial Performance
11.7.4. Recent Initiatives
11.8. Myriant Corporation
11.8.1. Company Overview
11.8.2. Product Offerings
11.8.3. Financial Performance
11.8.4. Recent Initiatives
11.9. Lanxess AG
11.9.1. Company Overview
11.9.2. Product Offerings
11.9.3. Financial Performance
11.9.4. Recent Initiatives
11.10. BASF SE
11.10.1. Company Overview
11.10.2. Product Offerings
11.10.3. Financial Performance
11.10.4. Recent Initiatives
Chapter 12. Research Methodology
12.1. Primary Research
12.2. Secondary Research
12.3. Assumptions
Chapter 13. Appendix
13.1. About Us
13.2. Glossary of Terms
 Cross-segment Market Size and Analysis for
Mentioned Segments
Additional Company Profiles (Upto 5 With No Cost)
Additional Countries (Apart From Mentioned Countries)
Country/Region-specific Report
Go To Market Strategy
Region Specific Market DynamicsRegion Level Market Share Import Export AnalysisProduction AnalysisOthers
Cross-segment Market Size and Analysis for
Mentioned Segments
Additional Company Profiles (Upto 5 With No Cost)
Additional Countries (Apart From Mentioned Countries)
Country/Region-specific Report
Go To Market Strategy
Region Specific Market DynamicsRegion Level Market Share Import Export AnalysisProduction AnalysisOthers