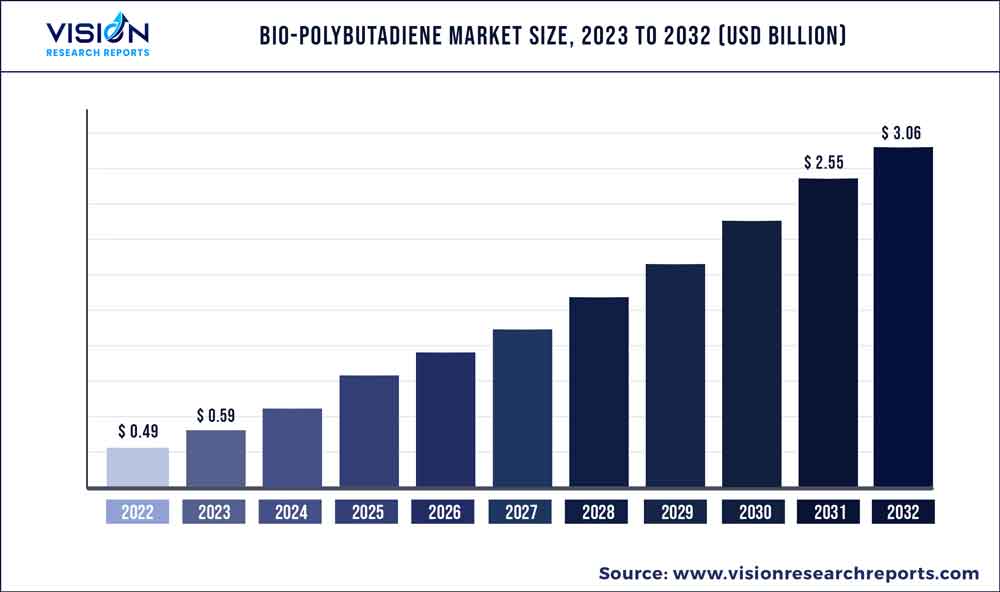
The global bio-polybutadiene market size was estimated at around USD 0.49 billion in 2022 and it is projected to hit around USD 3.06 billion by 2032, growing at a CAGR of 20.12% from 2023 to 2032. The bio-polybutadiene market in the United States was accounted for USD 107.3 million in 2022.

Key Pointers
Report Scope of the Bio-polybutadiene Market
| Report Coverage | Details |
| Revenue Share of Asia Pacific in 2022 | 47% |
| Revenue Forecast by 2032 | USD 3.06 billion |
| Growth Rate from 2023 to 2032 | CAGR of 20.12% |
| Base Year | 2022 |
| Forecast Period | 2023 to 2032 |
| Market Analysis (Terms Used) | Value (US$ Million/Billion) or (Volume/Units) |
| Companies Covered | Lanxess AG; Kuraray Co., Ltd.; Kraton Corporation; Sibur; JSR Corporation; Zeon Corporation; Sinopec; LG Chem; Versalis S.p.A; Goodyear Tire & Rubber Company; Trinseo LLC; Jilin Chemical Industry Co.; Ltd.; Asahi Kasei Corporation; Evonik Industries AG; ExxonMobil Chemical Company |
The demand for bio-polybutadiene is driven by a growing global focus on sustainability and the need to reduce reliance on fossil fuels. Additionally, increasing regulations on emissions and waste management in many countries are also driving the demand for sustainable materials. The market for bio-polybutadiene is still in its early stages of development, and the availability and cost of biomass sources can be a limiting factor for large-scale production. However, advances in biotechnology and process engineering are making it more feasible to produce biobased polybutadiene on a larger scale, which is expected to drive market growth in the coming years.
The United States is one of the largest consumers of bio-polybutadiene in the world, and the market is expected to grow at a steady pace over the forecast period. The increasing demand for sustainable and eco-friendly products in various industries is driving the growth of the market in the U.S. The automotive industry is one of the major end-users of bio-polybutadiene in the U.S., particularly in the production of tires. The construction industry is also a significant consumer of biobased polybutadiene, as it is used in the production of sealants, adhesives, and other construction materials. Additionally, the biomedical industry is a growing market for bio-polybutadiene due to its biocompatibility and other desirable properties.
The country has implemented several environmental regulations, including the Clean Air Act and Clean Water Act, which are driving demand for sustainable materials. Moreover, some of the key players operating in the U.S. market include Kraton Corporation, Trinseo LLC, ExxonMobil Chemical Company, and Dow Chemical Company, among others. These companies are focusing on expanding their production capacity and developing new products to meet the growing demand for Bio-Polybutadiene in the U.S. market.
The U.S. bio-polybutadiene market is also influenced by various government regulations and policies aimed at promoting sustainability and reducing carbon emissions. The increasing awareness and focus on sustainability among consumers and businesses in the U.S. are expected to further drive the growth of the market for market in the country.
Product Insights
High cis polybutadiene product segment led the market and accounted for more than 64% share of the global revenue in 2022. The products in the market comprise High cis polybutadiene, high vinyl polybutadiene, low cis polybutadiene, and high trans polybutadiene. The increase in demand for high cis polybutadiene derivatives can be attributed to the elevated growth resistance and durability exhibited by these products. Demand for high cis polybutadiene derivatives is expected to grow rapidly due to increasing tire manufacturing applications.
The low cis polybutadiene is expected to grow at a significant growth rate from 2023 to 2032 on account of growing applications in polymer modification and industrial rubber manufacturing. The low cis polybutadiene comprises 36% cis, 54% trans and 10% vinyl contents. Low cis polybutadiene is used in tire manufacturing and is blended with other tire polymers. It can also be used as an additive in plastics due to its low gel content. The low cis polybutadiene also finds application in the manufacture of high impact polystyrene and polystyrene ABS grades.
The high trans polybutadiene derivative is expected to grow at a CAGR of 18.92% from 2023 to 2032. It was majorly used in the manufacture of golf balls, but manufacturers are now looking at other application to increase the commercial importance of the product. The low commercialization of high trans butadiene can be attributed to the high crystalline nature of this product. However, blends of this product are used with neoprene, styrene butadiene rubber, and natural rubber for tire building. The presence of rubber manufacturers in the Asia Pacific region is driving the demand for high trans polybutadiene.
Application Insights
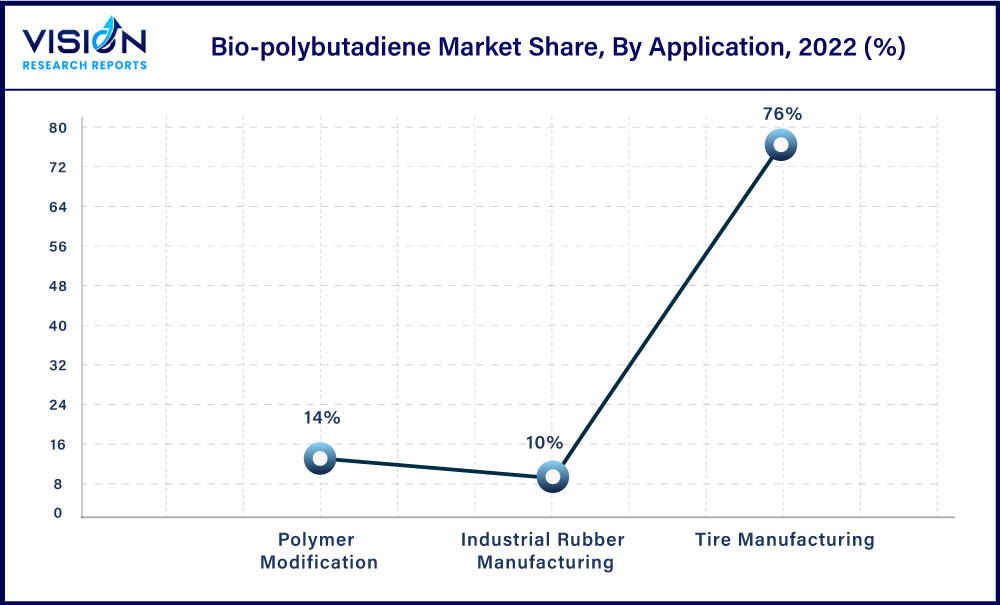
Tire manufacturing application segment led the market and accounted for more than 76% share of the global revenue in 2022 due to its high resilience and excellent wear resistance properties. The use of bio-polybutadiene in tire manufacturing offers several advantages over traditional synthetic rubber. Bio-polybutadiene is a type of synthetic rubber that is derived from renewable resources, such as plant-based materials, which makes it more environmentally friendly. It also has unique properties that can improve the performance of tires.

One of the main advantages of using bio-polybutadiene in tire manufacturing is its ability to improve the wet traction and rolling resistance of tires. Bio-polybutadiene has a higher glass transition temperature than traditional synthetic rubber, which means that it is more resistant to deformation at high temperatures. This results in tires that have a better grip on wet roads and a lower rolling resistance, which can lead to improved fuel efficiency. In addition to these benefits, the use of bio-polybutadiene in tire manufacturing can also help to reduce the carbon footprint of the industry. By using renewable resources to produce synthetic rubber, tire manufacturers can reduce their reliance on fossil fuels and reduce their greenhouse gas emissions.
However, there are also some challenges associated with the use of bio-polybutadiene in tire manufacturing. For example, the cost of producing bio-polybutadiene is currently higher than traditional synthetic rubber, which can make it less attractive to some manufacturers. There may also be issues with the availability of the raw materials needed to produce bio-polybutadiene at scale. Despite these challenges, the use of bio-polybutadiene in tire manufacturing is likely to continue to grow in the coming years as tire manufacturers look for ways to improve the performance of their products and reduce their environmental impact. As such, we can expect to see more research and development in this area, as well as increased investment in the production of bio-polybutadiene.
Regional Insights
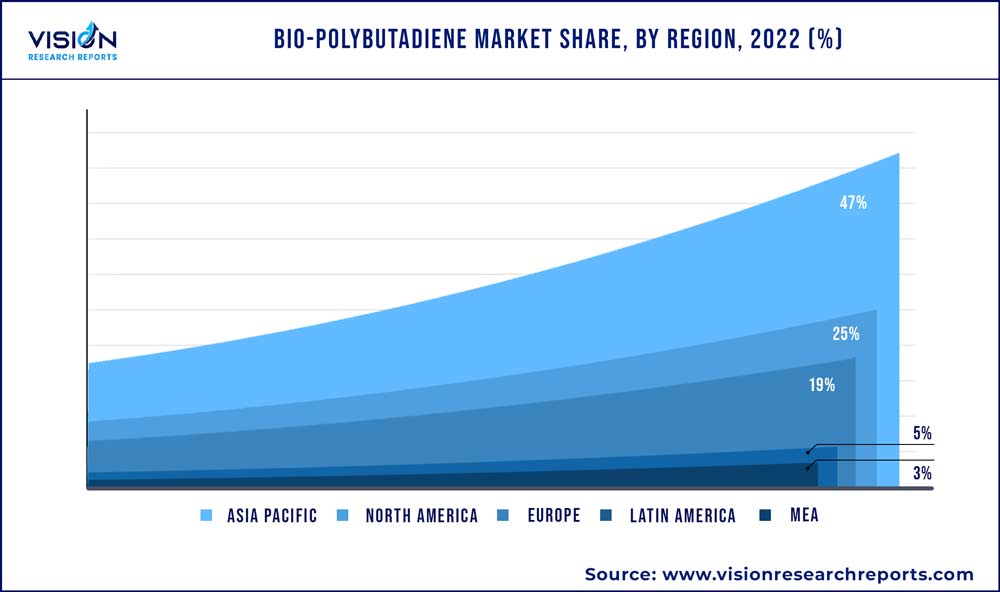
Asia Pacific dominated the market and accounted for more than 47% share of the global revenue in 2022. This region is still in its early stages, with only a few key players in the market. However, there is growing interest in bio-based materials in the region, driven by the increasing demand for sustainable products and the government's focus on reducing carbon emissions. The market is also driven by the growing automotive industry in countries of China, India and Japan and presence of large-scale automotive manufacturers such as Toyota, SAIC, and KIA Motors is expected to boost the demand for bio-based polybutadiene in the region.

The demand in this region is expected to grow at a significant rate due to high growth in the end application industries. The capacity additions in U.S. and Canada are expected to augment the demand for polybutadiene in this region over the forecast period. North America has been one of the key markets for bio-polybutadiene due to the growing demand for sustainable products. The region has seen several initiatives to promote the use of renewable resources in the production of various products, including rubber.
Companies in North America have also been investing in research and development of bio-polybutadiene to improve its properties and expand its applications. The automotive industry, in particular, is a major consumer of bio-polybutadiene in North America. The use of bio-polybutadiene in tires and other automotive components offers several benefits, such as improved fuel efficiency, reduced greenhouse gas emissions, and increased sustainability. In addition, the increasing popularity of electric vehicles is also driving the demand for bio-polybutadiene as it can be used in the production of batteries and other components.
Other industries, such as packaging and construction are also adopting bio-polybutadiene as a sustainable alternative to traditional materials. For example, bio-polybutadiene can be used in the production of biodegradable packaging materials, reducing the amount of waste generated by these industries. Similarly, in the construction industry, bio-polybutadiene can be used as a sustainable substitute for traditional materials in products such as sealants and adhesives, which will boost the demand for bio-polybutadiene in the region.
Bio-polybutadiene Market Segmentations:
By Product
By Application
By Regional
Chapter 1. Introduction
1.1. Research Objective
1.2. Scope of the Study
1.3. Definition
Chapter 2. Research Methodology
2.1. Research Approach
2.2. Data Sources
2.3. Assumptions & Limitations
Chapter 3. Executive Summary
3.1. Market Snapshot
Chapter 4. Market Variables and Scope
4.1. Introduction
4.2. Market Classification and Scope
4.3. Industry Value Chain Analysis
4.3.1. Raw Material Procurement Analysis
4.3.2. Sales and Distribution Channel Analysis
4.3.3. Downstream Buyer Analysis
Chapter 5. COVID 19 Impact on Bio-polybutadiene Market
5.1. COVID-19 Landscape: Bio-polybutadiene Industry Impact
5.2. COVID 19 - Impact Assessment for the Industry
5.3. COVID 19 Impact: Global Major Government Policy
5.4. Market Trends and Opportunities in the COVID-19 Landscape
Chapter 6. Market Dynamics Analysis and Trends
6.1. Market Dynamics
6.1.1. Market Drivers
6.1.2. Market Restraints
6.1.3. Market Opportunities
6.2. Porter’s Five Forces Analysis
6.2.1. Bargaining power of suppliers
6.2.2. Bargaining power of buyers
6.2.3. Threat of substitute
6.2.4. Threat of new entrants
6.2.5. Degree of competition
Chapter 7. Competitive Landscape
7.1.1. Company Market Share/Positioning Analysis
7.1.2. Key Strategies Adopted by Players
7.1.3. Vendor Landscape
7.1.3.1. List of Suppliers
7.1.3.2. List of Buyers
Chapter 8. Global Bio-polybutadiene Market, By Product
8.1. Bio-polybutadiene Market, by Product, 2023-2032
8.1.1. High cis Polybutadiene
8.1.1.1. Market Revenue and Forecast (2020-2032)
8.1.2. Low cis Polybutadiene
8.1.2.1. Market Revenue and Forecast (2020-2032)
8.1.3. High Vinyl Polybutadiene
8.1.3.1. Market Revenue and Forecast (2020-2032)
8.1.4. High Trans Polybutadiene
8.1.4.1. Market Revenue and Forecast (2020-2032)
Chapter 9. Global Bio-polybutadiene Market, By Application
9.1. Bio-polybutadiene Market, by Application, 2023-2032
9.1.1. Tire Manufacturing
9.1.1.1. Market Revenue and Forecast (2020-2032)
9.1.2. Polymer Modification
9.1.2.1. Market Revenue and Forecast (2020-2032)
9.1.3. Industrial Rubber Manufacturing
9.1.3.1. Market Revenue and Forecast (2020-2032)
Chapter 10. Global Bio-polybutadiene Market, Regional Estimates and Trend Forecast
10.1. North America
10.1.1. Market Revenue and Forecast, by Product (2020-2032)
10.1.2. Market Revenue and Forecast, by Application (2020-2032)
10.1.3. U.S.
10.1.3.1. Market Revenue and Forecast, by Product (2020-2032)
10.1.3.2. Market Revenue and Forecast, by Application (2020-2032)
10.1.4. Rest of North America
10.1.4.1. Market Revenue and Forecast, by Product (2020-2032)
10.1.4.2. Market Revenue and Forecast, by Application (2020-2032)
10.2. Europe
10.2.1. Market Revenue and Forecast, by Product (2020-2032)
10.2.2. Market Revenue and Forecast, by Application (2020-2032)
10.2.3. UK
10.2.3.1. Market Revenue and Forecast, by Product (2020-2032)
10.2.3.2. Market Revenue and Forecast, by Application (2020-2032)
10.2.4. Germany
10.2.4.1. Market Revenue and Forecast, by Product (2020-2032)
10.2.4.2. Market Revenue and Forecast, by Application (2020-2032)
10.2.5. France
10.2.5.1. Market Revenue and Forecast, by Product (2020-2032)
10.2.5.2. Market Revenue and Forecast, by Application (2020-2032)
10.2.6. Rest of Europe
10.2.6.1. Market Revenue and Forecast, by Product (2020-2032)
10.2.6.2. Market Revenue and Forecast, by Application (2020-2032)
10.3. APAC
10.3.1. Market Revenue and Forecast, by Product (2020-2032)
10.3.2. Market Revenue and Forecast, by Application (2020-2032)
10.3.3. India
10.3.3.1. Market Revenue and Forecast, by Product (2020-2032)
10.3.3.2. Market Revenue and Forecast, by Application (2020-2032)
10.3.4. China
10.3.4.1. Market Revenue and Forecast, by Product (2020-2032)
10.3.4.2. Market Revenue and Forecast, by Application (2020-2032)
10.3.5. Japan
10.3.5.1. Market Revenue and Forecast, by Product (2020-2032)
10.3.5.2. Market Revenue and Forecast, by Application (2020-2032)
10.3.6. Rest of APAC
10.3.6.1. Market Revenue and Forecast, by Product (2020-2032)
10.3.6.2. Market Revenue and Forecast, by Application (2020-2032)
10.4. MEA
10.4.1. Market Revenue and Forecast, by Product (2020-2032)
10.4.2. Market Revenue and Forecast, by Application (2020-2032)
10.4.3. GCC
10.4.3.1. Market Revenue and Forecast, by Product (2020-2032)
10.4.3.2. Market Revenue and Forecast, by Application (2020-2032)
10.4.4. North Africa
10.4.4.1. Market Revenue and Forecast, by Product (2020-2032)
10.4.4.2. Market Revenue and Forecast, by Application (2020-2032)
10.4.5. South Africa
10.4.5.1. Market Revenue and Forecast, by Product (2020-2032)
10.4.5.2. Market Revenue and Forecast, by Application (2020-2032)
10.4.6. Rest of MEA
10.4.6.1. Market Revenue and Forecast, by Product (2020-2032)
10.4.6.2. Market Revenue and Forecast, by Application (2020-2032)
10.5. Latin America
10.5.1. Market Revenue and Forecast, by Product (2020-2032)
10.5.2. Market Revenue and Forecast, by Application (2020-2032)
10.5.3. Brazil
10.5.3.1. Market Revenue and Forecast, by Product (2020-2032)
10.5.3.2. Market Revenue and Forecast, by Application (2020-2032)
10.5.4. Rest of LATAM
10.5.4.1. Market Revenue and Forecast, by Product (2020-2032)
10.5.4.2. Market Revenue and Forecast, by Application (2020-2032)
Chapter 11. Company Profiles
11.1. Lanxess AG
11.1.1. Company Overview
11.1.2. Product Offerings
11.1.3. Financial Performance
11.1.4. Recent Initiatives
11.2. Kuraray Co., Ltd.
11.2.1. Company Overview
11.2.2. Product Offerings
11.2.3. Financial Performance
11.2.4. Recent Initiatives
11.3. Kraton Corporation
11.3.1. Company Overview
11.3.2. Product Offerings
11.3.3. Financial Performance
11.3.4. Recent Initiatives
11.4. Sibur
11.4.1. Company Overview
11.4.2. Product Offerings
11.4.3. Financial Performance
11.4.4. LTE Scientific
11.5. JSR Corporation
11.5.1. Company Overview
11.5.2. Product Offerings
11.5.3. Financial Performance
11.5.4. Recent Initiatives
11.6. Zeon Corporation
11.6.1. Company Overview
11.6.2. Product Offerings
11.6.3. Financial Performance
11.6.4. Recent Initiatives
11.7. Sinopec
11.7.1. Company Overview
11.7.2. Product Offerings
11.7.3. Financial Performance
11.7.4. Recent Initiatives
11.8. LG Chem
11.8.1. Company Overview
11.8.2. Product Offerings
11.8.3. Financial Performance
11.8.4. Recent Initiatives
11.9. Versalis S.p.A
11.9.1. Company Overview
11.9.2. Product Offerings
11.9.3. Financial Performance
11.9.4. Recent Initiatives
11.10. Goodyear Tire & Rubber Company
11.10.1. Company Overview
11.10.2. Product Offerings
11.10.3. Financial Performance
11.10.4. Recent Initiatives
Chapter 12. Research Methodology
12.1. Primary Research
12.2. Secondary Research
12.3. Assumptions
Chapter 13. Appendix
13.1. About Us
13.2. Glossary of Terms
 Cross-segment Market Size and Analysis for
Mentioned Segments
 Additional Company Profiles (Upto 5 With No Cost)
 Additional Countries (Apart From Mentioned Countries)
 Country/Region-specific Report
 Go To Market Strategy
 Region Specific Market Dynamics
 Region Level Market Share
 Import Export Analysis
 Production Analysis
 Others