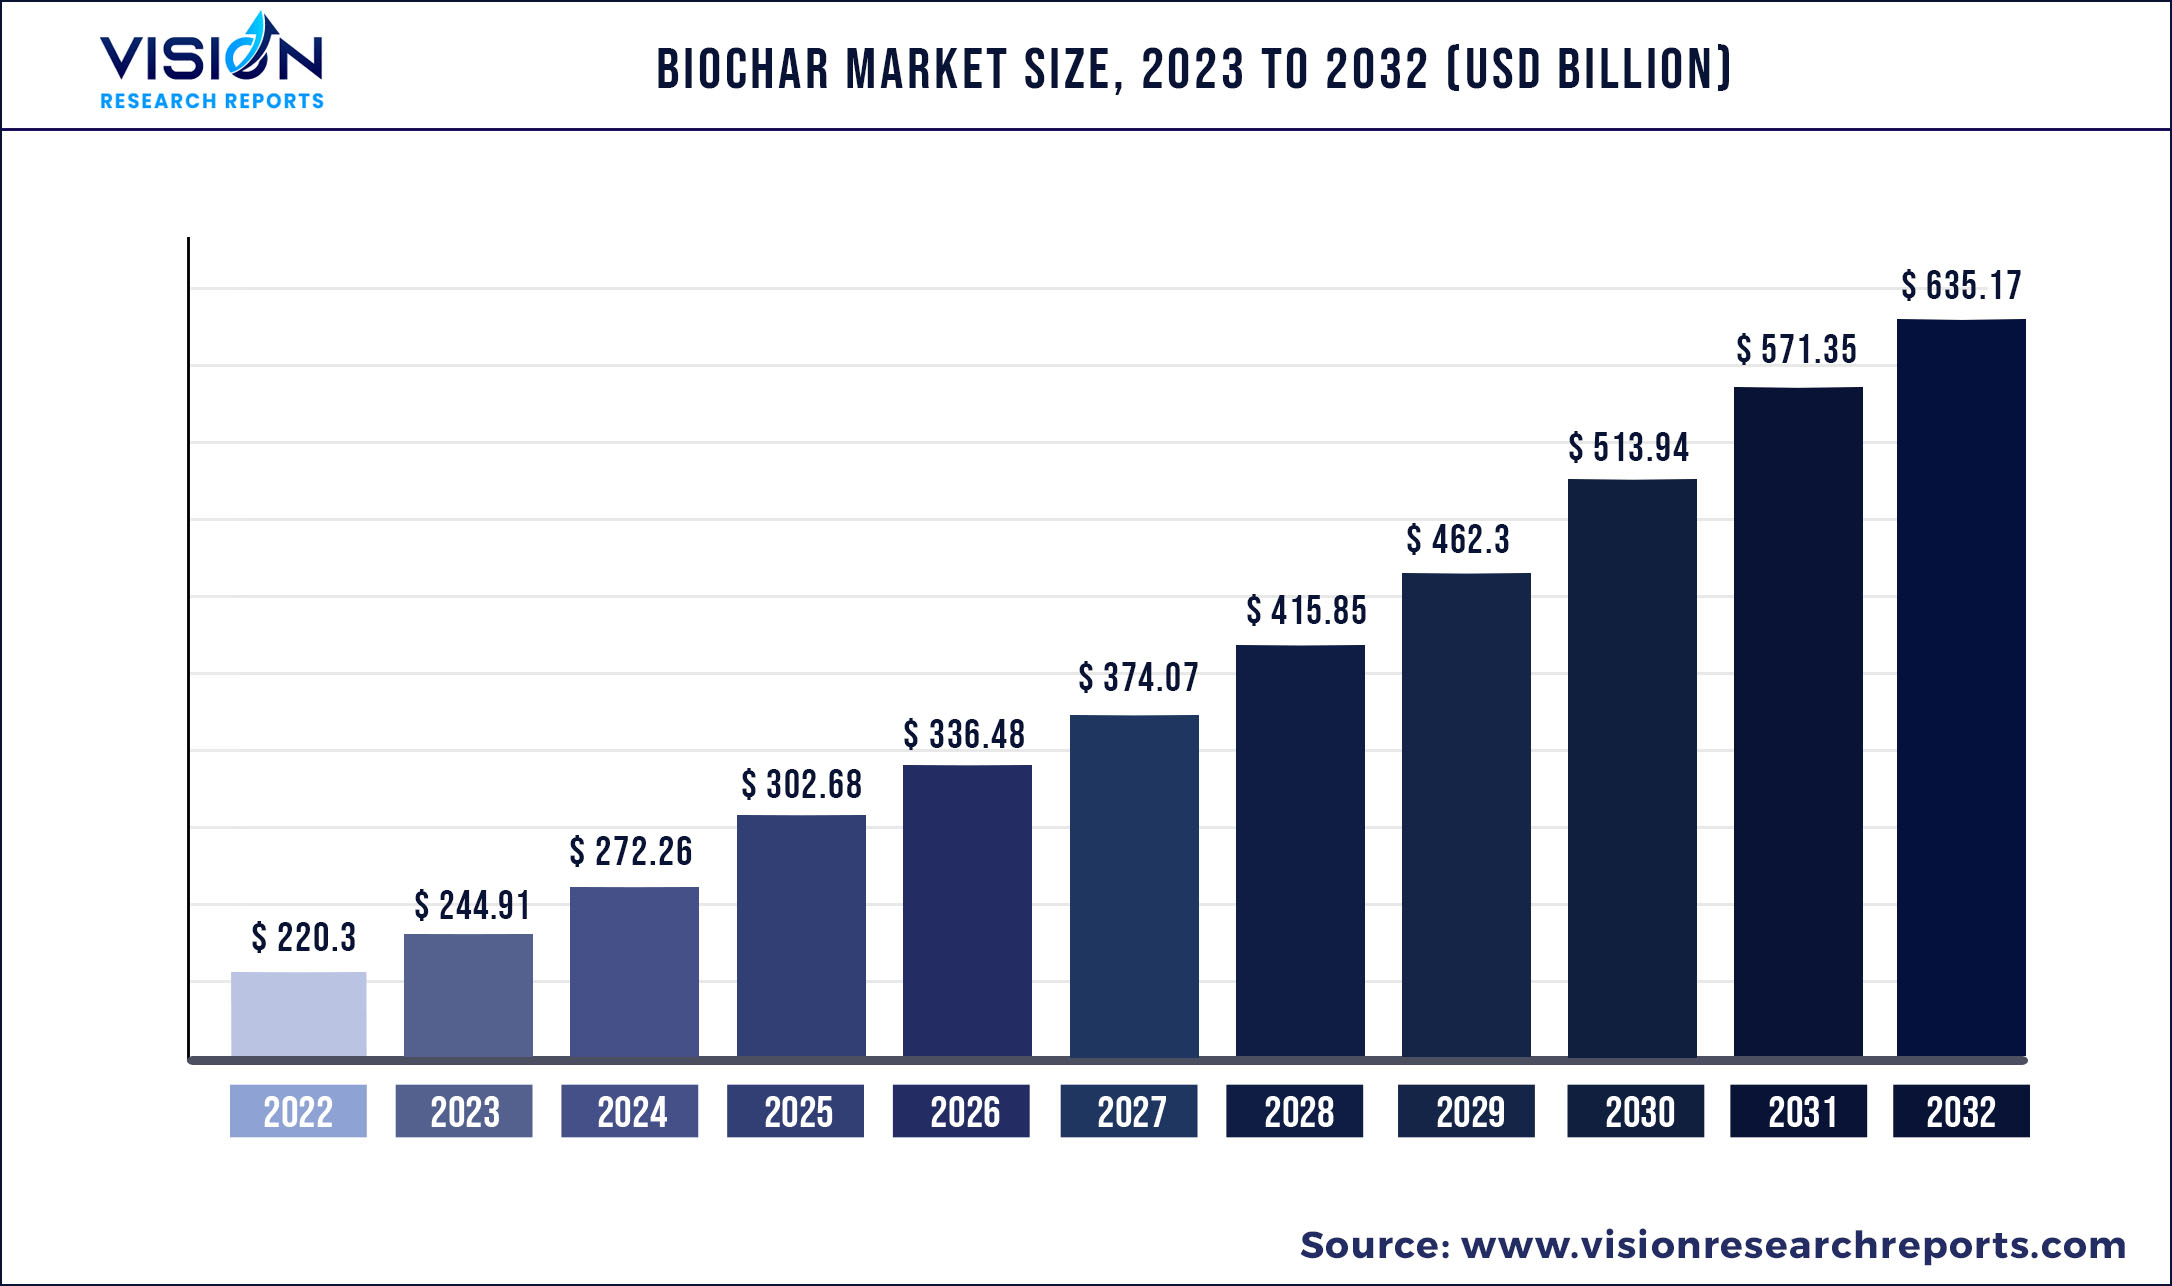
The global biochar market was estimated at USD 220.3 billion in 2022 and it is expected to surpass around USD 635.17 billion by 2032, poised to grow at a CAGR of 11.17% from 2023 to 2032.
Key Pointers
Report Scope of the Biochar Market
| Report Coverage | Details |
| Market Size in 2022 | USD 220.3 billion |
| Revenue Forecast by 2032 | USD 635.17 billion |
| Growth rate from 2023 to 2032 | CAGR of 11.17% |
| Base Year | 2022 |
| Forecast Period | 2023 to 2032 |
| Regions Covered | North America, Europe, Asia Pacific, Latin America, Middle East & Africa |
| Companies Covered | Airex Energy Inc.; Biochar Supreme; Farm2Energy Pvt Ltd; Pacific Biochar Corporation; ProActive Agriculture; Phoenix Energy |
Biochar is a fine-grained material derived from organic waste, and its production is an excellent technique to sequester carbon (i.e., long-term carbon capture). In this regard, its ability to sequester carbon is an excellent solution to address the problem of greenhouse gases. Another advantage of biochar is that it aids in soil improvement. As a result, several studies are carried out to determine its possible application. Slow pyrolysis, fast pyrolysis, gasification, intermediate pyrolysis, hydrothermal carbonization, and microwave pyrolysis are all used to make it.
The biochar market report from Triton gives a detailed analysis of the market definition and key insights. Along with this, the market attractiveness matrix, vendor scorecard, regulatory framework, and Porter’s five forces analysis are also studied for the biochar market.
Various benefits provided by biochar are mainly driving the sales in the market. It can store about 50% of the carbon from the feedstock. It can help retain nutrients such as phosphorus and nitrogen in the soil. In addition, it is found to decrease the leaching of soil nutrients into the groundwater, thereby reducing the nutrient outgo and increasing crop yields. Many of the organic pollutants are found to be captured by biochar. Soil texture, particle size distribution, porosity, density, and structure are improved by applying biochar. An increase in porosity and surface area increases the number of microorganisms due to space availability.
The growth in the adoption of organic farming is one of the key opportunities for the biochar market. Organic farming is expected to gain heavily from biochar use as it helps improve productivity by providing essential nutrients for plant growth. Biochar is an excellent carbon carrier, which enhances plant growth. The organic food sector has witnessed significant growth over the past few years, owing to rising health concerns among consumers. Since biochar is an organic fertilizer, its nutrient-enriching capacity is expected to benefit from the rising trends in organic farming worldwide.
However, the high cost, lack of demonstration projects, and the possibility of contamination from feedstock are the key restraints curbing the market’s global growth. Feedstock for biochar is waste from the agriculture, forestry, and municipal sectors. Therefore, the chances of toxic contamination are high, leading vendors to take the utmost care for selecting biochar feedstock and production operations to mitigate the risks to the environment and human health.
COVID-19 brought the entire world to a halt, which results in negative impact on agricultural industry as well as on global biochar market. Despite the fact that the biochar market has been negatively impacted by the COVID-19, the farmers are being encouraged by the stakeholders to install reactor on their farm to speed up the process of turning stubble into biomass. The UN's Intergovernmental Panel on climate change has been identified biochar as a feasible method for reducing pollution.
Biochar Market Segmentations:
| By Technology | By Feedstock | By Application |
|
Pyrolysis Gasification Others |
Woody Biomass Agricultural Waste Animal Manure Others |
Agriculture Forestry Electricity Generation Others |
Chapter 1. Introduction
1.1. Research Objective
1.2. Scope of the Study
1.3. Definition
Chapter 2. Research Methodology
2.1. Research Approach
2.2. Data Sources
2.3. Assumptions & Limitations
Chapter 3. Executive Summary
3.1. Market Snapshot
Chapter 4. Market Variables and Scope
4.1. Introduction
4.2. Market Classification and Scope
4.3. Industry Value Chain Analysis
4.3.1. Raw Material Procurement Analysis
4.3.2. Sales and Distribution Technology Analysis
4.3.3. Downstream Buyer Analysis
Chapter 5. COVID 19 Impact on Biochar Market
5.1. COVID-19 Landscape: Biochar Industry Impact
5.2. COVID 19 - Impact Assessment for the Industry
5.3. COVID 19 Impact: Global Major Government Policy
5.4. Market Trends and Opportunities in the COVID-19 Landscape
Chapter 6. Market Dynamics Analysis and Trends
6.1. Market Dynamics
6.1.1. Market Drivers
6.1.2. Market Restraints
6.1.3. Market Opportunities
6.2. Porter’s Five Forces Analysis
6.2.1. Bargaining power of suppliers
6.2.2. Bargaining power of buyers
6.2.3. Threat of substitute
6.2.4. Threat of new entrants
6.2.5. Degree of competition
Chapter 7. Competitive Landscape
7.1.1. Company Market Share/Positioning Analysis
7.1.2. Key Strategies Adopted by Players
7.1.3. Vendor Landscape
7.1.3.1. List of Suppliers
7.1.3.2. List of Buyers
Chapter 8. Global Biochar Market, By Technology
8.1. Biochar Market, by Technology, 2023-2032
8.1.1 Pyrolysis
8.1.1.1. Market Revenue and Forecast (2020-2032)
8.1.2. Gasification
8.1.2.1. Market Revenue and Forecast (2020-2032)
8.1.3. Others
8.1.3.1. Market Revenue and Forecast (2020-2032)
Chapter 9. Global Biochar Market, By Feedstock
9.1. Biochar Market, by Feedstock, 2023-2032
9.1.1. Woody Biomass
9.1.1.1. Market Revenue and Forecast (2020-2032)
9.1.2. Agricultural Waste
9.1.2.1. Market Revenue and Forecast (2020-2032)
9.1.3. Animal Manure
9.1.3.1. Market Revenue and Forecast (2020-2032)
9.1.4. Others
9.1.4.1. Market Revenue and Forecast (2020-2032)
Chapter 10. Global Biochar Market, By Application
10.1. Biochar Market, by Application, 2023-2032
10.1.1. Agriculture
10.1.1.1. Market Revenue and Forecast (2020-2032)
10.1.2. Forestry
10.1.2.1. Market Revenue and Forecast (2020-2032)
10.1.3. Electricity Generation
10.1.3.1. Market Revenue and Forecast (2020-2032)
10.1.4. Others
10.1.4.1. Market Revenue and Forecast (2020-2032)
Chapter 11. Global Biochar Market, Regional Estimates and Trend Forecast
11.1. North America
11.1.1. Market Revenue and Forecast, by Technology (2020-2032)
11.1.2. Market Revenue and Forecast, by Feedstock (2020-2032)
11.1.3. Market Revenue and Forecast, by Application (2020-2032)
11.1.4. U.S.
11.1.4.1. Market Revenue and Forecast, by Technology (2020-2032)
11.1.4.2. Market Revenue and Forecast, by Feedstock (2020-2032)
11.1.4.3. Market Revenue and Forecast, by Application (2020-2032)
11.1.5. Rest of North America
11.1.5.1. Market Revenue and Forecast, by Technology (2020-2032)
11.1.5.2. Market Revenue and Forecast, by Feedstock (2020-2032)
11.1.5.3. Market Revenue and Forecast, by Application (2020-2032)
11.2. Europe
11.2.1. Market Revenue and Forecast, by Technology (2020-2032)
11.2.2. Market Revenue and Forecast, by Feedstock (2020-2032)
11.2.3. Market Revenue and Forecast, by Application (2020-2032)
11.2.4. UK
11.2.4.1. Market Revenue and Forecast, by Technology (2020-2032)
11.2.4.2. Market Revenue and Forecast, by Feedstock (2020-2032)
11.2.4.3. Market Revenue and Forecast, by Application (2020-2032)
11.2.5. Germany
11.2.5.1. Market Revenue and Forecast, by Technology (2020-2032)
11.2.5.2. Market Revenue and Forecast, by Feedstock (2020-2032)
11.2.5.3. Market Revenue and Forecast, by Application (2020-2032)
11.2.6. France
11.2.6.1. Market Revenue and Forecast, by Technology (2020-2032)
11.2.6.2. Market Revenue and Forecast, by Feedstock (2020-2032)
11.2.6.3. Market Revenue and Forecast, by Application (2020-2032)
11.2.7. Rest of Europe
11.2.7.1. Market Revenue and Forecast, by Technology (2020-2032)
11.2.7.2. Market Revenue and Forecast, by Feedstock (2020-2032)
11.2.7.3. Market Revenue and Forecast, by Application (2020-2032)
11.3. APAC
11.3.1. Market Revenue and Forecast, by Technology (2020-2032)
11.3.2. Market Revenue and Forecast, by Feedstock (2020-2032)
11.3.3. Market Revenue and Forecast, by Application (2020-2032)
11.3.4. India
11.3.4.1. Market Revenue and Forecast, by Technology (2020-2032)
11.3.4.2. Market Revenue and Forecast, by Feedstock (2020-2032)
11.3.4.3. Market Revenue and Forecast, by Application (2020-2032)
11.3.5. China
11.3.5.1. Market Revenue and Forecast, by Technology (2020-2032)
11.3.5.2. Market Revenue and Forecast, by Feedstock (2020-2032)
11.3.5.3. Market Revenue and Forecast, by Application (2020-2032)
11.3.6. Japan
11.3.6.1. Market Revenue and Forecast, by Technology (2020-2032)
11.3.6.2. Market Revenue and Forecast, by Feedstock (2020-2032)
11.3.6.3. Market Revenue and Forecast, by Application (2020-2032)
11.3.7. Rest of APAC
11.3.7.1. Market Revenue and Forecast, by Technology (2020-2032)
11.3.7.2. Market Revenue and Forecast, by Feedstock (2020-2032)
11.3.7.3. Market Revenue and Forecast, by Application (2020-2032)
11.4. MEA
11.4.1. Market Revenue and Forecast, by Technology (2020-2032)
11.4.2. Market Revenue and Forecast, by Feedstock (2020-2032)
11.4.3. Market Revenue and Forecast, by Application (2020-2032)
11.4.4. GCC
11.4.4.1. Market Revenue and Forecast, by Technology (2020-2032)
11.4.4.2. Market Revenue and Forecast, by Feedstock (2020-2032)
11.4.4.3. Market Revenue and Forecast, by Application (2020-2032)
11.4.5. North Africa
11.4.5.1. Market Revenue and Forecast, by Technology (2020-2032)
11.4.5.2. Market Revenue and Forecast, by Feedstock (2020-2032)
11.4.5.3. Market Revenue and Forecast, by Application (2020-2032)
11.4.6. South Africa
11.4.6.1. Market Revenue and Forecast, by Technology (2020-2032)
11.4.6.2. Market Revenue and Forecast, by Feedstock (2020-2032)
11.4.6.3. Market Revenue and Forecast, by Application (2020-2032)
11.4.7. Rest of MEA
11.4.7.1. Market Revenue and Forecast, by Technology (2020-2032)
11.4.7.2. Market Revenue and Forecast, by Feedstock (2020-2032)
11.4.7.3. Market Revenue and Forecast, by Application (2020-2032)
11.5. Latin America
11.5.1. Market Revenue and Forecast, by Technology (2020-2032)
11.5.2. Market Revenue and Forecast, by Feedstock (2020-2032)
11.5.3. Market Revenue and Forecast, by Application (2020-2032)
11.5.4. Brazil
11.5.4.1. Market Revenue and Forecast, by Technology (2020-2032)
11.5.4.2. Market Revenue and Forecast, by Feedstock (2020-2032)
11.5.4.3. Market Revenue and Forecast, by Application (2020-2032)
11.5.5. Rest of LATAM
11.5.5.1. Market Revenue and Forecast, by Technology (2020-2032)
11.5.5.2. Market Revenue and Forecast, by Feedstock (2020-2032)
11.5.5.3. Market Revenue and Forecast, by Application (2020-2032)
Chapter 12. Company Profiles
12.1. Airex Energy Inc.
12.1.1. Company Overview
12.1.2. Product Offerings
12.1.3. Financial Performance
12.1.4. Recent Initiatives
12.2. Biochar Supreme
12.2.1. Company Overview
12.2.2. Product Offerings
12.2.3. Financial Performance
12.2.4. Recent Initiatives
12.3. Farm2Energy Pvt Ltd
12.3.1. Company Overview
12.3.2. Product Offerings
12.3.3. Financial Performance
12.3.4. Recent Initiatives
12.4. Pacific Biochar Corporation
12.4.1. Company Overview
12.4.2. Product Offerings
12.4.3. Financial Performance
12.4.4. Recent Initiatives
12.5. ProActive Agriculture
12.5.1. Company Overview
12.5.2. Product Offerings
12.5.3. Financial Performance
12.5.4. Recent Initiatives
12.6. Phoenix Energy
12.6.1. Company Overview
12.6.2. Product Offerings
12.6.3. Financial Performance
12.6.4. Recent Initiatives
Chapter 13. Research Methodology
13.1. Primary Research
13.2. Secondary Research
13.3. Assumptions
Chapter 14. Appendix
14.1. About Us
14.2. Glossary of Terms
 Cross-segment Market Size and Analysis for
Mentioned Segments
Additional Company Profiles (Upto 5 With No Cost)
Additional Countries (Apart From Mentioned Countries)
Country/Region-specific Report
Go To Market Strategy
Region Specific Market DynamicsRegion Level Market Share Import Export AnalysisProduction AnalysisOthers
Cross-segment Market Size and Analysis for
Mentioned Segments
Additional Company Profiles (Upto 5 With No Cost)
Additional Countries (Apart From Mentioned Countries)
Country/Region-specific Report
Go To Market Strategy
Region Specific Market DynamicsRegion Level Market Share Import Export AnalysisProduction AnalysisOthers