Bioprocess Validation Market Size, Growth, Trends | Report 2023-2032
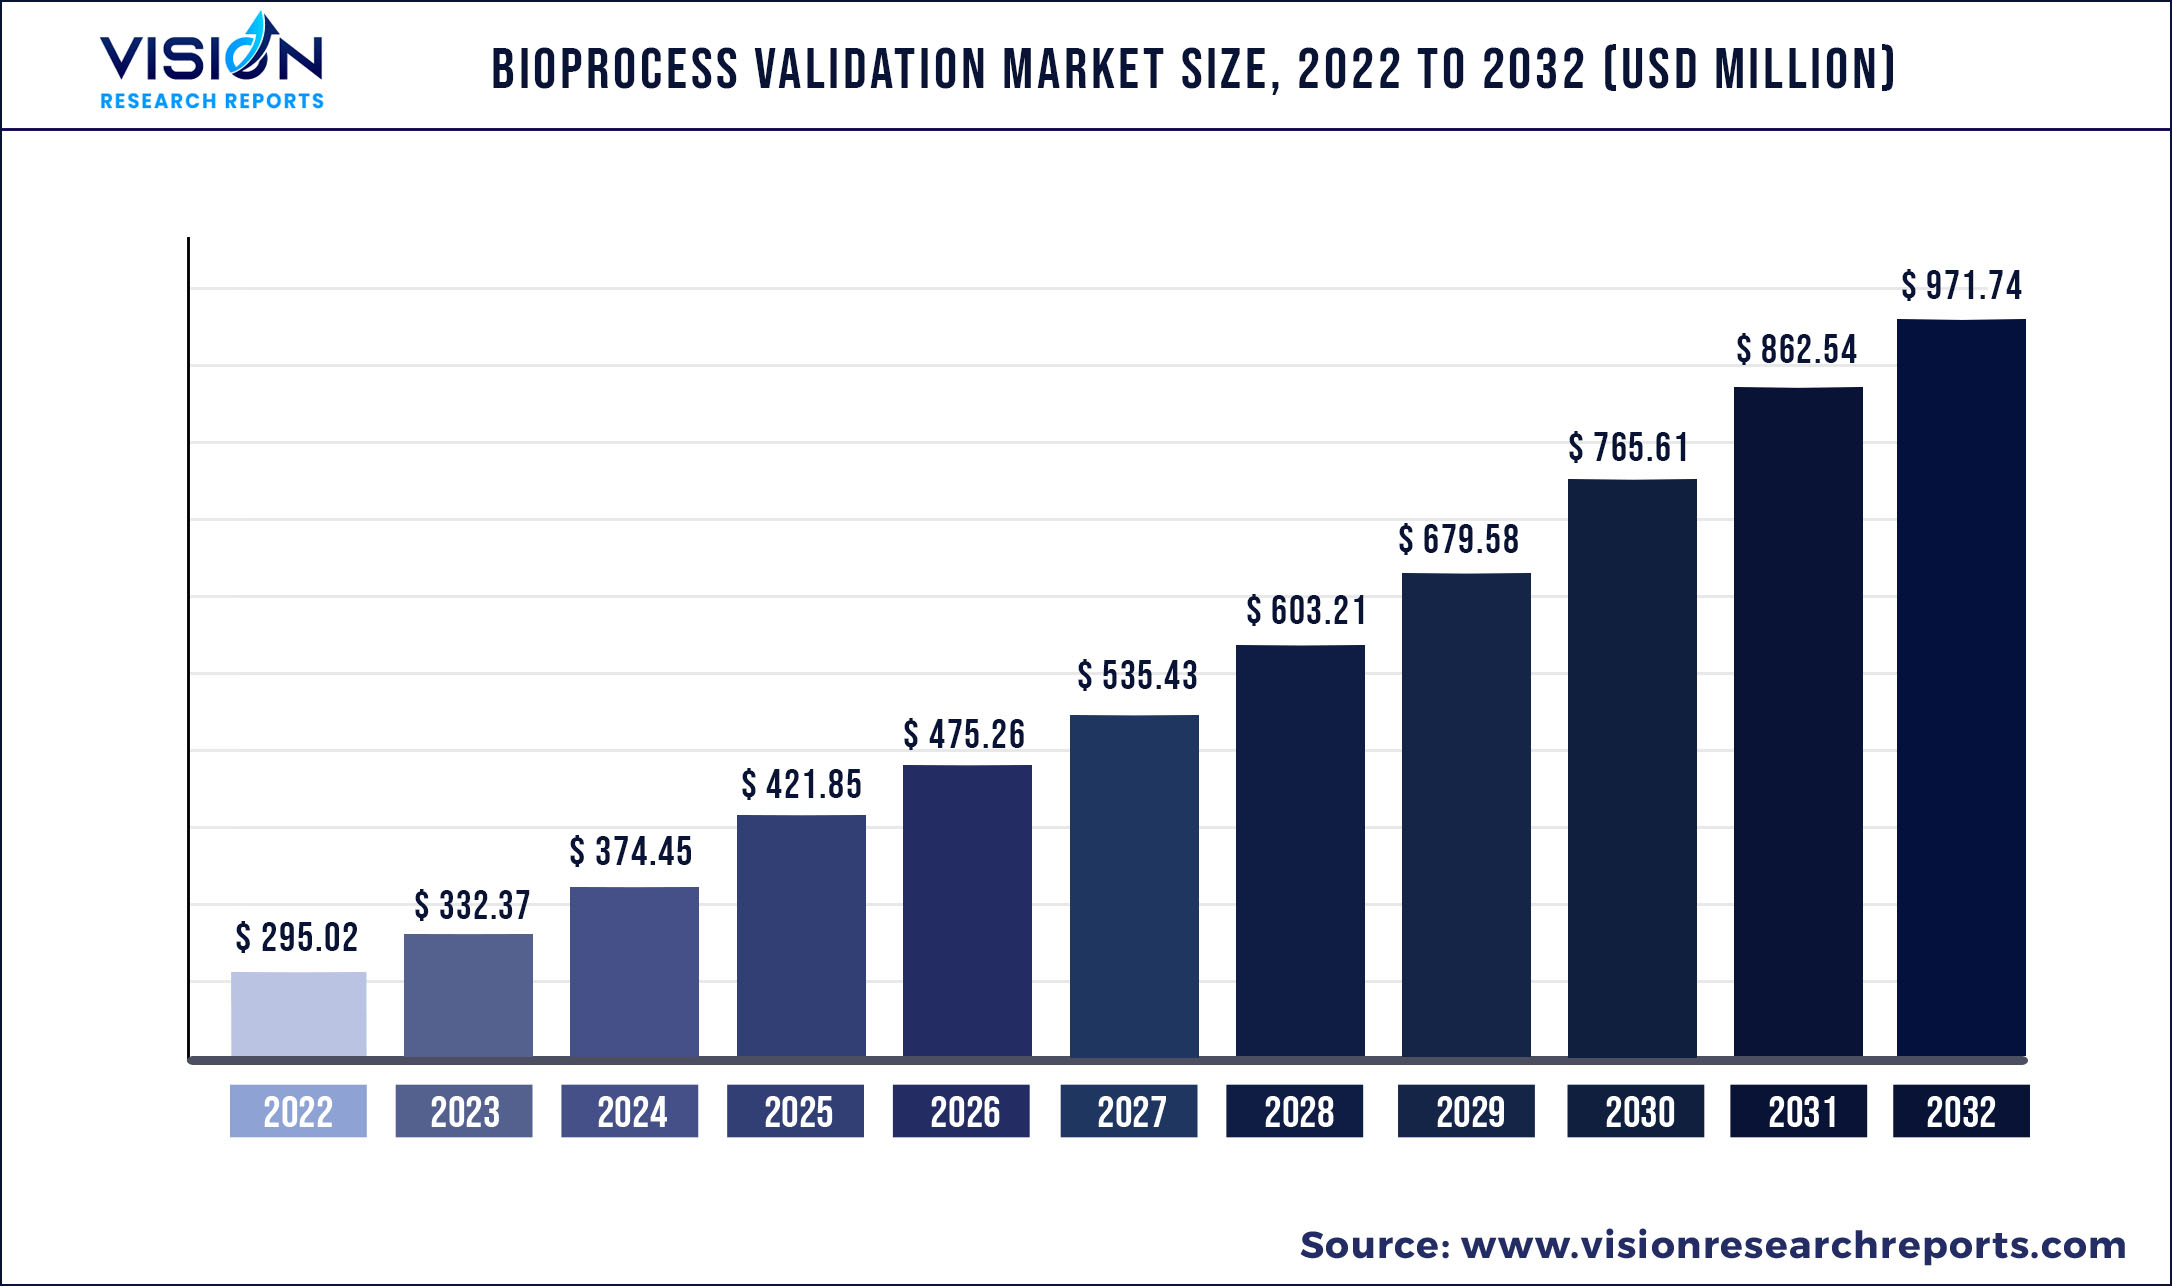
The global bioprocess validation market was estimated at USD 295.02 million in 2022 and it is expected to surpass around USD 971.74 million by 2032, poised to grow at a CAGR of 12.66% from 2023 to 2032.
Bioprocess Validation is documenting all the evidence of the procedure and activity of the testing and production of biopharmaceutical and other biological products. It also ensures that the compliance of the product tested is maintained at all the stages of processing. This method was proposed by FDA. Evaluation of the APIs, and contaminants (bacteria, endotoxin, mycoplasma) is the essential part of the process validation. An efficient bioprocess validation method assures the quality, safety, and efficacy of the product. In the biopharmaceutical sector, it is conducted in the compliance with FDA and EMA. The steps involved in the bioprocess validation are as follows:
Bioprocess validation procedures adhere to worldwide standards and CGMP requirements. Bioprocess validation is important to set the manufacturing process protocol for bioproducts. It is essential in process development, engineering, analytical technique development, statistics, regulatory affairs, quality control, and quality assurance. The demand for this process has increased after the COVID-19 pandemic as it is required in all the stages of clinical trials of vaccine development. This has been a key driver to boost the market. For instance, in November 2020, the company SGS invested in the Biosafety Centre of Excellence located in Glasglow. SGS will support the scientific research and manufacturing capacity for the development of the vaccine, cell therapies, gene therapies, and other medicine.
The high demand for bioprocess activity by the biopharmaceutical and biotechnology industries has increased for developing safe and effective regulatory-governed certified products. This spurs the market stake. Drug safety and efficacy guidelines have become stringent which enhances the bioprocess market. The process is cost-effective and economic which is the major key driver for the bioprocess verification market. Moreover, the prevalence of the outsourcing of validation processes in hospitals and clinics has been increased to maintain conformance with GMP which spurs market growth. The rise in the expenditure on R&D in the life science sector for developing efficient products has a positive impact on the market.
| Report Coverage | Details |
| Market Size in 2022 | USD 295.02 million |
| Revenue Forecast by 2032 | USD 971.74 million |
| Growth rate from 2023 to 2032 | CAGR of 12.66% |
| Base Year | 2022 |
| Forecast Period | 2023 to 2032 |
| Segmentation | Type, Application, End user, Region |
| Companies Covered | Thermo Fisher Scientific, Inc., Merck KGaA, Sartorius AG, Toxikon Corporation, Eurofins Scientific, Pall Corporation, Danaher Corporation, Cobetter Filtration Equipment Co. Ltd., Porvair Plc, Biozeen, SGS among other |
The market is segmented based on type, process component, application, end-user, and region. The type segment is divided into extractable and leachable testing services, microbiological testing services, integrity testing services, physiochemical testing services, compatibility testing services, and others. The process component segment is divided into filter assemblies, bioreactors, media containers and bags, freezing and thawing process bags, mixing systems, and transfer systems. The application segment is divided into biopharmaceuticals, specialty products, industrial chemicals, and environment management aid. The end-use segment is divided into pharmaceutical companies, biotechnology companies, CDMO, and CRO. The region segment is divided into North America, Europe, Asia-Pacific, Latin America, the Middle East, and Africa.
Based on the regional analysis North America leads the global bioprocess validation market. This is due to the presence of a large number of outsourcing service providers for the validation process in this region. Moreover, North America has a large number of key biotechnology and pharmaceutical industries operating in the R&D sector. Europe also has a significant share and will lead the market in the upcoming forecast. Asia-Pacific also has growing biopharmaceutical manufacturing capabilities which will spur the forecast market.
Key Players
Market Segmentation
Chapter 1. Introduction
1.1. Research Objective
1.2. Scope of the Study
1.3. Definition
Chapter 2. Research Methodology
2.1. Research Approach
2.2. Data Sources
2.3. Assumptions & Limitations
Chapter 3. Executive Summary
3.1. Market Snapshot
Chapter 4. Market Variables and Scope
4.1. Introduction
4.2. Market Classification and Scope
4.3. Industry Value Chain Analysis
4.3.1. Raw Material Procurement Analysis
4.3.2. Sales and Distribution Channel Analysis
4.3.3. Downstream Buyer Analysis
Chapter 5. COVID 19 Impact on Bioprocess Validation Market
5.1. COVID-19 Landscape: Bioprocess Validation Industry Impact
5.2. COVID 19 - Impact Assessment for the Industry
5.3. COVID 19 Impact: Global Major Government Policy
5.4. Market Trends and Opportunities in the COVID-19 Landscape
Chapter 6. Market Dynamics Analysis and Trends
6.1. Market Dynamics
6.1.1. Market Drivers
6.1.2. Market Restraints
6.1.3. Market Opportunities
6.2. Porter’s Five Forces Analysis
6.2.1. Bargaining power of suppliers
6.2.2. Bargaining power of buyers
6.2.3. Threat of substitute
6.2.4. Threat of new entrants
6.2.5. Degree of competition
Chapter 7. Competitive Landscape
7.1.1. Company Market Share/Positioning Analysis
7.1.2. Key Strategies Adopted by Players
7.1.3. Vendor Landscape
7.1.3.1. List of Suppliers
7.1.3.2. List of Buyers
Chapter 8. Global Bioprocess Validation Market, By Type
8.1. Bioprocess Validation Market, by Type, 2023-2032
8.1.1 Extractable and Leachable Testing Services
8.1.1.1. Market Revenue and Forecast (2019-2032)
8.1.2. Microbiological Testing Services
8.1.2.1. Market Revenue and Forecast (2019-2032)
8.1.3. Integrity Testing Services
8.1.3.1. Market Revenue and Forecast (2019-2032)
8.1.4. Physiochemical Testing Services
8.1.4.1. Market Revenue and Forecast (2019-2032)
8.1.5. Compatibility Testing Services
8.1.5.1. Market Revenue and Forecast (2019-2032)
8.1.6. Others
8.1.6.1. Market Revenue and Forecast (2019-2032)
Chapter 9. Global Bioprocess Validation Market, By Application
9.1. Bioprocess Validation Market, by Application, 2023-2032
9.1.1. Biopharmaceuticals
9.1.1.1. Market Revenue and Forecast (2019-2032)
9.1.2. Specialty Products
9.1.2.1. Market Revenue and Forecast (2019-2032)
9.1.3. Industry Chemicals
9.1.3.1. Market Revenue and Forecast (2019-2032)
9.1.4. Others
9.1.4.1. Market Revenue and Forecast (2019-2032)
Chapter 10. Global Bioprocess Validation Market, By End user
10.1. Bioprocess Validation Market, by End user, 2023-2032
10.1.1. Pharmaceutical Companies
10.1.1.1. Market Revenue and Forecast (2019-2032)
10.1.2. Biotechnology Companies
10.1.2.1. Market Revenue and Forecast (2019-2032)
10.1.3. Contract Development and Manufacturing Organizations
10.1.3.1. Market Revenue and Forecast (2019-2032)
10.1.4. Contract Research Organizations
10.1.4.1. Market Revenue and Forecast (2019-2032)
10.1.5. Others
10.1.5.1. Market Revenue and Forecast (2019-2032)
Chapter 11. Global Bioprocess Validation Market, Regional Estimates and Trend Forecast
11.1. North America
11.1.1. Market Revenue and Forecast, by Type (2019-2032)
11.1.2. Market Revenue and Forecast, by Application (2019-2032)
11.1.3. Market Revenue and Forecast, by End user (2019-2032)
11.1.4. U.S.
11.1.4.1. Market Revenue and Forecast, by Type (2019-2032)
11.1.4.2. Market Revenue and Forecast, by Application (2019-2032)
11.1.4.3. Market Revenue and Forecast, by End user (2019-2032)
11.1.5. Rest of North America
11.1.5.1. Market Revenue and Forecast, by Type (2019-2032)
11.1.5.2. Market Revenue and Forecast, by Application (2019-2032)
11.1.5.3. Market Revenue and Forecast, by End user (2019-2032)
11.2. Europe
11.2.1. Market Revenue and Forecast, by Type (2019-2032)
11.2.2. Market Revenue and Forecast, by Application (2019-2032)
11.2.3. Market Revenue and Forecast, by End user (2019-2032)
11.2.4. UK
11.2.4.1. Market Revenue and Forecast, by Type (2019-2032)
11.2.4.2. Market Revenue and Forecast, by Application (2019-2032)
11.2.4.3. Market Revenue and Forecast, by End user (2019-2032)
11.2.5. Germany
11.2.5.1. Market Revenue and Forecast, by Type (2019-2032)
11.2.5.2. Market Revenue and Forecast, by Application (2019-2032)
11.2.5.3. Market Revenue and Forecast, by End user (2019-2032)
11.2.6. France
11.2.6.1. Market Revenue and Forecast, by Type (2019-2032)
11.2.6.2. Market Revenue and Forecast, by Application (2019-2032)
11.2.6.3. Market Revenue and Forecast, by End user (2019-2032)
11.2.7. Rest of Europe
11.2.7.1. Market Revenue and Forecast, by Type (2019-2032)
11.2.7.2. Market Revenue and Forecast, by Application (2019-2032)
11.2.7.3. Market Revenue and Forecast, by End user (2019-2032)
11.3. APAC
11.3.1. Market Revenue and Forecast, by Type (2019-2032)
11.3.2. Market Revenue and Forecast, by Application (2019-2032)
11.3.3. Market Revenue and Forecast, by End user (2019-2032)
11.3.4. India
11.3.4.1. Market Revenue and Forecast, by Type (2019-2032)
11.3.4.2. Market Revenue and Forecast, by Application (2019-2032)
11.3.4.3. Market Revenue and Forecast, by End user (2019-2032)
11.3.5. China
11.3.5.1. Market Revenue and Forecast, by Type (2019-2032)
11.3.5.2. Market Revenue and Forecast, by Application (2019-2032)
11.3.5.3. Market Revenue and Forecast, by End user (2019-2032)
11.3.6. Japan
11.3.6.1. Market Revenue and Forecast, by Type (2019-2032)
11.3.6.2. Market Revenue and Forecast, by Application (2019-2032)
11.3.6.3. Market Revenue and Forecast, by End user (2019-2032)
11.3.7. Rest of APAC
11.3.7.1. Market Revenue and Forecast, by Type (2019-2032)
11.3.7.2. Market Revenue and Forecast, by Application (2019-2032)
11.3.7.3. Market Revenue and Forecast, by End user (2019-2032)
11.4. MEA
11.4.1. Market Revenue and Forecast, by Type (2019-2032)
11.4.2. Market Revenue and Forecast, by Application (2019-2032)
11.4.3. Market Revenue and Forecast, by End user (2019-2032)
11.4.4. GCC
11.4.4.1. Market Revenue and Forecast, by Type (2019-2032)
11.4.4.2. Market Revenue and Forecast, by Application (2019-2032)
11.4.4.3. Market Revenue and Forecast, by End user (2019-2032)
11.4.5. North Africa
11.4.5.1. Market Revenue and Forecast, by Type (2019-2032)
11.4.5.2. Market Revenue and Forecast, by Application (2019-2032)
11.4.5.3. Market Revenue and Forecast, by End user (2019-2032)
11.4.6. South Africa
11.4.6.1. Market Revenue and Forecast, by Type (2019-2032)
11.4.6.2. Market Revenue and Forecast, by Application (2019-2032)
11.4.6.3. Market Revenue and Forecast, by End user (2019-2032)
11.4.7. Rest of MEA
11.4.7.1. Market Revenue and Forecast, by Type (2019-2032)
11.4.7.2. Market Revenue and Forecast, by Application (2019-2032)
11.4.7.3. Market Revenue and Forecast, by End user (2019-2032)
11.5. Latin America
11.5.1. Market Revenue and Forecast, by Type (2019-2032)
11.5.2. Market Revenue and Forecast, by Application (2019-2032)
11.5.3. Market Revenue and Forecast, by End user (2019-2032)
11.5.4. Brazil
11.5.4.1. Market Revenue and Forecast, by Type (2019-2032)
11.5.4.2. Market Revenue and Forecast, by Application (2019-2032)
11.5.4.3. Market Revenue and Forecast, by End user (2019-2032)
11.5.5. Rest of LATAM
11.5.5.1. Market Revenue and Forecast, by Type (2019-2032)
11.5.5.2. Market Revenue and Forecast, by Application (2019-2032)
11.5.5.3. Market Revenue and Forecast, by End user (2019-2032)
Chapter 12. Company Profiles
12.1. Thermo Fisher Scientific, Inc.
12.1.1. Company Overview
12.1.2. Product Offerings
12.1.3. Financial Performance
12.1.4. Recent Initiatives
12.2. Merck KGaA
12.2.1. Company Overview
12.2.2. Product Offerings
12.2.3. Financial Performance
12.2.4. Recent Initiatives
12.3. Sartorius AG
12.3.1. Company Overview
12.3.2. Product Offerings
12.3.3. Financial Performance
12.3.4. Recent Initiatives
12.4. Toxikon Corporation
12.4.1. Company Overview
12.4.2. Product Offerings
12.4.3. Financial Performance
12.4.4. Recent Initiatives
12.5. Eurofins Scientific
12.5.1. Company Overview
12.5.2. Product Offerings
12.5.3. Financial Performance
12.5.4. Recent Initiatives
12.6. Pall Corporation
12.6.1. Company Overview
12.6.2. Product Offerings
12.6.3. Financial Performance
12.6.4. Recent Initiatives
12.7. Danaher Corporation
12.7.1. Company Overview
12.7.2. Product Offerings
12.7.3. Financial Performance
12.7.4. Recent Initiatives
12.8. Cobetter Filtration Equipment Co. Ltd.
12.8.1. Company Overview
12.8.2. Product Offerings
12.8.3. Financial Performance
12.8.4. Recent Initiatives
12.9. Porvair Plc
12.9.1. Company Overview
12.9.2. Product Offerings
12.9.3. Financial Performance
12.9.4. Recent Initiatives
12.10. Biozeen
12.10.1. Company Overview
12.10.2. Product Offerings
12.10.3. Financial Performance
12.10.4. Recent Initiatives
Chapter 13. Research Methodology
13.1. Primary Research
13.2. Secondary Research
13.3. Assumptions
Chapter 14. Appendix
14.1. About Us
14.2. Glossary of Terms
 Cross-segment Market Size and Analysis for
Mentioned Segments
Additional Company Profiles (Upto 5 With No Cost)
Additional Countries (Apart From Mentioned Countries)
Country/Region-specific Report
Go To Market Strategy
Region Specific Market DynamicsRegion Level Market Share Import Export AnalysisProduction AnalysisOthers
Cross-segment Market Size and Analysis for
Mentioned Segments
Additional Company Profiles (Upto 5 With No Cost)
Additional Countries (Apart From Mentioned Countries)
Country/Region-specific Report
Go To Market Strategy
Region Specific Market DynamicsRegion Level Market Share Import Export AnalysisProduction AnalysisOthers