Business Process Management Market Size, Trends, Share, Growth | Report 2023-2032
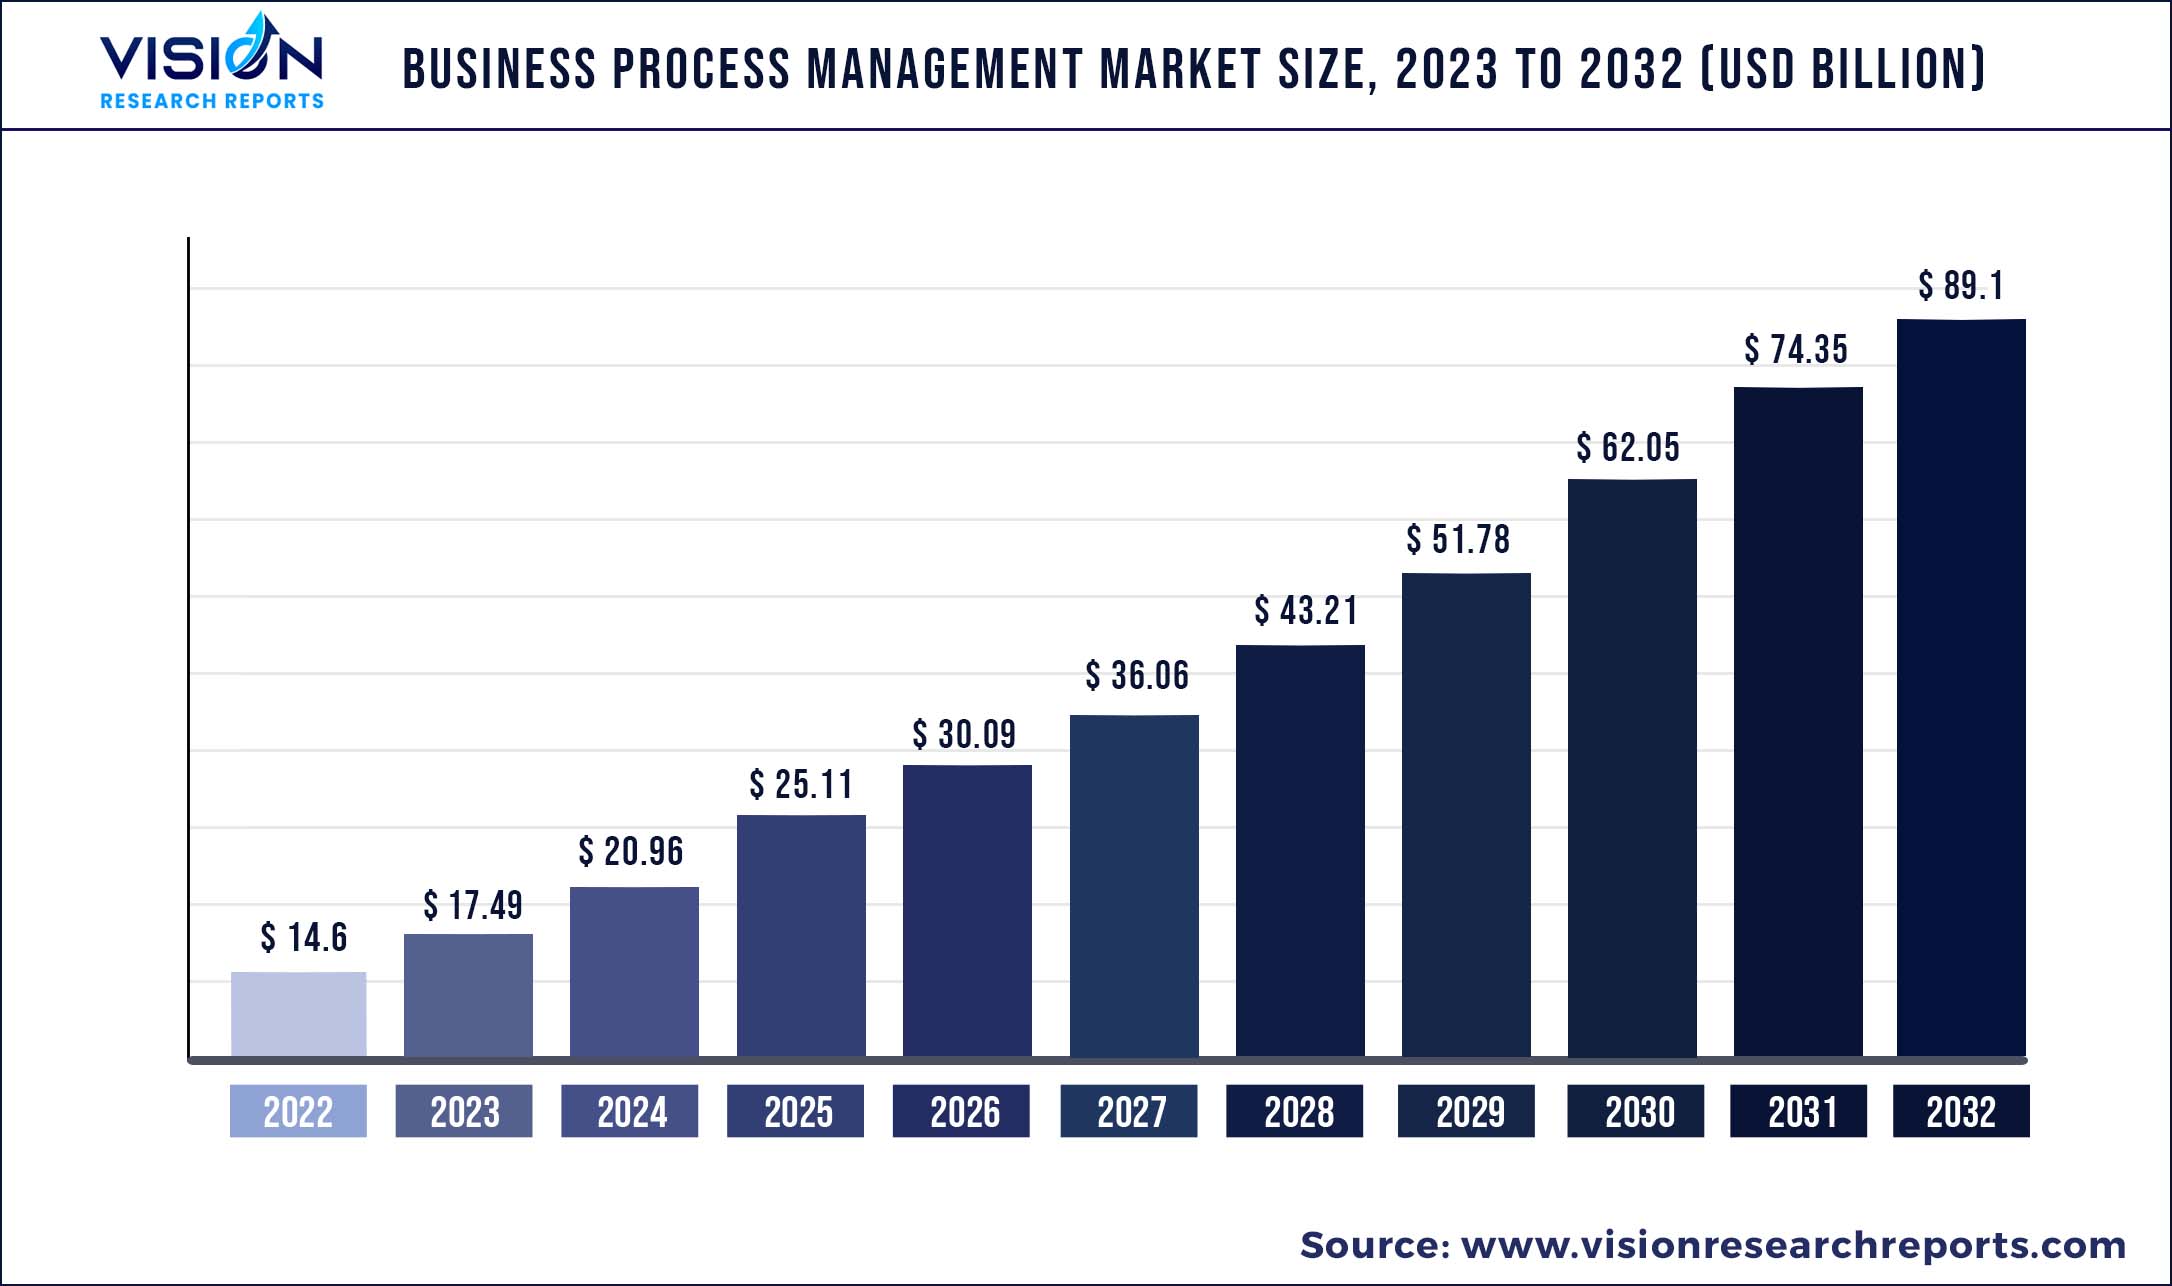
The global business process management market size was estimated at around USD 14.6 billion in 2022 and it is projected to hit around USD 89.1 billion by 2032, growing at a CAGR of 19.83% from 2023 to 2032.
Key Pointers
Report Scope of the Business Process Management Market
| Report Coverage | Details |
| Market Size in 2022 | USD 14.6 billion |
| Revenue Forecast by 2032 | USD 89.1 billion |
| Growth rate from 2023 to 2032 | CAGR of 19.83% |
| Base Year | 2022 |
| Forecast Period | 2023 to 2032 |
| Regions Covered | North America, Europe, Asia Pacific, Latin America, Middle East & Africa |
| Companies Covered | Accenture; Appian Corporation; Infosys Limited; International Business Machines Corporation; Open Text Corporation; Kissflow Inc.; Nintex Global Ltd.; Software AG; Tata Consultancy Services Limited; Pegasystems Inc.; Red Hat, Inc.; SAP SE; BP Logix; Inc. |
An increase in the adoption of cloud-based BPM software is one of the major factors driving the growth of the BPM market. Cloud-based BPM is much more effective than traditional BPM in terms of offering a flexible IT environment. BPM solutions, available as SaaS in the cloud, require no installation and maintenance and provide full software capabilities. SaaS-based BPM platforms strengthen business units attributed to low code functionality, which also had its share in driving the use of the cloud-based BPM market by deployment.
Another major factor driving the growth of the BPM market is its increasing adoption the emerging economies, especially in countries like India, which has favorable government policies and a growing IT industry. As of February 2022, according to the India Brand Equity Foundation (IBEF), the BPM sector of India employs more than 1.4 million people, and it is one of the preferred destinations for BPM in the world and had 52% market share in the export of services in 2020. The country is also home to BPM providers such as Infosys Limited and Tata Consultancy Services Limited, among others. A similar case is also found in the Philippines, which has a competitive IT infrastructure and favorable government policies in terms of tax benefits. Thus, a significant percentage of the growth of the BPM market can be attributed to BPM adoption in emerging economies.
Security concerns are a significant aspect of decelerating the BPM market. BPM is vulnerable to a wide variety of cyberattacks which includes malware, data theft, and hacker attacks, among others; such an incident will be catastrophic for business as it would negatively impact the company’s reputation. BPM software with an added layer of protection has a lower efficiency in terms of delivery speed than BPM software with a lower layer of protection. Better delivery speed is attracting business towards BPM software with lesser security levels. However, this is a dangerous way to move ahead with an increase in data breaches resulting in financial loss to businesses. For instance, according to the Global DNS Threat Report 2020, Security breaches cost an average of USD 924,000 annually.
Integrating advanced technologies such as machine learning and artificial intelligence with BPM software enhances decision-making capabilities, and predictive analysis, ensuring compliance and security. Companies such as SAP SE, Infosys Limited, BP Logix, Inc., etc., offer BPM software incorporated with ML and AI technologies. Another key technology that has paved its way into BPM software is RPA (Robotic Process Automation); the combination enables the restructuring of the workforce, speeds up tasks, etc. For instance, in October 2020, Nintex Global Ltd. acquired K2 Software Inc, which has enabled the digital transformation of Nintex with RPA, workflows, and others. Many companies in the business process management market offer software incorporated with RPA, ML, AI, etc. This has further enhanced the capabilities of BPM, which has been a significant factor in the growth of the cloud endpoint management market.
Business Process Management Market Segmentations:
| By Solution | By Application | By Deployment | By End-use |
|
Automation Content & Document Management Process Modelling Content & Document Management Monitoring & Optimization Integration Others |
BFSI IT Retail Manufacturing Healthcare Government & Defense Others |
Cloud On-premise |
SMEs Large Enterprise |
Chapter 1. Introduction
1.1. Research Objective
1.2. Scope of the Study
1.3. Definition
Chapter 2. Research Methodology
2.1. Research Approach
2.2. Data Sources
2.3. Assumptions & Limitations
Chapter 3. Executive Summary
3.1. Market Snapshot
Chapter 4. Market Variables and Scope
4.1. Introduction
4.2. Market Classification and Scope
4.3. Industry Value Chain Analysis
4.3.1. Raw Material Procurement Analysis
4.3.2. Sales and Distribution Channel Analysis
4.3.3. Downstream Buyer Analysis
Chapter 5. COVID 19 Impact on Business Process Management Market
5.1. COVID-19 Landscape: Business Process Management Industry Impact
5.2. COVID 19 - Impact Assessment for the Industry
5.3. COVID 19 Impact: Global Major Government Policy
5.4. Market Trends and Opportunities in the COVID-19 Landscape
Chapter 6. Market Dynamics Analysis and Trends
6.1. Market Dynamics
6.1.1. Market Drivers
6.1.2. Market Restraints
6.1.3. Market Opportunities
6.2. Porter’s Five Forces Analysis
6.2.1. Bargaining power of suppliers
6.2.2. Bargaining power of buyers
6.2.3. Threat of substitute
6.2.4. Threat of new entrants
6.2.5. Degree of competition
Chapter 7. Competitive Landscape
7.1.1. Company Market Share/Positioning Analysis
7.1.2. Key Strategies Adopted by Players
7.1.3. Vendor Landscape
7.1.3.1. List of Suppliers
7.1.3.2. List of Buyers
Chapter 8. Global Business Process Management Market, By Automation
8.1. Business Process Management Market, by Solution, 2023-2032
8.1.1. Automation
8.1.1.1. Market Revenue and Forecast (2020-2032)
8.1.2. Content & Document Management
8.1.2.1. Market Revenue and Forecast (2020-2032)
8.1.3. Process Modelling
8.1.3.1. Market Revenue and Forecast (2020-2032)
8.1.4. Content & Document Management
8.1.4.1. Market Revenue and Forecast (2020-2032)
8.1.5. Monitoring & Optimization
8.1.5.1. Market Revenue and Forecast (2020-2032)
8.1.6. Integration
8.1.6.1. Market Revenue and Forecast (2020-2032)
8.1.7. Others
8.1.7.1. Market Revenue and Forecast (2020-2032)
Chapter 9. Global Business Process Management Market, By Application
9.1. Business Process Management Market, by Application, 2023-2032
9.1.1. BFSI
9.1.1.1. Market Revenue and Forecast (2020-2032)
9.1.2. IT
9.1.2.1. Market Revenue and Forecast (2020-2032)
9.1.3. Retail
9.1.3.1. Market Revenue and Forecast (2020-2032)
9.1.4. Manufacturing
9.1.4.1. Market Revenue and Forecast (2020-2032)
9.1.5. Healthcare
9.1.5.1. Market Revenue and Forecast (2020-2032)
9.1.5. Government & Defense
9.1.5.1. Market Revenue and Forecast (2020-2032)
9.1.5. Others
9.1.5.1. Market Revenue and Forecast (2020-2032)
Chapter 10. Global Business Process Management Market, By Deployment
10.1. Business Process Management Market, by Deployment, 2023-2032
10.1.1. Cloud
10.1.1.1. Market Revenue and Forecast (2020-2032)
10.1.2. On-premise
10.1.2.1. Market Revenue and Forecast (2020-2032)
Chapter 11. Global Business Process Management Market, By End-use
11.1. Business Process Management Market, by End-use, 2023-2032
11.1.1. SMEs
11.1.1.1. Market Revenue and Forecast (2020-2032)
11.1.2. Large Enterprise
11.1.2.1. Market Revenue and Forecast (2020-2032)
Chapter 12. Global Business Process Management Market, Regional Estimates and Trend Forecast
12.1. North America
12.1.1. Market Revenue and Forecast, by Solution (2020-2032)
12.1.2. Market Revenue and Forecast, by Application (2020-2032)
12.1.3. Market Revenue and Forecast, by Deployment (2020-2032)
12.1.4. Market Revenue and Forecast, by End-use (2020-2032)
12.1.5. U.S.
12.1.5.1. Market Revenue and Forecast, by Solution (2020-2032)
12.1.5.2. Market Revenue and Forecast, by Application (2020-2032)
12.1.5.3. Market Revenue and Forecast, by Deployment (2020-2032)
12.1.5.4. Market Revenue and Forecast, by End-use (2020-2032)
12.1.6. Rest of North America
12.1.6.1. Market Revenue and Forecast, by Solution (2020-2032)
12.1.6.2. Market Revenue and Forecast, by Application (2020-2032)
12.1.6.3. Market Revenue and Forecast, by Deployment (2020-2032)
12.1.6.4. Market Revenue and Forecast, by End-use (2020-2032)
12.2. Europe
12.2.1. Market Revenue and Forecast, by Solution (2020-2032)
12.2.2. Market Revenue and Forecast, by Application (2020-2032)
12.2.3. Market Revenue and Forecast, by Deployment (2020-2032)
12.2.4. Market Revenue and Forecast, by End-use (2020-2032)
12.2.5. UK
12.2.5.1. Market Revenue and Forecast, by Solution (2020-2032)
12.2.5.2. Market Revenue and Forecast, by Application (2020-2032)
12.2.5.3. Market Revenue and Forecast, by Deployment (2020-2032)
12.2.5.4. Market Revenue and Forecast, by End-use (2020-2032)
12.2.6. Germany
12.2.6.1. Market Revenue and Forecast, by Solution (2020-2032)
12.2.6.2. Market Revenue and Forecast, by Application (2020-2032)
12.2.6.3. Market Revenue and Forecast, by Deployment (2020-2032)
12.2.6.4. Market Revenue and Forecast, by End-use (2020-2032)
12.2.7. France
12.2.7.1. Market Revenue and Forecast, by Solution (2020-2032)
12.2.7.2. Market Revenue and Forecast, by Application (2020-2032)
12.2.7.3. Market Revenue and Forecast, by Deployment (2020-2032)
12.2.7.4. Market Revenue and Forecast, by End-use (2020-2032)
12.2.8. Rest of Europe
12.2.8.1. Market Revenue and Forecast, by Solution (2020-2032)
12.2.8.2. Market Revenue and Forecast, by Application (2020-2032)
12.2.8.3. Market Revenue and Forecast, by Deployment (2020-2032)
12.2.8.4. Market Revenue and Forecast, by End-use (2020-2032)
12.3. APAC
12.3.1. Market Revenue and Forecast, by Solution (2020-2032)
12.3.2. Market Revenue and Forecast, by Application (2020-2032)
12.3.3. Market Revenue and Forecast, by Deployment (2020-2032)
12.3.4. Market Revenue and Forecast, by End-use (2020-2032)
12.3.5. India
12.3.5.1. Market Revenue and Forecast, by Solution (2020-2032)
12.3.5.2. Market Revenue and Forecast, by Application (2020-2032)
12.3.5.3. Market Revenue and Forecast, by Deployment (2020-2032)
12.3.5.4. Market Revenue and Forecast, by End-use (2020-2032)
12.3.6. China
12.3.6.1. Market Revenue and Forecast, by Solution (2020-2032)
12.3.6.2. Market Revenue and Forecast, by Application (2020-2032)
12.3.6.3. Market Revenue and Forecast, by Deployment (2020-2032)
12.3.6.4. Market Revenue and Forecast, by End-use (2020-2032)
12.3.7. Japan
12.3.7.1. Market Revenue and Forecast, by Solution (2020-2032)
12.3.7.2. Market Revenue and Forecast, by Application (2020-2032)
12.3.7.3. Market Revenue and Forecast, by Deployment (2020-2032)
12.3.7.4. Market Revenue and Forecast, by End-use (2020-2032)
12.3.8. Rest of APAC
12.3.8.1. Market Revenue and Forecast, by Solution (2020-2032)
12.3.8.2. Market Revenue and Forecast, by Application (2020-2032)
12.3.8.3. Market Revenue and Forecast, by Deployment (2020-2032)
12.3.8.4. Market Revenue and Forecast, by End-use (2020-2032)
12.4. MEA
12.4.1. Market Revenue and Forecast, by Solution (2020-2032)
12.4.2. Market Revenue and Forecast, by Application (2020-2032)
12.4.3. Market Revenue and Forecast, by Deployment (2020-2032)
12.4.4. Market Revenue and Forecast, by End-use (2020-2032)
12.4.5. GCC
12.4.5.1. Market Revenue and Forecast, by Solution (2020-2032)
12.4.5.2. Market Revenue and Forecast, by Application (2020-2032)
12.4.5.3. Market Revenue and Forecast, by Deployment (2020-2032)
12.4.5.4. Market Revenue and Forecast, by End-use (2020-2032)
12.4.6. North Africa
12.4.6.1. Market Revenue and Forecast, by Solution (2020-2032)
12.4.6.2. Market Revenue and Forecast, by Application (2020-2032)
12.4.6.3. Market Revenue and Forecast, by Deployment (2020-2032)
12.4.6.4. Market Revenue and Forecast, by End-use (2020-2032)
12.4.7. South Africa
12.4.7.1. Market Revenue and Forecast, by Solution (2020-2032)
12.4.7.2. Market Revenue and Forecast, by Application (2020-2032)
12.4.7.3. Market Revenue and Forecast, by Deployment (2020-2032)
12.4.7.4. Market Revenue and Forecast, by End-use (2020-2032)
12.4.8. Rest of MEA
12.4.8.1. Market Revenue and Forecast, by Solution (2020-2032)
12.4.8.2. Market Revenue and Forecast, by Application (2020-2032)
12.4.8.3. Market Revenue and Forecast, by Deployment (2020-2032)
12.4.8.4. Market Revenue and Forecast, by End-use (2020-2032)
12.5. Latin America
12.5.1. Market Revenue and Forecast, by Solution (2020-2032)
12.5.2. Market Revenue and Forecast, by Application (2020-2032)
12.5.3. Market Revenue and Forecast, by Deployment (2020-2032)
12.5.4. Market Revenue and Forecast, by End-use (2020-2032)
12.5.5. Brazil
12.5.5.1. Market Revenue and Forecast, by Solution (2020-2032)
12.5.5.2. Market Revenue and Forecast, by Application (2020-2032)
12.5.5.3. Market Revenue and Forecast, by Deployment (2020-2032)
12.5.5.4. Market Revenue and Forecast, by End-use (2020-2032)
12.5.6. Rest of LATAM
12.5.6.1. Market Revenue and Forecast, by Solution (2020-2032)
12.5.6.2. Market Revenue and Forecast, by Application (2020-2032)
12.5.6.3. Market Revenue and Forecast, by Deployment (2020-2032)
12.5.6.4. Market Revenue and Forecast, by End-use (2020-2032)
Chapter 13. Company Profiles
13.1. Accenture
13.1.1. Company Overview
13.1.2. Product Offerings
13.1.3. Financial Performance
13.1.4. Recent Initiatives
13.2. Appian Corporation
13.2.1. Company Overview
13.2.2. Product Offerings
13.2.3. Financial Performance
13.2.4. Recent Initiatives
13.3. Infosys Limited
13.3.1. Company Overview
13.3.2. Product Offerings
13.3.3. Financial Performance
13.3.4. Recent Initiatives
13.4. International Business Machines Corporation
13.4.1. Company Overview
13.4.2. Product Offerings
13.4.3. Financial Performance
13.4.4. Recent Initiatives
13.5. Open Text Corporation
13.5.1. Company Overview
13.5.2. Product Offerings
13.5.3. Financial Performance
13.5.4. Recent Initiatives
13.6. Kissflow Inc.
13.6.1. Company Overview
13.6.2. Product Offerings
13.6.3. Financial Performance
13.6.4. Recent Initiatives
13.7. Nintex Global Ltd.
13.7.1. Company Overview
13.7.2. Product Offerings
13.7.3. Financial Performance
13.7.4. Recent Initiatives
13.8. Software AG
13.8.1. Company Overview
13.8.2. Product Offerings
13.8.3. Financial Performance
13.8.4. Recent Initiatives
13.9. Tata Consultancy Services Limited
13.9.1. Company Overview
13.9.2. Product Offerings
13.9.3. Financial Performance
13.9.4. Recent Initiatives
13.10. Pegasystems Inc.
13.10.1. Company Overview
13.10.2. Product Offerings
13.10.3. Financial Performance
13.10.4. Recent Initiatives
Chapter 14. Research Methodology
14.1. Primary Research
14.2. Secondary Research
14.3. Assumptions
Chapter 15. Appendix
15.1. About Us
15.2. Glossary of Terms
 Cross-segment Market Size and Analysis for
Mentioned Segments
Additional Company Profiles (Upto 5 With No Cost)
Additional Countries (Apart From Mentioned Countries)
Country/Region-specific Report
Go To Market Strategy
Region Specific Market DynamicsRegion Level Market Share Import Export AnalysisProduction AnalysisOthers
Cross-segment Market Size and Analysis for
Mentioned Segments
Additional Company Profiles (Upto 5 With No Cost)
Additional Countries (Apart From Mentioned Countries)
Country/Region-specific Report
Go To Market Strategy
Region Specific Market DynamicsRegion Level Market Share Import Export AnalysisProduction AnalysisOthers