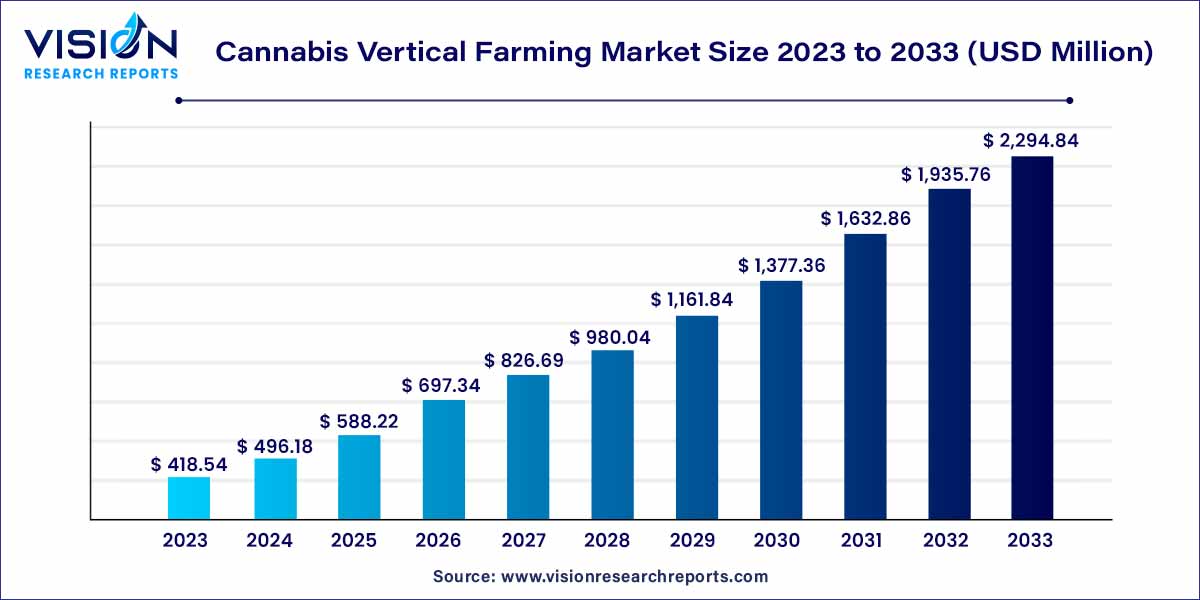
The global cannabis vertical farming market was estimated at USD 418.54 million in 2023 and it is expected to surpass around USD 2,294.84 million by 2033, poised to grow at a CAGR of 18.55% from 2024 to 2033.

The cannabis vertical farming market has emerged as a dynamic sector within the broader landscape of agricultural practices, driven by a confluence of factors reshaping the cultivation of cannabis. Vertical farming, characterized by its innovative approach to space utilization and climate control, has garnered significant attention for its potential to revolutionize the cannabis industry.
The growth of the cannabis vertical farming market is underpinned by a constellation of factors that collectively contribute to its burgeoning trajectory. One pivotal driver is the imperative for year-round cultivation, ensuring a constant and predictable supply of cannabis irrespective of traditional growing seasons. This method also optimizes space utilization, a critical consideration given the constraints of urbanization and limited arable land. Technological advancements play a central role, with automated systems, data analytics, and sensor-based monitoring enhancing resource efficiency and crop quality. Moreover, the industry benefits from a shifting regulatory landscape that increasingly supports and clarifies the parameters for cannabis cultivation. These growth factors collectively position cannabis vertical farming as a transformative solution, offering scalability, sustainability, and resilience in meeting the rising demand for high-quality cannabis products.
| Report Coverage | Details |
| Market Revenue by 2033 | USD 2,294.84 million |
| Growth Rate from 2024 to 2033 | CAGR of 18.55% |
| Revenue Share of North America in 2023 | 34% |
| CAGR of Asia Pacific from 2024 to 2033 | 19.17% |
| Base Year | 2023 |
| Forecast Period | 2024 to 2033 |
| Market Analysis (Terms Used) | Value (US$ Million/Billion) or (Volume/Units) |
Shipping container segment dominated the market with a revenue share of 54% in 2023 and is expected to remain dominant between 2024 and 2033. This growth is attributed to the ability of their structure to help grow crops irrespective of geographic location. Using shipping containers for hemp or marijuana cultivation offers several compelling advantages for growers. Firstly, they significantly boost production by providing precise environmental control, resulting in healthier and more robust crops.
Building-based segment is anticipated to register the fastest CAGR of 19.24% from 2024 to 2033. Building-based cannabis vertical farming operations can incur substantial costs, encompassing both initial capital investments and ongoing operational expenses. Larger vertical farms typically rely on funding from venture capital or investment firms to get started. Locating an appropriate site can pose difficulties, especially in urban regions where land and building costs are elevated. Day-to-day running costs involve expenditures on labor, energy, and essential supplies required for planting, harvesting, and potentially preserving the crop.
Based on component, cannabis vertical farming market is segmented into hardware, software, and services. Hardware segment dominated with a revenue share of 63% in 2023. Hardware is crucial for regulating the vertical farming environment and is further categorized into lighting, climate control, hydroponic components, and sensors. Lighting sub-segment led the hardware market and accounted for 27.8% in 2023. The substantial share is due to vertical farms' reliance on artificial lighting, which provides the necessary light intensity for marijuana growth.
Software segment is expected to register a CAGR of 20.15% from 2024 to 2033, owing to the rapid adoption of advanced farming practices and its essential role in optimizing and automating various aspects of the cultivation process. Software solutions offer advanced capabilities, including data analytics and real-time adjustments, enabling growers to enhance productivity, crop quality, and resource utilization. This technological advancement is particularly valuable in the cannabis industry, where precision and consistency are paramount.
Hydroponics segment registered the largest revenue share of 47% in 2023 and is expected to remain dominant between 2024 and 2033. Hydroponics is a favored cultivation method known for its cost-effectiveness and simplicity of operation. It involves plant growth without soil, with a mineral solution used in place of traditional soil for nourishing the plant roots. Moreover, hydroponics eliminates risk of soil-borne diseases caused by organisms. Growing consumer awareness of pesticide-related concerns is anticipated to drive increased demand for hydroponics.
Aeroponics segment is expected to register a significant CAGR from 2024 to 2033. This system, similar to hydroponics, doesn't rely on soil for plant growth. In aeroponics, plant roots are suspended in a dark chamber and regularly sprayed with a nutrient-rich solution, eliminating the need for a growing medium. Aeroponics offers several advantages in marijuana cultivation, including space efficiency, improved nutrient absorption, and higher-quality yields. This results in rapid growth and the development of high-quality buds with abundant trichomes. However, aeroponics can involve high initial setup costs, requiring specialized equipment and a consistent supply of electricity and water to maintain plant development, thus hampering market growth.
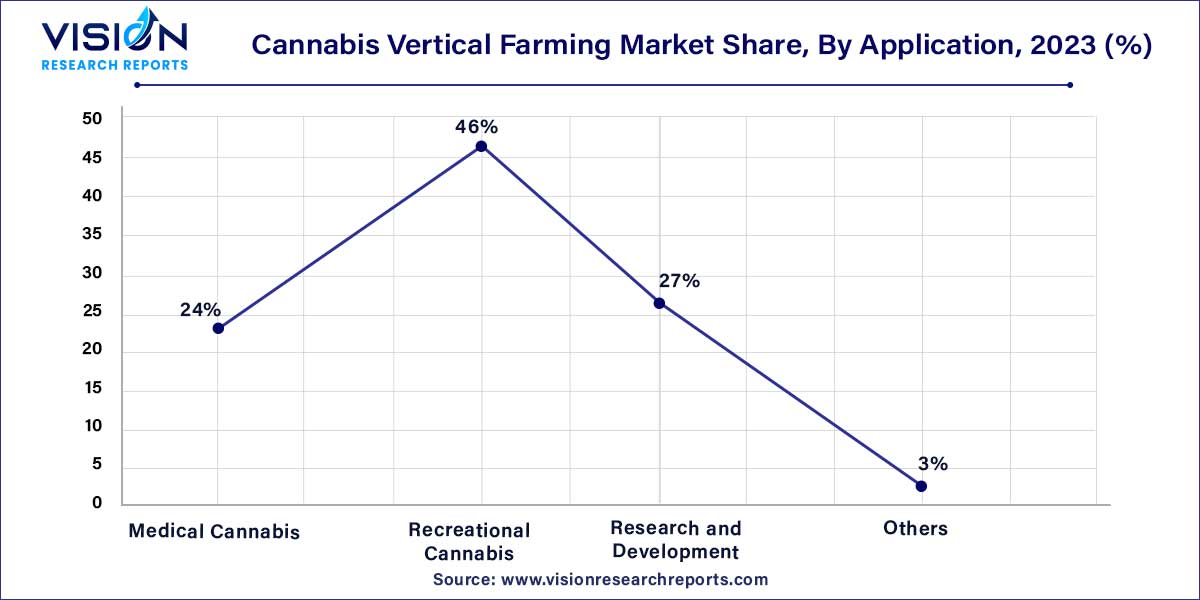
The recreational cannabis segment registered the largest market share of 46% in 2023 and is expected to remain dominant between 2024 and 2033. Increasing legalization and acceptance of recreational marijuana in various regions have substantially increased demand, promoting market growth. Recreational cannabis often controls a higher price point compared to medical cannabis, making it a suitable choice for commercial cultivation. Additionally, recreational cannabis requires consistent quality and potency to meet the expectations of discerning consumers, which can be achieved more reliably through controlled vertical farming practices.

Medical cannabis segment is anticipated to grow with the fastest CAGR of 19.44% over the forecast period. Cannabis is known to encompass more than 560 various compounds, with 120 of them being cannabinoids. Among these cannabinoids, delta 9-tetrahydrocannabinol, and cannabidiol stand out as the two major compounds, each possessing distinct pharmacological characteristics and significant therapeutic potential. Cultivating medical-grade cannabis in an open field is highly challenging, and thus, vertical farming facilities have become the preferred choice. Vertical farming is the ideal choice for cultivating medical-grade cannabis due to its precise environmental control, ensuring consistent quality and year-round production.
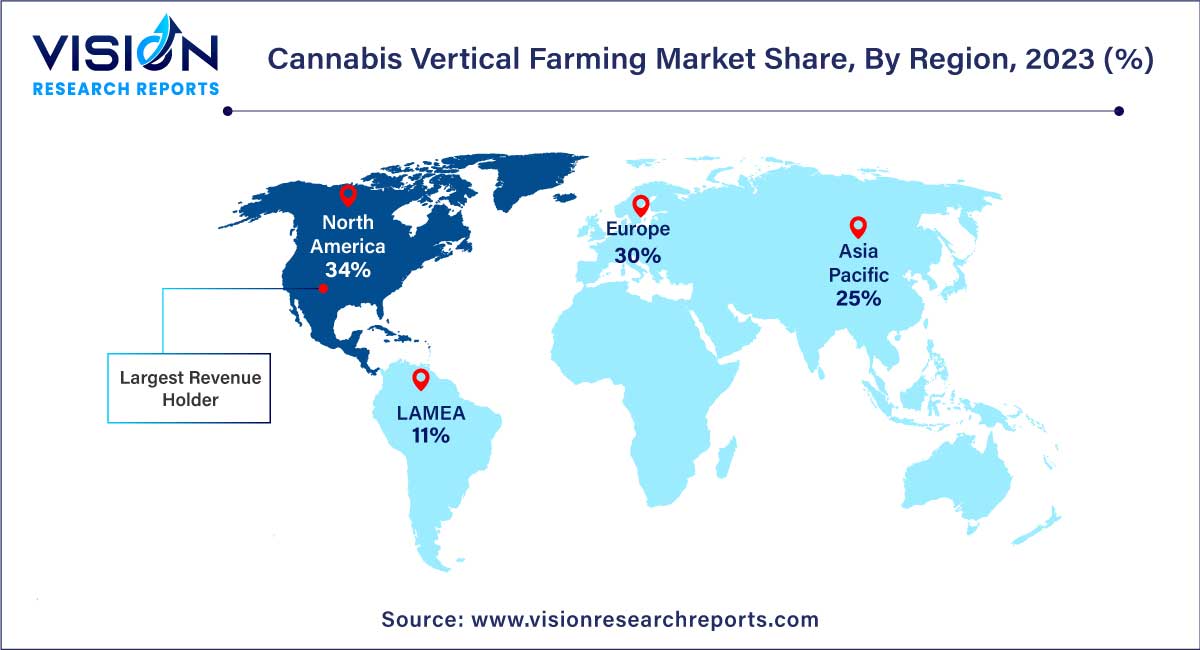
In terms of revenue, North America held a dominant share of approximately 34% in 2023 and is expected to continue leading between 2024 and 2033. Increasing legalization movement within North America is one of the driving factors for this growth. U.S. dominated North America due to 37 of the U.S. states legalizing medical use of marijuana. It has created a substantial and expanding market for cannabis products.

Asia Pacific region is anticipated to witness the fastest CAGR of 19.17% over the projected period, owing to several key factors. The region is experiencing a surge in demand for cannabis, both for medical and recreational use. Legal changes and evolving regulations in some Asian countries have encouraged investments in the cannabis industry, facilitating market growth. The substantial and growing population in Asia Pacific has contributed to a robust demand for marijuana products, making vertical farming a viable solution to meet this need.
By Structure
By Component
By Growing Mechanism
By Application
By Region
Chapter 1. Introduction
1.1. Research Objective
1.2. Scope of the Study
1.3. Definition
Chapter 2. Research Methodology
2.1. Research Approach
2.2. Data Sources
2.3. Assumptions & Limitations
Chapter 3. Executive Summary
3.1. Market Snapshot
Chapter 4. Market Variables and Scope
4.1. Introduction
4.2. Market Classification and Scope
4.3. Industry Value Chain Analysis
4.3.1. Raw Material Procurement Analysis
4.3.2. Sales and Distribution Channel Analysis
4.3.3. Downstream Buyer Analysis
Chapter 5. COVID 19 Impact on Cannabis Vertical Farming Market
5.1. COVID-19 Landscape: Cannabis Vertical Farming Industry Impact
5.2. COVID 19 - Impact Assessment for the Industry
5.3. COVID 19 Impact: Global Major Government Policy
5.4. Market Trends and Opportunities in the COVID-19 Landscape
Chapter 6. Market Dynamics Analysis and Trends
6.1. Market Dynamics
6.1.1. Market Drivers
6.1.2. Market Restraints
6.1.3. Market Opportunities
6.2. Porter’s Five Forces Analysis
6.2.1. Bargaining power of suppliers
6.2.2. Bargaining power of buyers
6.2.3. Threat of substitute
6.2.4. Threat of new entrants
6.2.5. Degree of competition
Chapter 7. Competitive Landscape
7.1.1. Company Market Share/Positioning Analysis
7.1.2. Key Strategies Adopted by Players
7.1.3. Vendor Landscape
7.1.3.1. List of Suppliers
7.1.3.2. List of Buyers
Chapter 8. Global Cannabis Vertical Farming Market, By Structure
8.1. Cannabis Vertical Farming Market, by Structure, 2024-2033
8.1.1. Shipping Container
8.1.1.1. Market Revenue and Forecast (2021-2033)
8.1.2. Building-based
8.1.2.1. Market Revenue and Forecast (2021-2033)
Chapter 9. Global Cannabis Vertical Farming Market, By Component
9.1. Cannabis Vertical Farming Market, by Component, 2024-2033
9.1.1. Hardware
9.1.1.1. Market Revenue and Forecast (2021-2033)
9.1.2. Software
9.1.2.1. Market Revenue and Forecast (2021-2033)
9.1.3. Services
9.1.3.1. Market Revenue and Forecast (2021-2033)
Chapter 10. Global Cannabis Vertical Farming Market, By Growing Mechanism
10.1. Cannabis Vertical Farming Market, by Growing Mechanism, 2024-2033
10.1.1. Hydroponics
10.1.1.1. Market Revenue and Forecast (2021-2033)
10.1.2. Aeroponics
10.1.2.1. Market Revenue and Forecast (2021-2033)
10.1.3. Aquaponics
10.1.3.1. Market Revenue and Forecast (2021-2033)
Chapter 11. Global Cannabis Vertical Farming Market, By Application
11.1. Cannabis Vertical Farming Market, by Application, 2024-2033
11.1.1. Medical Cannabis
11.1.1.1. Market Revenue and Forecast (2021-2033)
11.1.2. Recreational Cannabis
11.1.2.1. Market Revenue and Forecast (2021-2033)
11.1.3. Research and Development
11.1.3.1. Market Revenue and Forecast (2021-2033)
11.1.4. Others
11.1.4.1. Market Revenue and Forecast (2021-2033)
Chapter 12. Global Cannabis Vertical Farming Market, Regional Estimates and Trend Forecast
12.1. North America
12.1.1. Market Revenue and Forecast, by Structure (2021-2033)
12.1.2. Market Revenue and Forecast, by Component (2021-2033)
12.1.3. Market Revenue and Forecast, by Growing Mechanism (2021-2033)
12.1.4. Market Revenue and Forecast, by Application (2021-2033)
12.1.5. U.S.
12.1.5.1. Market Revenue and Forecast, by Structure (2021-2033)
12.1.5.2. Market Revenue and Forecast, by Component (2021-2033)
12.1.5.3. Market Revenue and Forecast, by Growing Mechanism (2021-2033)
12.1.5.4. Market Revenue and Forecast, by Application (2021-2033)
12.1.6. Rest of North America
12.1.6.1. Market Revenue and Forecast, by Structure (2021-2033)
12.1.6.2. Market Revenue and Forecast, by Component (2021-2033)
12.1.6.3. Market Revenue and Forecast, by Growing Mechanism (2021-2033)
12.1.6.4. Market Revenue and Forecast, by Application (2021-2033)
12.2. Europe
12.2.1. Market Revenue and Forecast, by Structure (2021-2033)
12.2.2. Market Revenue and Forecast, by Component (2021-2033)
12.2.3. Market Revenue and Forecast, by Growing Mechanism (2021-2033)
12.2.4. Market Revenue and Forecast, by Application (2021-2033)
12.2.5. UK
12.2.5.1. Market Revenue and Forecast, by Structure (2021-2033)
12.2.5.2. Market Revenue and Forecast, by Component (2021-2033)
12.2.5.3. Market Revenue and Forecast, by Growing Mechanism (2021-2033)
12.2.5.4. Market Revenue and Forecast, by Application (2021-2033)
12.2.6. Germany
12.2.6.1. Market Revenue and Forecast, by Structure (2021-2033)
12.2.6.2. Market Revenue and Forecast, by Component (2021-2033)
12.2.6.3. Market Revenue and Forecast, by Growing Mechanism (2021-2033)
12.2.6.4. Market Revenue and Forecast, by Application (2021-2033)
12.2.7. France
12.2.7.1. Market Revenue and Forecast, by Structure (2021-2033)
12.2.7.2. Market Revenue and Forecast, by Component (2021-2033)
12.2.7.3. Market Revenue and Forecast, by Growing Mechanism (2021-2033)
12.2.7.4. Market Revenue and Forecast, by Application (2021-2033)
12.2.8. Rest of Europe
12.2.8.1. Market Revenue and Forecast, by Structure (2021-2033)
12.2.8.2. Market Revenue and Forecast, by Component (2021-2033)
12.2.8.3. Market Revenue and Forecast, by Growing Mechanism (2021-2033)
12.2.8.4. Market Revenue and Forecast, by Application (2021-2033)
12.3. APAC
12.3.1. Market Revenue and Forecast, by Structure (2021-2033)
12.3.2. Market Revenue and Forecast, by Component (2021-2033)
12.3.3. Market Revenue and Forecast, by Growing Mechanism (2021-2033)
12.3.4. Market Revenue and Forecast, by Application (2021-2033)
12.3.5. India
12.3.5.1. Market Revenue and Forecast, by Structure (2021-2033)
12.3.5.2. Market Revenue and Forecast, by Component (2021-2033)
12.3.5.3. Market Revenue and Forecast, by Growing Mechanism (2021-2033)
12.3.5.4. Market Revenue and Forecast, by Application (2021-2033)
12.3.6. China
12.3.6.1. Market Revenue and Forecast, by Structure (2021-2033)
12.3.6.2. Market Revenue and Forecast, by Component (2021-2033)
12.3.6.3. Market Revenue and Forecast, by Growing Mechanism (2021-2033)
12.3.6.4. Market Revenue and Forecast, by Application (2021-2033)
12.3.7. Japan
12.3.7.1. Market Revenue and Forecast, by Structure (2021-2033)
12.3.7.2. Market Revenue and Forecast, by Component (2021-2033)
12.3.7.3. Market Revenue and Forecast, by Growing Mechanism (2021-2033)
12.3.7.4. Market Revenue and Forecast, by Application (2021-2033)
12.3.8. Rest of APAC
12.3.8.1. Market Revenue and Forecast, by Structure (2021-2033)
12.3.8.2. Market Revenue and Forecast, by Component (2021-2033)
12.3.8.3. Market Revenue and Forecast, by Growing Mechanism (2021-2033)
12.3.8.4. Market Revenue and Forecast, by Application (2021-2033)
12.4. MEA
12.4.1. Market Revenue and Forecast, by Structure (2021-2033)
12.4.2. Market Revenue and Forecast, by Component (2021-2033)
12.4.3. Market Revenue and Forecast, by Growing Mechanism (2021-2033)
12.4.4. Market Revenue and Forecast, by Application (2021-2033)
12.4.5. GCC
12.4.5.1. Market Revenue and Forecast, by Structure (2021-2033)
12.4.5.2. Market Revenue and Forecast, by Component (2021-2033)
12.4.5.3. Market Revenue and Forecast, by Growing Mechanism (2021-2033)
12.4.5.4. Market Revenue and Forecast, by Application (2021-2033)
12.4.6. North Africa
12.4.6.1. Market Revenue and Forecast, by Structure (2021-2033)
12.4.6.2. Market Revenue and Forecast, by Component (2021-2033)
12.4.6.3. Market Revenue and Forecast, by Growing Mechanism (2021-2033)
12.4.6.4. Market Revenue and Forecast, by Application (2021-2033)
12.4.7. South Africa
12.4.7.1. Market Revenue and Forecast, by Structure (2021-2033)
12.4.7.2. Market Revenue and Forecast, by Component (2021-2033)
12.4.7.3. Market Revenue and Forecast, by Growing Mechanism (2021-2033)
12.4.7.4. Market Revenue and Forecast, by Application (2021-2033)
12.4.8. Rest of MEA
12.4.8.1. Market Revenue and Forecast, by Structure (2021-2033)
12.4.8.2. Market Revenue and Forecast, by Component (2021-2033)
12.4.8.3. Market Revenue and Forecast, by Growing Mechanism (2021-2033)
12.4.8.4. Market Revenue and Forecast, by Application (2021-2033)
12.5. Latin America
12.5.1. Market Revenue and Forecast, by Structure (2021-2033)
12.5.2. Market Revenue and Forecast, by Component (2021-2033)
12.5.3. Market Revenue and Forecast, by Growing Mechanism (2021-2033)
12.5.4. Market Revenue and Forecast, by Application (2021-2033)
12.5.5. Brazil
12.5.5.1. Market Revenue and Forecast, by Structure (2021-2033)
12.5.5.2. Market Revenue and Forecast, by Component (2021-2033)
12.5.5.3. Market Revenue and Forecast, by Growing Mechanism (2021-2033)
12.5.5.4. Market Revenue and Forecast, by Application (2021-2033)
12.5.6. Rest of LATAM
12.5.6.1. Market Revenue and Forecast, by Structure (2021-2033)
12.5.6.2. Market Revenue and Forecast, by Component (2021-2033)
12.5.6.3. Market Revenue and Forecast, by Growing Mechanism (2021-2033)
12.5.6.4. Market Revenue and Forecast, by Application (2021-2033)
Chapter 13. Company Profiles
13.1. Village Farms International, Inc.
13.1.1. Company Overview
13.1.2. Product Offerings
13.1.3. Financial Performance
13.1.4. Recent Initiatives
13.2. Growers Supply Co. BC
13.2.1. Company Overview
13.2.2. Product Offerings
13.2.3. Financial Performance
13.2.4. Recent Initiatives
13.3. Green Living Technologies
13.3.1. Company Overview
13.3.2. Product Offerings
13.3.3. Financial Performance
13.3.4. Recent Initiatives
13.4. Bosmann Val Zaal
13.4.1. Company Overview
13.4.2. Product Offerings
13.4.3. Financial Performance
13.4.4. Recent Initiatives
13.5. Agrify Corporation
13.5.1. Company Overview
13.5.2. Product Offerings
13.5.3. Financial Performance
13.5.4. Recent Initiatives
13.6. STX Inc.
13.6.1. Company Overview
13.6.2. Product Offerings
13.6.3. Financial Performance
13.6.4. Recent Initiatives
13.7. Urban Crop Solutions
13.7.1. Company Overview
13.7.2. Product Offerings
13.7.3. Financial Performance
13.7.4. Recent Initiatives
13.8. Fluence
13.8.1. Company Overview
13.8.2. Product Offerings
13.8.3. Financial Performance
13.8.4. Recent Initiatives
13.9. AEssense Corporation.
13.9.1. Company Overview
13.9.2. Product Offerings
13.9.3. Financial Performance
13.9.4. Recent Initiatives
13.10. Heliospectra
13.10.1. Company Overview
13.10.2. Product Offerings
13.10.3. Financial Performance
13.10.4. Recent Initiatives
Chapter 14. Research Methodology
14.1. Primary Research
14.2. Secondary Research
14.3. Assumptions
Chapter 15. Appendix
15.1. About Us
15.2. Glossary of Terms
 Cross-segment Market Size and Analysis for
Mentioned Segments
 Additional Company Profiles (Upto 5 With No Cost)
 Additional Countries (Apart From Mentioned Countries)
 Country/Region-specific Report
 Go To Market Strategy
 Region Specific Market Dynamics
 Region Level Market Share
 Import Export Analysis
 Production Analysis
 Others