Cardiovascular Digital Solutions Market Size, Share | Report 2023-2032
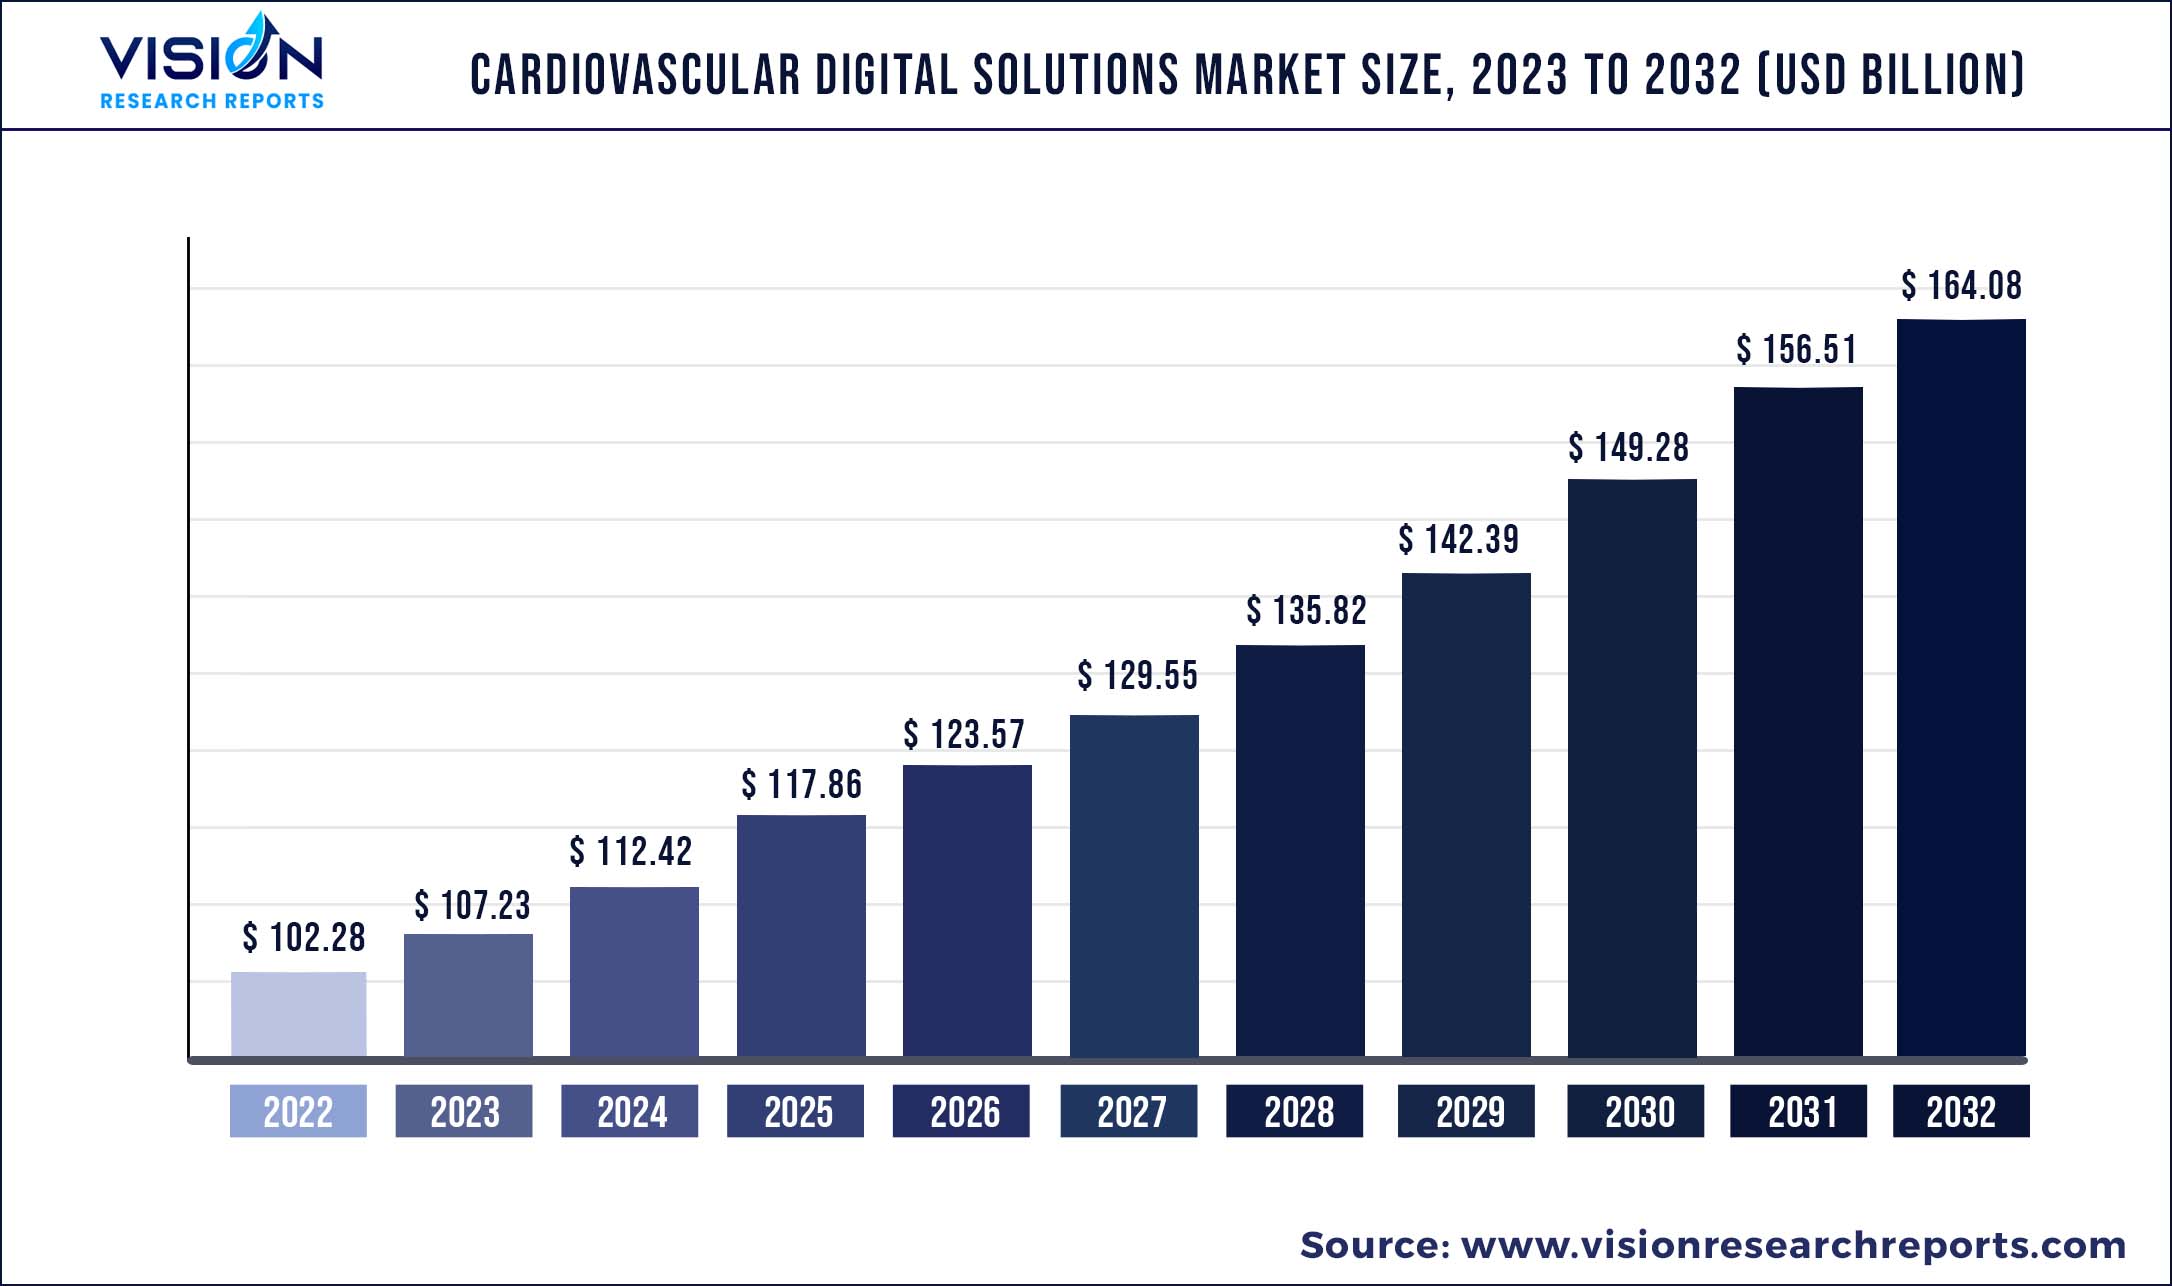
The global cardiovascular digital solutions market was estimated at USD 102.28 billion in 2022 and it is expected to surpass around USD 164.08 billion by 2032, poised to grow at a CAGR of 4.84% from 2023 to 2032.
Key Pointers
Report Scope of the Cardiovascular Digital Solutions Market
| Report Coverage | Details |
| Market Size in 2022 | USD 102.28 billion |
| Revenue Forecast by 2032 | USD 164.08 billion |
| Growth rate from 2023 to 2032 | CAGR of 4.84% |
| Base Year | 2022 |
| Forecast Period | 2023 to 2032 |
| Regions Covered | North America, Europe, Asia Pacific, Latin America, Middle East & Africa |
| Companies Covered | iRythm Technologies, Inc.; Apple Inc.; GENERAL ELECTRIC COMPANY; Uber Diagnostics; AlivCor, Inc.; Verily Life Sciences LLC; HeartFlow; Inc.; Bardy Diagnostics, Inc.; Bio Telemetry; Inc.; Koninklijke Philips N.V.; eviCore healthcare |
Cardiovascular diseases are the most common cause of mortality and morbidity and require a detailed multi-parameter evaluation beyond the ECG. Digital solutions are important for monitoring patients, early detection, and intervention of cardiac conditions to make cardiac care more tailored and efficient. The increase in the prevalence of cardiovascular diseases globally and the rapid advancement in healthcare technology worldwide are some of the major factors driving the growth of the cardiovascular digital solutions market.
The COVID-19 pandemic caused a mild decline in the cardiovascular digital solutions market. The COVID-19 pandemic brought a global crisis for the major world economies, specifically the healthcare industry. Key players in the market continued to alter their plans in response to the constantly shifting circumstances. However, different countries and key players in the market had undertaken critical healthcare modifications until the emergency takes a back seat.
Regional Insights
North America dominated the market and accounted for the largest revenue share of 40.22% in 2022. This is owing to the rapid technological advancements in the medical sector and the highly developed health infrastructure of the region. In addition, the rise in the prevalence of cardiovascular conditions is further increasing the growth of the market. As per the article published by Future Science Group on “As per the article published by Future Science Group, an estimated 3.6 million heart failure hospitalizations and 7.6 million diagnosed prevalent chronic heart failure (CHF) cases were witnessed in North America in 2020.
The Asia Pacific cardiovascular digital solutions market is anticipated to witness rapid growth in the forecast period with a CAGR of 5.3%. The increase in the geriatric population and the development of cardiac health management technology in Asian countries are driving the growth of the regional market. As per the article published by JACC journals on "Epidemiological Features of Cardiovascular Disease in Asia" cardiovascular disease (CVD) continues to be the leading cause of death and premature death worldwide. Around 58% of the 18.6 million CVD fatalities that occurred globally in 2019 were in Asia. As the nation with the highest population density and the widest diversity of cultures, ethnicities, socioeconomic status, and health care systems, Asia Pacific faces numerous challenges in cardiovascular disease prevention and treatment.
Cardiovascular Digital Solutions Market Segmentations:
| By Service Type | By Components | By Deployment | By End-use |
|
Unobtrusive Testing CVD Health Informatics Cardiac Rehab Programs Others |
Devices Software |
Cloud-Based On-premise |
Hospitals & Clinics Ambulatory care centers Others |
Chapter 1. Introduction
1.1. Research Objective
1.2. Scope of the Study
1.3. Definition
Chapter 2. Research Methodology
2.1. Research Approach
2.2. Data Sources
2.3. Assumptions & Limitations
Chapter 3. Executive Summary
3.1. Market Snapshot
Chapter 4. Market Variables and Scope
4.1. Introduction
4.2. Market Classification and Scope
4.3. Industry Value Chain Analysis
4.3.1. Raw Material Procurement Analysis
4.3.2. Sales and Distribution Channel Analysis
4.3.3. Downstream Buyer Analysis
Chapter 5. COVID 19 Impact on Cardiovascular Digital Solutions Market
5.1. COVID-19 Landscape: Cardiovascular Digital Solutions Industry Impact
5.2. COVID 19 - Impact Assessment for the Industry
5.3. COVID 19 Impact: Global Major Government Policy
5.4. Market Trends and Opportunities in the COVID-19 Landscape
Chapter 6. Market Dynamics Analysis and Trends
6.1. Market Dynamics
6.1.1. Market Drivers
6.1.2. Market Restraints
6.1.3. Market Opportunities
6.2. Porter’s Five Forces Analysis
6.2.1. Bargaining power of suppliers
6.2.2. Bargaining power of buyers
6.2.3. Threat of substitute
6.2.4. Threat of new entrants
6.2.5. Degree of competition
Chapter 7. Competitive Landscape
7.1.1. Company Market Share/Positioning Analysis
7.1.2. Key Strategies Adopted by Players
7.1.3. Vendor Landscape
7.1.3.1. List of Suppliers
7.1.3.2. List of Buyers
Chapter 8. Global Cardiovascular Digital Solutions Market, By Service Type
8.1. Cardiovascular Digital Solutions Market, by Service Type, 2023-2032
8.1.1. Unobtrusive Testing
8.1.1.1. Market Revenue and Forecast (2020-2032)
8.1.2. CVD Health Informatics
8.1.2.1. Market Revenue and Forecast (2020-2032)
8.1.3. Cardiac Rehab Programs
8.1.3.1. Market Revenue and Forecast (2020-2032)
8.1.4. Others
8.1.4.1. Market Revenue and Forecast (2020-2032)
Chapter 9. Global Cardiovascular Digital Solutions Market, By Components
9.1. Cardiovascular Digital Solutions Market, by Components, 2023-2032
9.1.1. Devices
9.1.1.1. Market Revenue and Forecast (2020-2032)
9.1.2. Software
9.1.2.1. Market Revenue and Forecast (2020-2032)
Chapter 10. Global Cardiovascular Digital Solutions Market, By Deployment
10.1. Cardiovascular Digital Solutions Market, by Deployment, 2023-2032
10.1.1. Cloud-Based
10.1.1.1. Market Revenue and Forecast (2020-2032)
10.1.2. On-premise
10.1.2.1. Market Revenue and Forecast (2020-2032)
Chapter 11. Global Cardiovascular Digital Solutions Market, By End-use
11.1. Cardiovascular Digital Solutions Market, by End-use, 2023-2032
11.1.1. Hospitals & Clinics
11.1.1.1. Market Revenue and Forecast (2020-2032)
11.1.2. Ambulatory care centers
11.1.2.1. Market Revenue and Forecast (2020-2032)
11.1.3. Others
11.1.3.1. Market Revenue and Forecast (2020-2032)
Chapter 12. Global Cardiovascular Digital Solutions Market, Regional Estimates and Trend Forecast
12.1. North America
12.1.1. Market Revenue and Forecast, by Service Type (2020-2032)
12.1.2. Market Revenue and Forecast, by Components (2020-2032)
12.1.3. Market Revenue and Forecast, by Deployment (2020-2032)
12.1.4. Market Revenue and Forecast, by End-use (2020-2032)
12.1.5. U.S.
12.1.5.1. Market Revenue and Forecast, by Service Type (2020-2032)
12.1.5.2. Market Revenue and Forecast, by Components (2020-2032)
12.1.5.3. Market Revenue and Forecast, by Deployment (2020-2032)
12.1.5.4. Market Revenue and Forecast, by End-use (2020-2032)
12.1.6. Rest of North America
12.1.6.1. Market Revenue and Forecast, by Service Type (2020-2032)
12.1.6.2. Market Revenue and Forecast, by Components (2020-2032)
12.1.6.3. Market Revenue and Forecast, by Deployment (2020-2032)
12.1.6.4. Market Revenue and Forecast, by End-use (2020-2032)
12.2. Europe
12.2.1. Market Revenue and Forecast, by Service Type (2020-2032)
12.2.2. Market Revenue and Forecast, by Components (2020-2032)
12.2.3. Market Revenue and Forecast, by Deployment (2020-2032)
12.2.4. Market Revenue and Forecast, by End-use (2020-2032)
12.2.5. UK
12.2.5.1. Market Revenue and Forecast, by Service Type (2020-2032)
12.2.5.2. Market Revenue and Forecast, by Components (2020-2032)
12.2.5.3. Market Revenue and Forecast, by Deployment (2020-2032)
12.2.5.4. Market Revenue and Forecast, by End-use (2020-2032)
12.2.6. Germany
12.2.6.1. Market Revenue and Forecast, by Service Type (2020-2032)
12.2.6.2. Market Revenue and Forecast, by Components (2020-2032)
12.2.6.3. Market Revenue and Forecast, by Deployment (2020-2032)
12.2.6.4. Market Revenue and Forecast, by End-use (2020-2032)
12.2.7. France
12.2.7.1. Market Revenue and Forecast, by Service Type (2020-2032)
12.2.7.2. Market Revenue and Forecast, by Components (2020-2032)
12.2.7.3. Market Revenue and Forecast, by Deployment (2020-2032)
12.2.7.4. Market Revenue and Forecast, by End-use (2020-2032)
12.2.8. Rest of Europe
12.2.8.1. Market Revenue and Forecast, by Service Type (2020-2032)
12.2.8.2. Market Revenue and Forecast, by Components (2020-2032)
12.2.8.3. Market Revenue and Forecast, by Deployment (2020-2032)
12.2.8.4. Market Revenue and Forecast, by End-use (2020-2032)
12.3. APAC
12.3.1. Market Revenue and Forecast, by Service Type (2020-2032)
12.3.2. Market Revenue and Forecast, by Components (2020-2032)
12.3.3. Market Revenue and Forecast, by Deployment (2020-2032)
12.3.4. Market Revenue and Forecast, by End-use (2020-2032)
12.3.5. India
12.3.5.1. Market Revenue and Forecast, by Service Type (2020-2032)
12.3.5.2. Market Revenue and Forecast, by Components (2020-2032)
12.3.5.3. Market Revenue and Forecast, by Deployment (2020-2032)
12.3.5.4. Market Revenue and Forecast, by End-use (2020-2032)
12.3.6. China
12.3.6.1. Market Revenue and Forecast, by Service Type (2020-2032)
12.3.6.2. Market Revenue and Forecast, by Components (2020-2032)
12.3.6.3. Market Revenue and Forecast, by Deployment (2020-2032)
12.3.6.4. Market Revenue and Forecast, by End-use (2020-2032)
12.3.7. Japan
12.3.7.1. Market Revenue and Forecast, by Service Type (2020-2032)
12.3.7.2. Market Revenue and Forecast, by Components (2020-2032)
12.3.7.3. Market Revenue and Forecast, by Deployment (2020-2032)
12.3.7.4. Market Revenue and Forecast, by End-use (2020-2032)
12.3.8. Rest of APAC
12.3.8.1. Market Revenue and Forecast, by Service Type (2020-2032)
12.3.8.2. Market Revenue and Forecast, by Components (2020-2032)
12.3.8.3. Market Revenue and Forecast, by Deployment (2020-2032)
12.3.8.4. Market Revenue and Forecast, by End-use (2020-2032)
12.4. MEA
12.4.1. Market Revenue and Forecast, by Service Type (2020-2032)
12.4.2. Market Revenue and Forecast, by Components (2020-2032)
12.4.3. Market Revenue and Forecast, by Deployment (2020-2032)
12.4.4. Market Revenue and Forecast, by End-use (2020-2032)
12.4.5. GCC
12.4.5.1. Market Revenue and Forecast, by Service Type (2020-2032)
12.4.5.2. Market Revenue and Forecast, by Components (2020-2032)
12.4.5.3. Market Revenue and Forecast, by Deployment (2020-2032)
12.4.5.4. Market Revenue and Forecast, by End-use (2020-2032)
12.4.6. North Africa
12.4.6.1. Market Revenue and Forecast, by Service Type (2020-2032)
12.4.6.2. Market Revenue and Forecast, by Components (2020-2032)
12.4.6.3. Market Revenue and Forecast, by Deployment (2020-2032)
12.4.6.4. Market Revenue and Forecast, by End-use (2020-2032)
12.4.7. South Africa
12.4.7.1. Market Revenue and Forecast, by Service Type (2020-2032)
12.4.7.2. Market Revenue and Forecast, by Components (2020-2032)
12.4.7.3. Market Revenue and Forecast, by Deployment (2020-2032)
12.4.7.4. Market Revenue and Forecast, by End-use (2020-2032)
12.4.8. Rest of MEA
12.4.8.1. Market Revenue and Forecast, by Service Type (2020-2032)
12.4.8.2. Market Revenue and Forecast, by Components (2020-2032)
12.4.8.3. Market Revenue and Forecast, by Deployment (2020-2032)
12.4.8.4. Market Revenue and Forecast, by End-use (2020-2032)
12.5. Latin America
12.5.1. Market Revenue and Forecast, by Service Type (2020-2032)
12.5.2. Market Revenue and Forecast, by Components (2020-2032)
12.5.3. Market Revenue and Forecast, by Deployment (2020-2032)
12.5.4. Market Revenue and Forecast, by End-use (2020-2032)
12.5.5. Brazil
12.5.5.1. Market Revenue and Forecast, by Service Type (2020-2032)
12.5.5.2. Market Revenue and Forecast, by Components (2020-2032)
12.5.5.3. Market Revenue and Forecast, by Deployment (2020-2032)
12.5.5.4. Market Revenue and Forecast, by End-use (2020-2032)
12.5.6. Rest of LATAM
12.5.6.1. Market Revenue and Forecast, by Service Type (2020-2032)
12.5.6.2. Market Revenue and Forecast, by Components (2020-2032)
12.5.6.3. Market Revenue and Forecast, by Deployment (2020-2032)
12.5.6.4. Market Revenue and Forecast, by End-use (2020-2032)
Chapter 13. Company Profiles
13.1. iRythm Technologies, Inc.
13.1.1. Company Overview
13.1.2. Product Offerings
13.1.3. Financial Performance
13.1.4. Recent Initiatives
13.2. Apple Inc.
13.2.1. Company Overview
13.2.2. Product Offerings
13.2.3. Financial Performance
13.2.4. Recent Initiatives
13.3. GENERAL ELECTRIC COMPANY
13.3.1. Company Overview
13.3.2. Product Offerings
13.3.3. Financial Performance
13.3.4. Recent Initiatives
13.4. Uber Diagnostics
13.4.1. Company Overview
13.4.2. Product Offerings
13.4.3. Financial Performance
13.4.4. Recent Initiatives
13.5. AlivCor, Inc.
13.5.1. Company Overview
13.5.2. Product Offerings
13.5.3. Financial Performance
13.5.4. Recent Initiatives
13.6. Verily Life Sciences LLC
13.6.1. Company Overview
13.6.2. Product Offerings
13.6.3. Financial Performance
13.6.4. Recent Initiatives
13.7. HeartFlow, Inc.
13.7.1. Company Overview
13.7.2. Product Offerings
13.7.3. Financial Performance
13.7.4. Recent Initiatives
13.8. Bardy Diagnostics, Inc.
13.8.1. Company Overview
13.8.2. Product Offerings
13.8.3. Financial Performance
13.8.4. Recent Initiatives
13.9. Bio Telemetry, Inc.
13.9.1. Company Overview
13.9.2. Product Offerings
13.9.3. Financial Performance
13.9.4. Recent Initiatives
13.10. Koninkelijke Philips N.V.
13.10.1. Company Overview
13.10.2. Product Offerings
13.10.3. Financial Performance
13.10.4. Recent Initiatives
Chapter 14. Research Methodology
14.1. Primary Research
14.2. Secondary Research
14.3. Assumptions
Chapter 15. Appendix
15.1. About Us
15.2. Glossary of Terms
 Cross-segment Market Size and Analysis for
Mentioned Segments
Additional Company Profiles (Upto 5 With No Cost)
Additional Countries (Apart From Mentioned Countries)
Country/Region-specific Report
Go To Market Strategy
Region Specific Market DynamicsRegion Level Market Share Import Export AnalysisProduction AnalysisOthers
Cross-segment Market Size and Analysis for
Mentioned Segments
Additional Company Profiles (Upto 5 With No Cost)
Additional Countries (Apart From Mentioned Countries)
Country/Region-specific Report
Go To Market Strategy
Region Specific Market DynamicsRegion Level Market Share Import Export AnalysisProduction AnalysisOthers