Carrier Aggregation Solutions Market Size, Share | Report 2023-2032
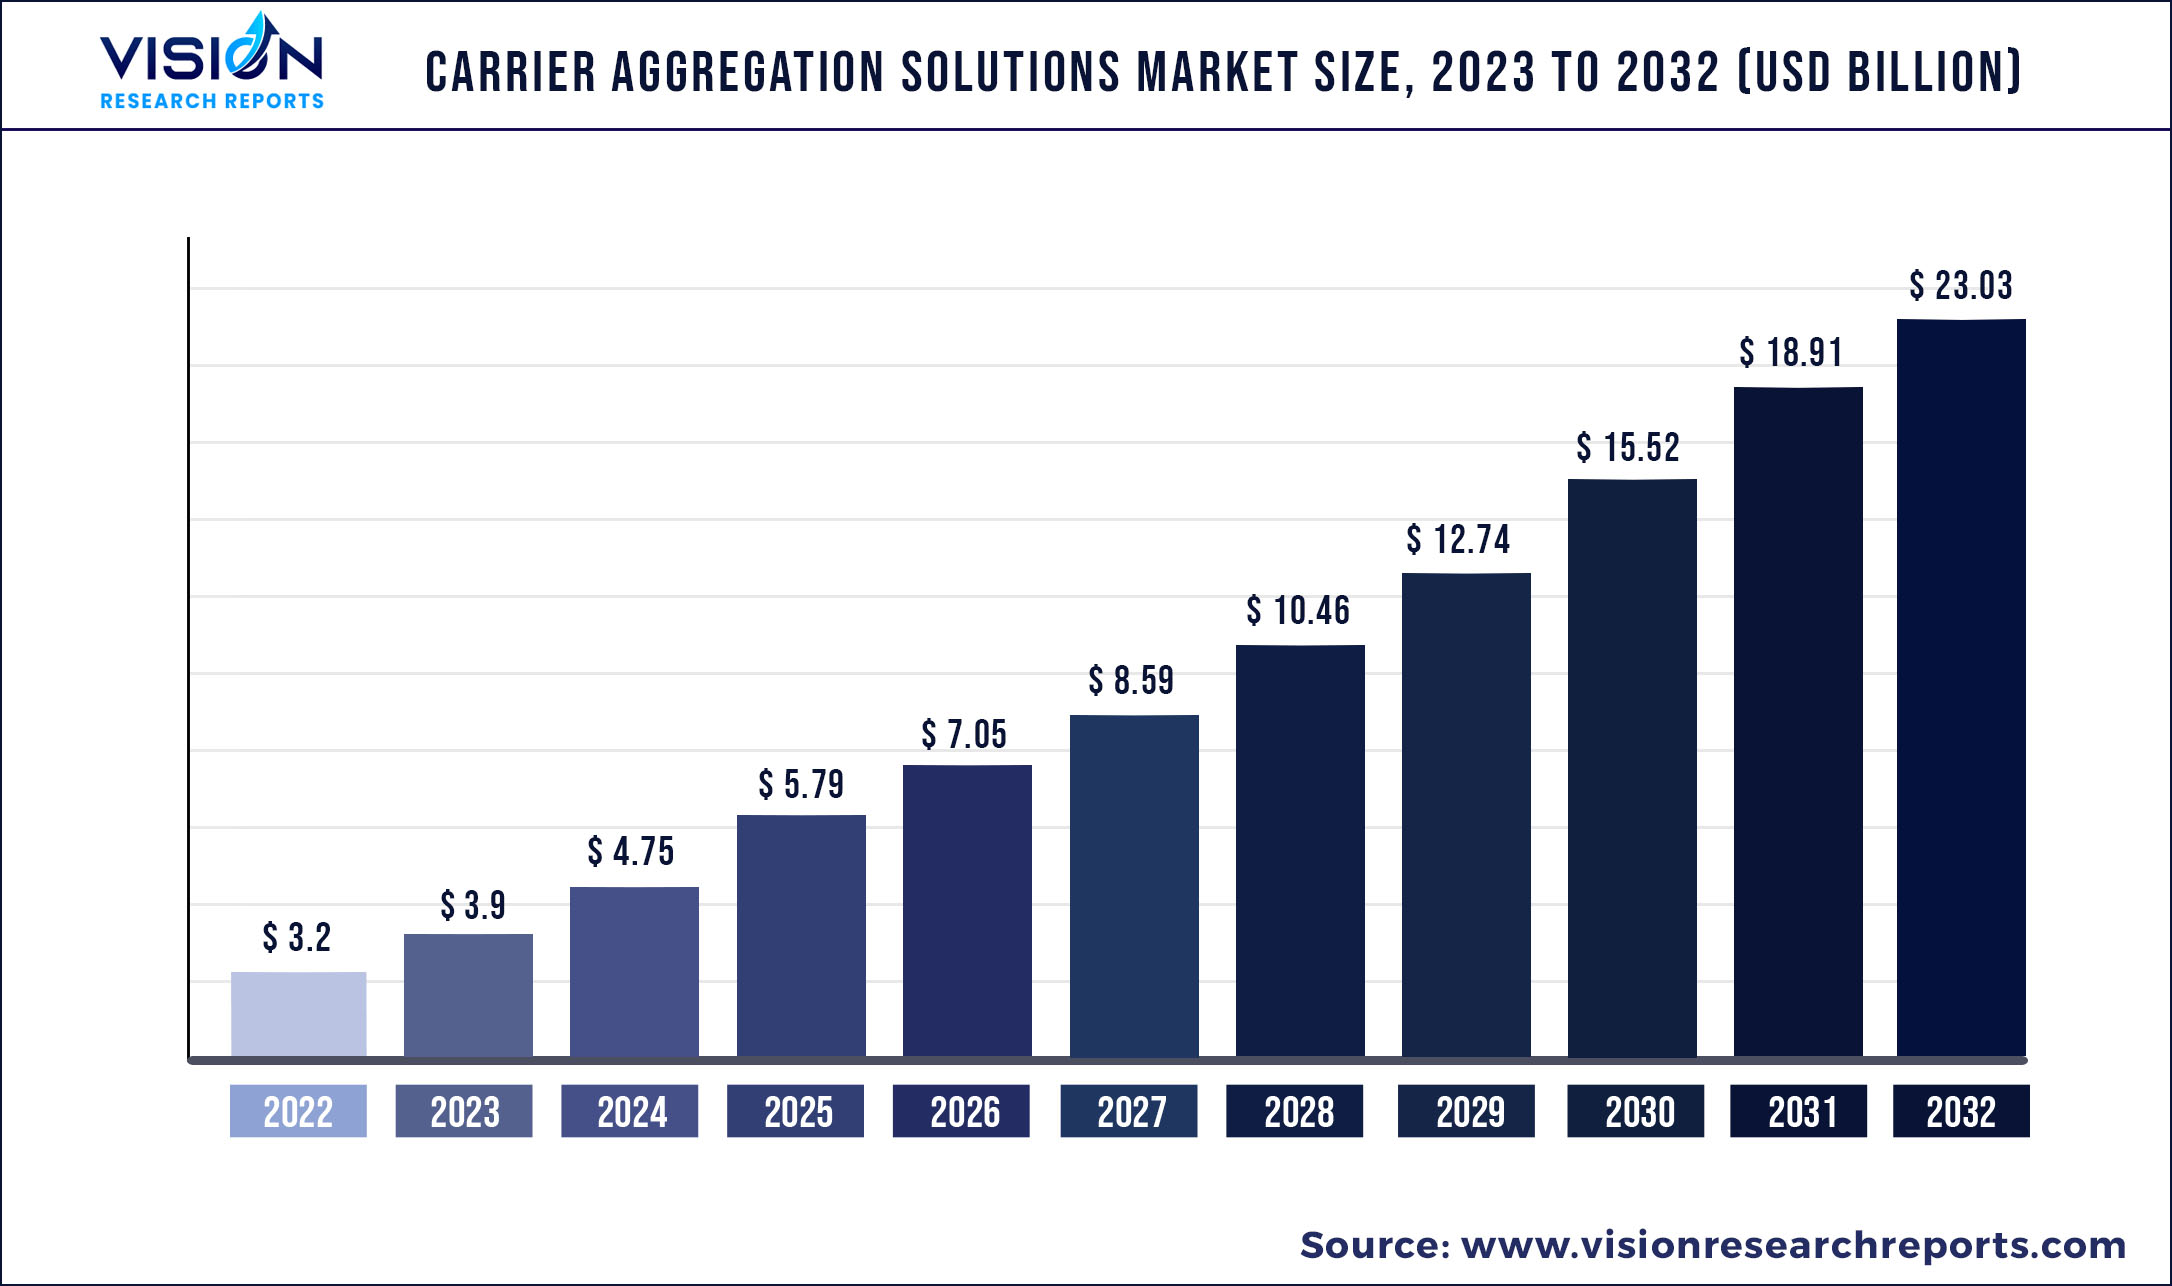
The global carrier aggregation solutions market was valued at USD 3.2 billion in 2022 and it is predicted to surpass around USD 23.03 billion by 2032 with a CAGR of 21.82% from 2023 to 2032.
Key Pointers
Report Scope of the Carrier Aggregation Solutions Market
| Report Coverage | Details |
| Market Size in 2022 | USD 3.2 billion |
| Revenue Forecast by 2032 | USD 23.03 billion |
| Growth rate from 2023 to 2032 | CAGR of 21.82% |
| Base Year | 2022 |
| Forecast Period | 2023 to 2032 |
| Regions Covered | North America, Europe, Asia Pacific, Latin America, Middle East & Africa |
| Companies Covered | Anritsu; Artiza Networks, Inc.; Cisco Systems Inc.; Huawei Technologies; Nokia Corporation; Qualcomm Technologies, Inc.; Rohde and Schwarz GmbH and Co. KG; Sprint.com; Telefonaktiebolaget LM Ericsson; ZTE Corporation; Broadcom Inc.; Verizon Communications Inc.; Qorvo Inc. |
Rising global mobile traffic, the need for faster data speed, and increased focus on research and development activities by government and private research organizations are some of the factors expected to fuel the growth of the market during the forecast period.
Carrier aggregation solutions enable mobile network operators (MNOs) to combine two or more data carriers with the same or different frequency bands within a single channel to transfer data between base stations and a mobile device. Carrier aggregation solutions enhance data capacity, spectrum efficiency, and backward compatibility. These solutions have also increased cell coverage by aggregating numerous frequency bands for higher rates.
It also allows MNOs to pool their spectrum resources together within the same/different band to achieve higher capacity and peak rates. The industry is expanding at a tremendous growth rate owing to technological innovations, coupled with users’ inclination toward faster data speed.
Carrier aggregation solutions are software functionality in the user device and radio access network (RAN). They allow MNOs to combine the capabilities of radio cells to enhance network efficiency and user experience. Mobile network operators are introducing carrier aggregation 5G standalone with an extremely efficient 5G air interface and 5G core, eliminating the dependency on existing long-term evolution (LTE) networks to provide reliable, efficient, and ultra-low latency capabilities of 5G.
The ongoing rollout of commercial 5G networks has considerably improved the experience of mobile subscribers globally. Moreover, the increasing number of advanced 5G standalone networks delivering ultra-low latency and boosting the performance of homogenous and heterogenous networks has remarkably marked the evolution of wireless infrastructure.
The industry has significantly evolved across the U.S. and Asian countries owing to the accessibility of emerging 5G services, the rollout of commercial 5G deployment networks, technological breakthroughs, and carrier aggregation solutions. The carrier aggregation solutions market is consolidated, with a large number of players dominating and capturing a significant share of the overall market. These companies have invested an enormous amount, as the industry is anticipated to grow exponentially in the near future.
The outbreak of the COVID-19 pandemic positively affected the networks and digital infrastructure. The emerging concept of online connectivity and remote access by working professionals and for education increased the demand for large data capacity to maintain network resilience, raising the demand for carrier aggregation solutions. The need for high-speed internet spurred during the pandemic, and the pandemic led to a prompt shift of network traffic within the business & residential areas.
Additionally, the growing deployment of 5G network services in developing economies and existing LTE data services are boosting the high-speed network capacity requirements. Furthermore, the rising emphasis on the deployment of 5G worldwide is booming the request for carrier aggregation solutions, propelling the market in the forecast period.
Carrier Aggregation Solutions Market Segmentations:
| By Deployment | By Frequency Band | By Cell Type | By Spectrum Band | By Application |
|
4G/LTE 5G |
Low-band Mid-band High-band |
Picocells Microcells Femtocells |
Licensed Non-licensed |
Mobile Broadband Connectivity Smart City Industrial IoT Maritime Communications Satellite Communication Others |
Chapter 1. Introduction
1.1. Research Objective
1.2. Scope of the Study
1.3. Definition
Chapter 2. Research Methodology
2.1. Research Approach
2.2. Data Sources
2.3. Assumptions & Limitations
Chapter 3. Executive Summary
3.1. Market Snapshot
Chapter 4. Market Variables and Scope
4.1. Introduction
4.2. Market Classification and Scope
4.3. Industry Value Chain Analysis
4.3.1. Raw Material Procurement Analysis
4.3.2. Sales and Distribution Channel Analysis
4.3.3. Downstream Buyer Analysis
Chapter 5. COVID 19 Impact on Carrier Aggregation Solutions Market
5.1. COVID-19 Landscape: Carrier Aggregation Solutions Industry Impact
5.2. COVID 19 - Impact Assessment for the Industry
5.3. COVID 19 Impact: Global Major Government Policy
5.4. Market Trends and Opportunities in the COVID-19 Landscape
Chapter 6. Market Dynamics Analysis and Trends
6.1. Market Dynamics
6.1.1. Market Drivers
6.1.2. Market Restraints
6.1.3. Market Opportunities
6.2. Porter’s Five Forces Analysis
6.2.1. Bargaining power of suppliers
6.2.2. Bargaining power of buyers
6.2.3. Threat of substitute
6.2.4. Threat of new entrants
6.2.5. Degree of competition
Chapter 7. Competitive Landscape
7.1.1. Company Market Share/Positioning Analysis
7.1.2. Key Strategies Adopted by Players
7.1.3. Vendor Landscape
7.1.3.1. List of Suppliers
7.1.3.2. List of Buyers
Chapter 8. Global Carrier Aggregation Solutions Market, By Deployment
8.1. Carrier Aggregation Solutions Market, by Deployment, 2023-2032
8.1.1. 4G/LTE
8.1.1.1. Market Revenue and Forecast (2020-2032)
8.1.2. 5G
8.1.2.1. Market Revenue and Forecast (2020-2032)
Chapter 9. Global Carrier Aggregation Solutions Market, By Frequency Band
9.1. Carrier Aggregation Solutions Market, by Frequency Band, 2023-2032
9.1.1. Low-band
9.1.1.1. Market Revenue and Forecast (2020-2032)
9.1.2. Mid-band
9.1.2.1. Market Revenue and Forecast (2020-2032)
9.1.3. High-band
9.1.3.1. Market Revenue and Forecast (2020-2032)
Chapter 10. Global Carrier Aggregation Solutions Market, By Cell Type
10.1. Carrier Aggregation Solutions Market, by Cell Type, 2023-2032
10.1.1. Picocells
10.1.1.1. Market Revenue and Forecast (2020-2032)
10.1.2. Microcells
10.1.2.1. Market Revenue and Forecast (2020-2032)
10.1.3. Femtocells
10.1.3.1. Market Revenue and Forecast (2020-2032)
Chapter 11. Global Carrier Aggregation Solutions Market, By Licensed
11.1. Carrier Aggregation Solutions Market, by Spectrum Band, 2023-2032
11.1.1. Licensed
11.1.1.1. Market Revenue and Forecast (2020-2032)
11.1.2. Non-licensed
11.1.2.1. Market Revenue and Forecast (2020-2032)
Chapter 12. Global Carrier Aggregation Solutions Market, By Application
12.1. Carrier Aggregation Solutions Market, by Application, 2023-2032
12.1.1. Mobile Broadband Connectivity
12.1.1.1. Market Revenue and Forecast (2020-2032)
12.1.2. Smart City
12.1.2.1. Market Revenue and Forecast (2020-2032)
12.1.3. Industrial IoT
12.1.3.1. Market Revenue and Forecast (2020-2032)
12.1.4. Maritime Communications
12.1.4.1. Market Revenue and Forecast (2020-2032)
12.1.5. Satellite Communication
12.1.5.1. Market Revenue and Forecast (2020-2032)
12.1.6. Others
12.1.6.1. Market Revenue and Forecast (2020-2032)
Chapter 13. Global Carrier Aggregation Solutions Market, Regional Estimates and Trend Forecast
13.1. North America
13.1.1. Market Revenue and Forecast, by Deployment (2020-2032)
13.1.2. Market Revenue and Forecast, by Frequency Band (2020-2032)
13.1.3. Market Revenue and Forecast, by Cell Type (2020-2032)
13.1.4. Market Revenue and Forecast, by Spectrum Band (2020-2032)
13.1.5. Market Revenue and Forecast, by Application (2020-2032)
13.1.6. U.S.
13.1.6.1. Market Revenue and Forecast, by Deployment (2020-2032)
13.1.6.2. Market Revenue and Forecast, by Frequency Band (2020-2032)
13.1.6.3. Market Revenue and Forecast, by Cell Type (2020-2032)
13.1.6.4. Market Revenue and Forecast, by Spectrum Band (2020-2032)
13.1.7. Market Revenue and Forecast, by Application (2020-2032)
13.1.8. Rest of North America
13.1.8.1. Market Revenue and Forecast, by Deployment (2020-2032)
13.1.8.2. Market Revenue and Forecast, by Frequency Band (2020-2032)
13.1.8.3. Market Revenue and Forecast, by Cell Type (2020-2032)
13.1.8.4. Market Revenue and Forecast, by Spectrum Band (2020-2032)
13.1.8.5. Market Revenue and Forecast, by Application (2020-2032)
13.2. Europe
13.2.1. Market Revenue and Forecast, by Deployment (2020-2032)
13.2.2. Market Revenue and Forecast, by Frequency Band (2020-2032)
13.2.3. Market Revenue and Forecast, by Cell Type (2020-2032)
13.2.4. Market Revenue and Forecast, by Spectrum Band (2020-2032)
13.2.5. Market Revenue and Forecast, by Application (2020-2032)
13.2.6. UK
13.2.6.1. Market Revenue and Forecast, by Deployment (2020-2032)
13.2.6.2. Market Revenue and Forecast, by Frequency Band (2020-2032)
13.2.6.3. Market Revenue and Forecast, by Cell Type (2020-2032)
13.2.7. Market Revenue and Forecast, by Spectrum Band (2020-2032)
13.2.8. Market Revenue and Forecast, by Application (2020-2032)
13.2.9. Germany
13.2.9.1. Market Revenue and Forecast, by Deployment (2020-2032)
13.2.9.2. Market Revenue and Forecast, by Frequency Band (2020-2032)
13.2.9.3. Market Revenue and Forecast, by Cell Type (2020-2032)
13.2.10. Market Revenue and Forecast, by Spectrum Band (2020-2032)
13.2.11. Market Revenue and Forecast, by Application (2020-2032)
13.2.12. France
13.2.12.1. Market Revenue and Forecast, by Deployment (2020-2032)
13.2.12.2. Market Revenue and Forecast, by Frequency Band (2020-2032)
13.2.12.3. Market Revenue and Forecast, by Cell Type (2020-2032)
13.2.12.4. Market Revenue and Forecast, by Spectrum Band (2020-2032)
13.2.13. Market Revenue and Forecast, by Application (2020-2032)
13.2.14. Rest of Europe
13.2.14.1. Market Revenue and Forecast, by Deployment (2020-2032)
13.2.14.2. Market Revenue and Forecast, by Frequency Band (2020-2032)
13.2.14.3. Market Revenue and Forecast, by Cell Type (2020-2032)
13.2.14.4. Market Revenue and Forecast, by Spectrum Band (2020-2032)
13.2.15. Market Revenue and Forecast, by Application (2020-2032)
13.3. APAC
13.3.1. Market Revenue and Forecast, by Deployment (2020-2032)
13.3.2. Market Revenue and Forecast, by Frequency Band (2020-2032)
13.3.3. Market Revenue and Forecast, by Cell Type (2020-2032)
13.3.4. Market Revenue and Forecast, by Spectrum Band (2020-2032)
13.3.5. Market Revenue and Forecast, by Application (2020-2032)
13.3.6. India
13.3.6.1. Market Revenue and Forecast, by Deployment (2020-2032)
13.3.6.2. Market Revenue and Forecast, by Frequency Band (2020-2032)
13.3.6.3. Market Revenue and Forecast, by Cell Type (2020-2032)
13.3.6.4. Market Revenue and Forecast, by Spectrum Band (2020-2032)
13.3.7. Market Revenue and Forecast, by Application (2020-2032)
13.3.8. China
13.3.8.1. Market Revenue and Forecast, by Deployment (2020-2032)
13.3.8.2. Market Revenue and Forecast, by Frequency Band (2020-2032)
13.3.8.3. Market Revenue and Forecast, by Cell Type (2020-2032)
13.3.8.4. Market Revenue and Forecast, by Spectrum Band (2020-2032)
13.3.9. Market Revenue and Forecast, by Application (2020-2032)
13.3.10. Japan
13.3.10.1. Market Revenue and Forecast, by Deployment (2020-2032)
13.3.10.2. Market Revenue and Forecast, by Frequency Band (2020-2032)
13.3.10.3. Market Revenue and Forecast, by Cell Type (2020-2032)
13.3.10.4. Market Revenue and Forecast, by Spectrum Band (2020-2032)
13.3.10.5. Market Revenue and Forecast, by Application (2020-2032)
13.3.11. Rest of APAC
13.3.11.1. Market Revenue and Forecast, by Deployment (2020-2032)
13.3.11.2. Market Revenue and Forecast, by Frequency Band (2020-2032)
13.3.11.3. Market Revenue and Forecast, by Cell Type (2020-2032)
13.3.11.4. Market Revenue and Forecast, by Spectrum Band (2020-2032)
13.3.11.5. Market Revenue and Forecast, by Application (2020-2032)
13.4. MEA
13.4.1. Market Revenue and Forecast, by Deployment (2020-2032)
13.4.2. Market Revenue and Forecast, by Frequency Band (2020-2032)
13.4.3. Market Revenue and Forecast, by Cell Type (2020-2032)
13.4.4. Market Revenue and Forecast, by Spectrum Band (2020-2032)
13.4.5. Market Revenue and Forecast, by Application (2020-2032)
13.4.6. GCC
13.4.6.1. Market Revenue and Forecast, by Deployment (2020-2032)
13.4.6.2. Market Revenue and Forecast, by Frequency Band (2020-2032)
13.4.6.3. Market Revenue and Forecast, by Cell Type (2020-2032)
13.4.6.4. Market Revenue and Forecast, by Spectrum Band (2020-2032)
13.4.7. Market Revenue and Forecast, by Application (2020-2032)
13.4.8. North Africa
13.4.8.1. Market Revenue and Forecast, by Deployment (2020-2032)
13.4.8.2. Market Revenue and Forecast, by Frequency Band (2020-2032)
13.4.8.3. Market Revenue and Forecast, by Cell Type (2020-2032)
13.4.8.4. Market Revenue and Forecast, by Spectrum Band (2020-2032)
13.4.9. Market Revenue and Forecast, by Application (2020-2032)
13.4.10. South Africa
13.4.10.1. Market Revenue and Forecast, by Deployment (2020-2032)
13.4.10.2. Market Revenue and Forecast, by Frequency Band (2020-2032)
13.4.10.3. Market Revenue and Forecast, by Cell Type (2020-2032)
13.4.10.4. Market Revenue and Forecast, by Spectrum Band (2020-2032)
13.4.10.5. Market Revenue and Forecast, by Application (2020-2032)
13.4.11. Rest of MEA
13.4.11.1. Market Revenue and Forecast, by Deployment (2020-2032)
13.4.11.2. Market Revenue and Forecast, by Frequency Band (2020-2032)
13.4.11.3. Market Revenue and Forecast, by Cell Type (2020-2032)
13.4.11.4. Market Revenue and Forecast, by Spectrum Band (2020-2032)
13.4.11.5. Market Revenue and Forecast, by Application (2020-2032)
13.5. Latin America
13.5.1. Market Revenue and Forecast, by Deployment (2020-2032)
13.5.2. Market Revenue and Forecast, by Frequency Band (2020-2032)
13.5.3. Market Revenue and Forecast, by Cell Type (2020-2032)
13.5.4. Market Revenue and Forecast, by Spectrum Band (2020-2032)
13.5.5. Market Revenue and Forecast, by Application (2020-2032)
13.5.6. Brazil
13.5.6.1. Market Revenue and Forecast, by Deployment (2020-2032)
13.5.6.2. Market Revenue and Forecast, by Frequency Band (2020-2032)
13.5.6.3. Market Revenue and Forecast, by Cell Type (2020-2032)
13.5.6.4. Market Revenue and Forecast, by Spectrum Band (2020-2032)
13.5.7. Market Revenue and Forecast, by Application (2020-2032)
13.5.8. Rest of LATAM
13.5.8.1. Market Revenue and Forecast, by Deployment (2020-2032)
13.5.8.2. Market Revenue and Forecast, by Frequency Band (2020-2032)
13.5.8.3. Market Revenue and Forecast, by Cell Type (2020-2032)
13.5.8.4. Market Revenue and Forecast, by Spectrum Band (2020-2032)
13.5.8.5. Market Revenue and Forecast, by Application (2020-2032)
Chapter 14. Company Profiles
14.1. Anritsu
14.1.1. Company Overview
14.1.2. Product Offerings
14.1.3. Financial Performance
14.1.4. Recent Initiatives
14.2. Artiza Networks, Inc.
14.2.1. Company Overview
14.2.2. Product Offerings
14.2.3. Financial Performance
14.2.4. Recent Initiatives
14.3. Cisco Systems Inc.
14.3.1. Company Overview
14.3.2. Product Offerings
14.3.3. Financial Performance
14.3.4. Recent Initiatives
14.4. Huawei Technologies
14.4.1. Company Overview
14.4.2. Product Offerings
14.4.3. Financial Performance
14.4.4. Recent Initiatives
14.5. Nokia Corporation
14.5.1. Company Overview
14.5.2. Product Offerings
14.5.3. Financial Performance
14.5.4. Recent Initiatives
14.6. Qualcomm Technologies, Inc.
14.6.1. Company Overview
14.6.2. Product Offerings
14.6.3. Financial Performance
14.6.4. Recent Initiatives
14.7. Rohde and Schwarz GmbH and Co. KG
14.7.1. Company Overview
14.7.2. Product Offerings
14.7.3. Financial Performance
14.7.4. Recent Initiatives
14.8. Sprint.com
14.8.1. Company Overview
14.8.2. Product Offerings
14.8.3. Financial Performance
14.8.4. Recent Initiatives
14.9. Telefonaktiebolaget LM Ericsson
14.9.1. Company Overview
14.9.2. Product Offerings
14.9.3. Financial Performance
14.9.4. Recent Initiatives
14.10. ZTE Corporation; Broadcom Inc.
14.10.1. Company Overview
14.10.2. Product Offerings
14.10.3. Financial Performance
14.10.4. Recent Initiatives
Chapter 15. Research Methodology
15.1. Primary Research
15.2. Secondary Research
15.3. Assumptions
Chapter 16. Appendix
16.1. About Us
16.2. Glossary of Terms
 Cross-segment Market Size and Analysis for
Mentioned Segments
Additional Company Profiles (Upto 5 With No Cost)
Additional Countries (Apart From Mentioned Countries)
Country/Region-specific Report
Go To Market Strategy
Region Specific Market DynamicsRegion Level Market Share Import Export AnalysisProduction AnalysisOthers
Cross-segment Market Size and Analysis for
Mentioned Segments
Additional Company Profiles (Upto 5 With No Cost)
Additional Countries (Apart From Mentioned Countries)
Country/Region-specific Report
Go To Market Strategy
Region Specific Market DynamicsRegion Level Market Share Import Export AnalysisProduction AnalysisOthers