Clinical Trial Imaging Market Size, Trends, Share, Growth | Report 2023-2032
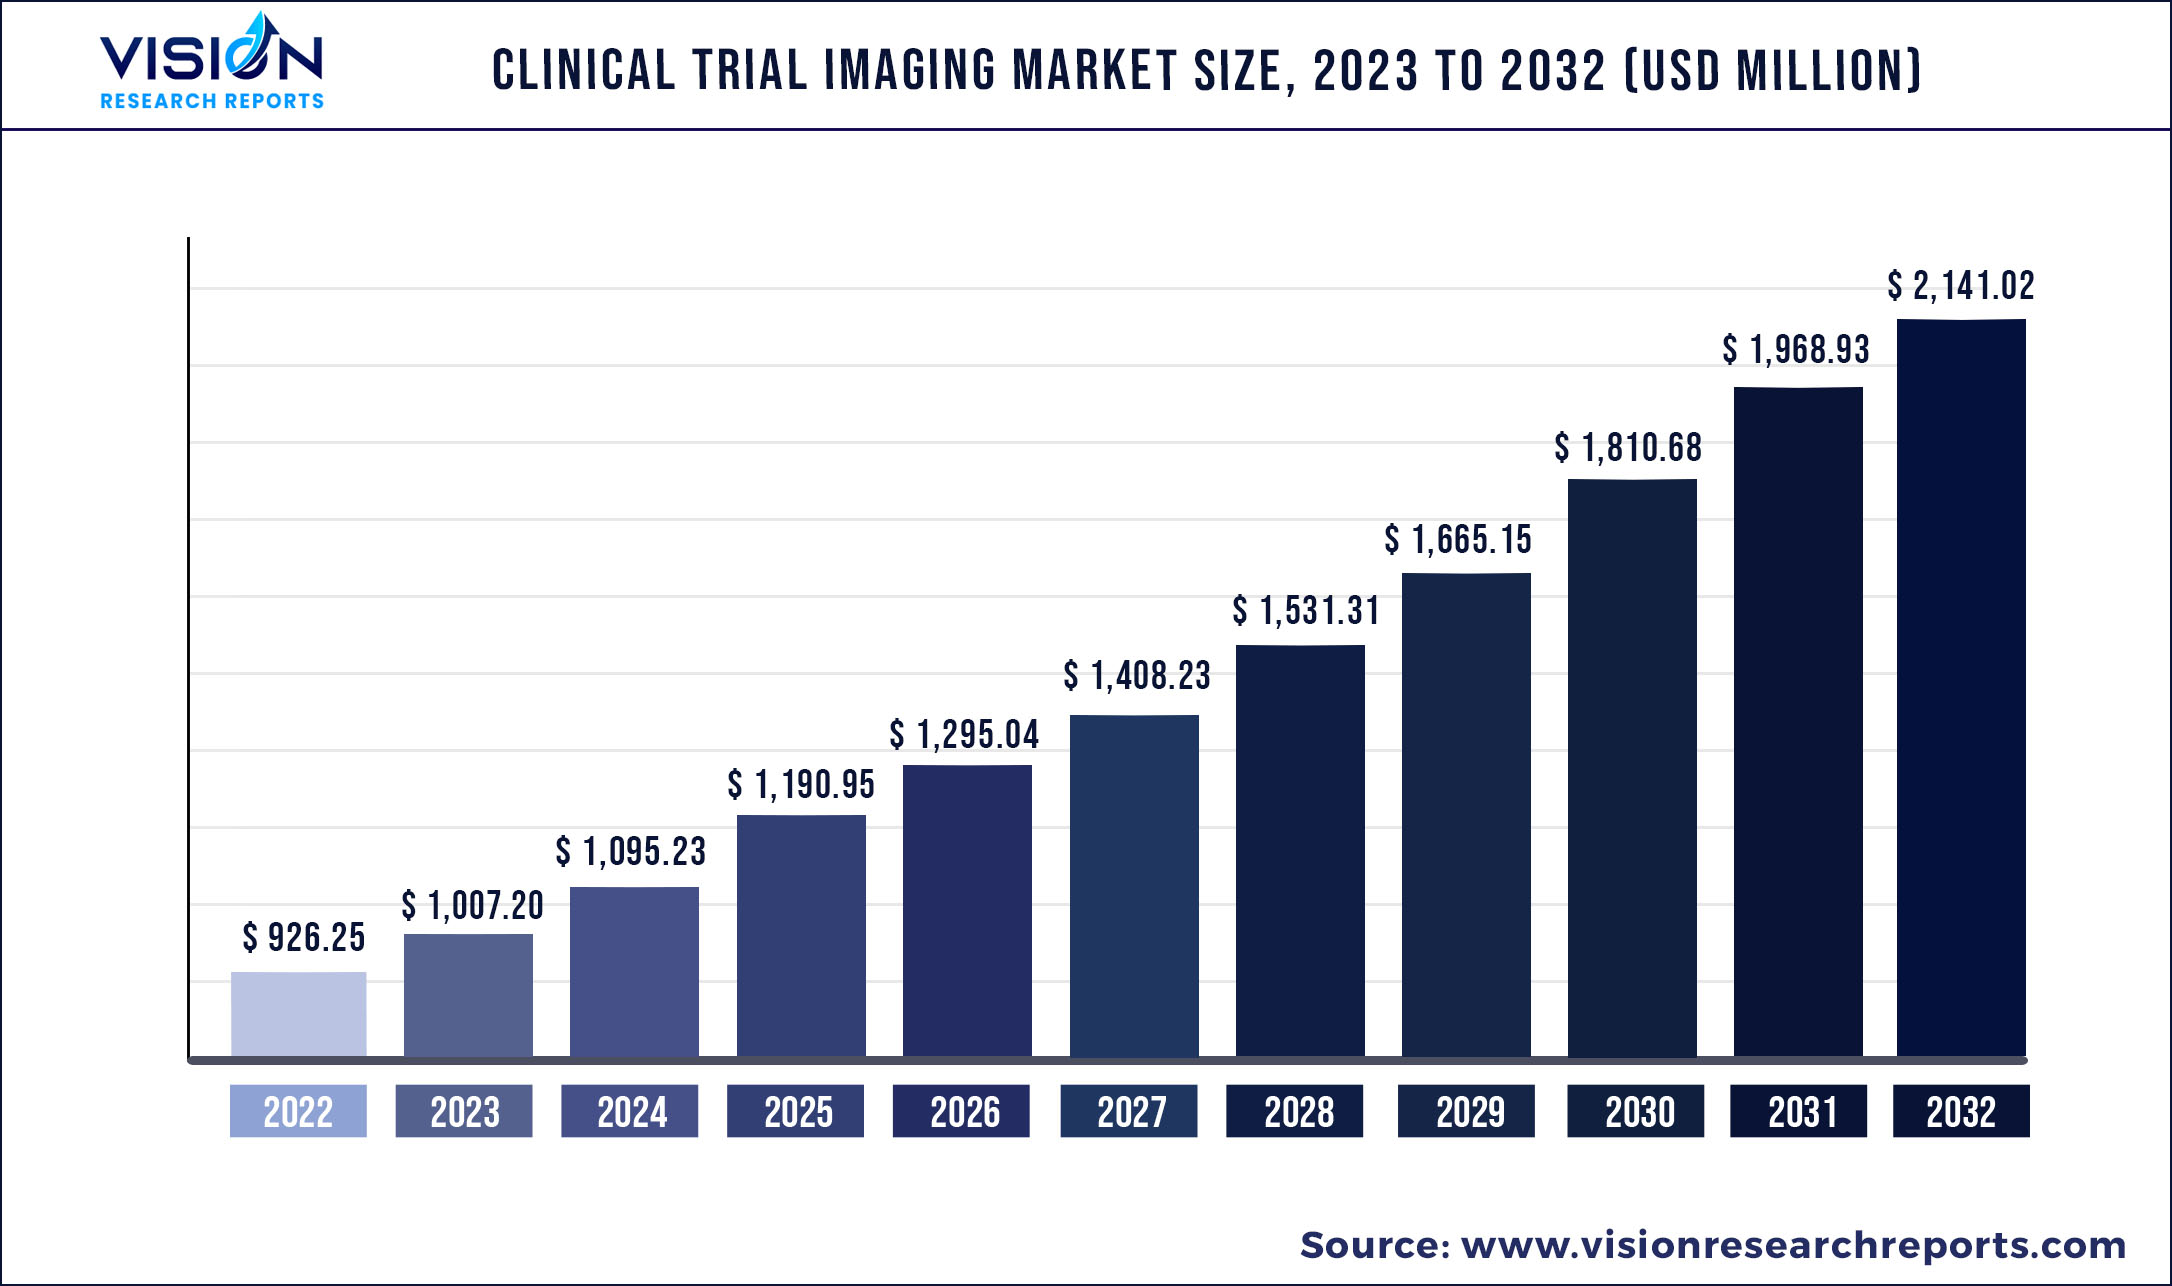
The global clinical trial imaging market size was estimated at around USD 926.25 million in 2022 and it is projected to hit around USD 2,141.02 million by 2032, growing at a CAGR of 8.74% from 2023 to 2032.
Key Pointers
Report Scope of the Clinical Trial Imaging Market
| Report Coverage | Details |
| Market Size in 2022 | USD 926.25 million |
| Revenue Forecast by 2032 | USD 2,141.02 million |
| Growth rate from 2023 to 2032 | CAGR of 8.74% |
| Base Year | 2022 |
| Forecast Period | 2023 to 2032 |
| Market Analysis (Terms Used) | Value (US$ Million/Billion) or (Volume/Units) |
| Regions Covered | North America, Europe, Asia Pacific, Latin America, Middle East & Africa |
| Companies Covered | IXICO plc; Navitas Life Sciences; Resonance Health; ProScan Imaging; Radiant Sage LLC; Medpace; Biomedical Systems Corp; Cardiovascular Imaging Technologies; Intrinsic Imaging; BioTelemetry |
Mounting biotechnology and pharmaceutical industries combined with increased research and development investments for developing new drugs to treat diseases is expected to drive the market industry growth. Medical imaging plays an active role in the clinical development of novel life science products. Although the medical imaging industry is in a constant state of fluctuation, the biotechnology, and pharmaceutical industries continue to increase. This can be attributed to the enhanced investment in medical imaging companies and mergers and acquisitions, supported by the adoption of innovative imaging technologies to support clinical trials for medical devices.
However, the high cost of machinery and their installations, and the enormous cost of clinical trials may limit the market growth during the forecast period. Advancements in technology are bringing substantial improvements to the collection, evaluation, and submit clinical trial imaging data. Technology-enabled imaging, especially image analysis software, provides various benefits to clinical studies such as consistency, data accuracy, adaptability as well as compliance. For instance, image analysis software is used to direct and manage a reader via analysis of imaging time points.
The outbreak of COVID-19 has adversely impacted the healthcare system in most countries, leading to a disruption in medical studies, research activities, and reduced sponsorship for research involving clinical trials. The pandemic has hampered the clinical trial timeline as numerous ongoing studies were delayed and planned studies were canceled. Unfavorable changes in regulations and guidelines, supply chain disruption, recruitment challenges for clinical trials, fear of viral spread, and shutting down of most manufacturers during lockdown have also adversely impacted the market. However, the introduction of virtual imaging trials during the COVID-19 pandemic is expected to open new avenues for the adoption of these devices. The development of advanced computational models helps has helped in better assessment of CT and radiography images which are expected to help in the early diagnosis of COVID-19 in patients. The clinical trial imaging market is said to bounce back by 2022 Q2, supported by the rise in R&D activities and improvement in supply and distribution channels.
Increased use of imaging technology along with the enhanced power of computing is expected to drive the usage of imaging in clinical trials. The Quantitative Imaging Biomarkers Alliance (QIBA) protocol has come up with standardized methods and imaging procedures with uniform procedures to be implemented for attaining statistical and precise endpoints in clinical trials.
For improving image assessment and capturing, numerous technology patents have been filed. Also, patented technologies are being provided by the imaging core lab players that are expected to aid the pharmaceutical companies in minimizing development timelines. For instance, a reading tool named Assessa, by IXICO aids in improved decision-making in clinical trials for diseases associated with memories such as schizophrenia, Parkinson’s, and Alzheimer’s disease, and neurological disorders like dementia and cognitive impairment.
Clinical Trial Imaging Market Segmentations:
By Service
By Application
By End-use
Chapter 1. Introduction
1.1. Research Objective
1.2. Scope of the Study
1.3. Definition
Chapter 2. Research Methodology
2.1. Research Approach
2.2. Data Sources
2.3. Assumptions & Limitations
Chapter 3. Executive Summary
3.1. Market Snapshot
Chapter 4. Market Variables and Scope
4.1. Introduction
4.2. Market Classification and Scope
4.3. Industry Value Chain Analysis
4.3.1. Raw Material Procurement Analysis
4.3.2. Sales and Distribution Service Analysis
4.3.3. Downstream Buyer Analysis
Chapter 5. COVID 19 Impact on Clinical Trial Imaging Market
5.1. COVID-19 Landscape: Clinical Trial Imaging Industry Impact
5.2. COVID 19 - Impact Assessment for the Industry
5.3. COVID 19 Impact: Global Major Government Policy
5.4. Market Trends and Opportunities in the COVID-19 Landscape
Chapter 6. Market Dynamics Analysis and Trends
6.1. Market Dynamics
6.1.1. Market Drivers
6.1.2. Market Restraints
6.1.3. Market Opportunities
6.2. Porter’s Five Forces Analysis
6.2.1. Bargaining power of suppliers
6.2.2. Bargaining power of buyers
6.2.3. Threat of substitute
6.2.4. Threat of new entrants
6.2.5. Degree of competition
Chapter 7. Competitive Landscape
7.1.1. Company Market Share/Positioning Analysis
7.1.2. Key Strategies Adopted by Players
7.1.3. Vendor Landscape
7.1.3.1. List of Suppliers
7.1.3.2. List of Buyers
Chapter 8. Global Clinical Trial Imaging Market, By Service
8.1. Clinical Trial Imaging Market, by Service, 2023-2032
8.1.1 Clinical Trial Design and Consultation Services
8.1.1.1. Market Revenue and Forecast (2020-2032)
8.1.2. Reading and Analytical Services
8.1.2.1. Market Revenue and Forecast (2020-2032)
8.1.3. Operational Imaging Services
8.1.3.1. Market Revenue and Forecast (2020-2032)
8.1.4. System and Technology Support Services
8.1.4.1. Market Revenue and Forecast (2020-2032)
8.1.5. Project and Data Management
8.1.5.1. Market Revenue and Forecast (2020-2032)
Chapter 9. Global Clinical Trial Imaging Market, By Application
9.1. Clinical Trial Imaging Market, by Application, 2023-2032
9.1.1. NASH
9.1.1.1. Market Revenue and Forecast (2020-2032)
9.1.2. CKD
9.1.2.1. Market Revenue and Forecast (2020-2032)
9.1.3. Diabetes
9.1.3.1. Market Revenue and Forecast (2020-2032)
9.1.4. Cardiovascular Diseases
9.1.4.1. Market Revenue and Forecast (2020-2032)
9.1.5. Others
9.1.5.1. Market Revenue and Forecast (2020-2032)
Chapter 10. Global Clinical Trial Imaging Market, By End-use
10.1. Clinical Trial Imaging Market, by End-use, 2023-2032
10.1.1. Biotechnology and Pharmaceutical companies
10.1.1.1. Market Revenue and Forecast (2020-2032)
10.1.2. Medical Devices Manufacturers
10.1.2.1. Market Revenue and Forecast (2020-2032)
10.1.3. Academic and Government Research Institutes
10.1.3.1. Market Revenue and Forecast (2020-2032)
10.1.4. Contract Research Organizations (CROs)
10.1.4.1. Market Revenue and Forecast (2020-2032)
10.1.5. Others
10.1.5.1. Market Revenue and Forecast (2020-2032)
Chapter 11. Global Clinical Trial Imaging Market, Regional Estimates and Trend Forecast
11.1. North America
11.1.1. Market Revenue and Forecast, by Service (2020-2032)
11.1.2. Market Revenue and Forecast, by Application (2020-2032)
11.1.3. Market Revenue and Forecast, by End-use (2020-2032)
11.1.4. U.S.
11.1.4.1. Market Revenue and Forecast, by Service (2020-2032)
11.1.4.2. Market Revenue and Forecast, by Application (2020-2032)
11.1.4.3. Market Revenue and Forecast, by End-use (2020-2032)
11.1.5. Rest of North America
11.1.5.1. Market Revenue and Forecast, by Service (2020-2032)
11.1.5.2. Market Revenue and Forecast, by Application (2020-2032)
11.1.5.3. Market Revenue and Forecast, by End-use (2020-2032)
11.2. Europe
11.2.1. Market Revenue and Forecast, by Service (2020-2032)
11.2.2. Market Revenue and Forecast, by Application (2020-2032)
11.2.3. Market Revenue and Forecast, by End-use (2020-2032)
11.2.4. UK
11.2.4.1. Market Revenue and Forecast, by Service (2020-2032)
11.2.4.2. Market Revenue and Forecast, by Application (2020-2032)
11.2.4.3. Market Revenue and Forecast, by End-use (2020-2032)
11.2.5. Germany
11.2.5.1. Market Revenue and Forecast, by Service (2020-2032)
11.2.5.2. Market Revenue and Forecast, by Application (2020-2032)
11.2.5.3. Market Revenue and Forecast, by End-use (2020-2032)
11.2.6. France
11.2.6.1. Market Revenue and Forecast, by Service (2020-2032)
11.2.6.2. Market Revenue and Forecast, by Application (2020-2032)
11.2.6.3. Market Revenue and Forecast, by End-use (2020-2032)
11.2.7. Rest of Europe
11.2.7.1. Market Revenue and Forecast, by Service (2020-2032)
11.2.7.2. Market Revenue and Forecast, by Application (2020-2032)
11.2.7.3. Market Revenue and Forecast, by End-use (2020-2032)
11.3. APAC
11.3.1. Market Revenue and Forecast, by Service (2020-2032)
11.3.2. Market Revenue and Forecast, by Application (2020-2032)
11.3.3. Market Revenue and Forecast, by End-use (2020-2032)
11.3.4. India
11.3.4.1. Market Revenue and Forecast, by Service (2020-2032)
11.3.4.2. Market Revenue and Forecast, by Application (2020-2032)
11.3.4.3. Market Revenue and Forecast, by End-use (2020-2032)
11.3.5. China
11.3.5.1. Market Revenue and Forecast, by Service (2020-2032)
11.3.5.2. Market Revenue and Forecast, by Application (2020-2032)
11.3.5.3. Market Revenue and Forecast, by End-use (2020-2032)
11.3.6. Japan
11.3.6.1. Market Revenue and Forecast, by Service (2020-2032)
11.3.6.2. Market Revenue and Forecast, by Application (2020-2032)
11.3.6.3. Market Revenue and Forecast, by End-use (2020-2032)
11.3.7. Rest of APAC
11.3.7.1. Market Revenue and Forecast, by Service (2020-2032)
11.3.7.2. Market Revenue and Forecast, by Application (2020-2032)
11.3.7.3. Market Revenue and Forecast, by End-use (2020-2032)
11.4. MEA
11.4.1. Market Revenue and Forecast, by Service (2020-2032)
11.4.2. Market Revenue and Forecast, by Application (2020-2032)
11.4.3. Market Revenue and Forecast, by End-use (2020-2032)
11.4.4. GCC
11.4.4.1. Market Revenue and Forecast, by Service (2020-2032)
11.4.4.2. Market Revenue and Forecast, by Application (2020-2032)
11.4.4.3. Market Revenue and Forecast, by End-use (2020-2032)
11.4.5. North Africa
11.4.5.1. Market Revenue and Forecast, by Service (2020-2032)
11.4.5.2. Market Revenue and Forecast, by Application (2020-2032)
11.4.5.3. Market Revenue and Forecast, by End-use (2020-2032)
11.4.6. South Africa
11.4.6.1. Market Revenue and Forecast, by Service (2020-2032)
11.4.6.2. Market Revenue and Forecast, by Application (2020-2032)
11.4.6.3. Market Revenue and Forecast, by End-use (2020-2032)
11.4.7. Rest of MEA
11.4.7.1. Market Revenue and Forecast, by Service (2020-2032)
11.4.7.2. Market Revenue and Forecast, by Application (2020-2032)
11.4.7.3. Market Revenue and Forecast, by End-use (2020-2032)
11.5. Latin America
11.5.1. Market Revenue and Forecast, by Service (2020-2032)
11.5.2. Market Revenue and Forecast, by Application (2020-2032)
11.5.3. Market Revenue and Forecast, by End-use (2020-2032)
11.5.4. Brazil
11.5.4.1. Market Revenue and Forecast, by Service (2020-2032)
11.5.4.2. Market Revenue and Forecast, by Application (2020-2032)
11.5.4.3. Market Revenue and Forecast, by End-use (2020-2032)
11.5.5. Rest of LATAM
11.5.5.1. Market Revenue and Forecast, by Service (2020-2032)
11.5.5.2. Market Revenue and Forecast, by Application (2020-2032)
11.5.5.3. Market Revenue and Forecast, by End-use (2020-2032)
Chapter 12. Company Profiles
12.1. IXICO plc
12.1.1. Company Overview
12.1.2. Product Offerings
12.1.3. Financial Performance
12.1.4. Recent Initiatives
12.2. Navitas Life Sciences
12.2.1. Company Overview
12.2.2. Product Offerings
12.2.3. Financial Performance
12.2.4. Recent Initiatives
12.3. Resonance Health
12.3.1. Company Overview
12.3.2. Product Offerings
12.3.3. Financial Performance
12.3.4. Recent Initiatives
12.4. ProScan Imaging
12.4.1. Company Overview
12.4.2. Product Offerings
12.4.3. Financial Performance
12.4.4. Recent Initiatives
12.5. Radiant Sage LLC
12.5.1. Company Overview
12.5.2. Product Offerings
12.5.3. Financial Performance
12.5.4. Recent Initiatives
12.6. Medpace
12.6.1. Company Overview
12.6.2. Product Offerings
12.6.3. Financial Performance
12.6.4. Recent Initiatives
12.7. Biomedical Systems Corp
12.7.1. Company Overview
12.7.2. Product Offerings
12.7.3. Financial Performance
12.7.4. Recent Initiatives
12.8. Cardiovascular Imaging Technologies
12.8.1. Company Overview
12.8.2. Product Offerings
12.8.3. Financial Performance
12.8.4. Recent Initiatives
12.9. Intrinsic Imaging
12.9.1. Company Overview
12.9.2. Product Offerings
12.9.3. Financial Performance
12.9.4. Recent Initiatives
12.10. BioTelemetry
12.10.1. Company Overview
12.10.2. Product Offerings
12.10.3. Financial Performance
12.10.4. Recent Initiatives
Chapter 13. Research Methodology
13.1. Primary Research
13.2. Secondary Research
13.3. Assumptions
Chapter 14. Appendix
14.1. About Us
14.2. Glossary of Terms
 Cross-segment Market Size and Analysis for
Mentioned Segments
Additional Company Profiles (Upto 5 With No Cost)
Additional Countries (Apart From Mentioned Countries)
Country/Region-specific Report
Go To Market Strategy
Region Specific Market DynamicsRegion Level Market Share Import Export AnalysisProduction AnalysisOthers
Cross-segment Market Size and Analysis for
Mentioned Segments
Additional Company Profiles (Upto 5 With No Cost)
Additional Countries (Apart From Mentioned Countries)
Country/Region-specific Report
Go To Market Strategy
Region Specific Market DynamicsRegion Level Market Share Import Export AnalysisProduction AnalysisOthers