Commercial Vehicles Market Size, Share | Report 2023-2032
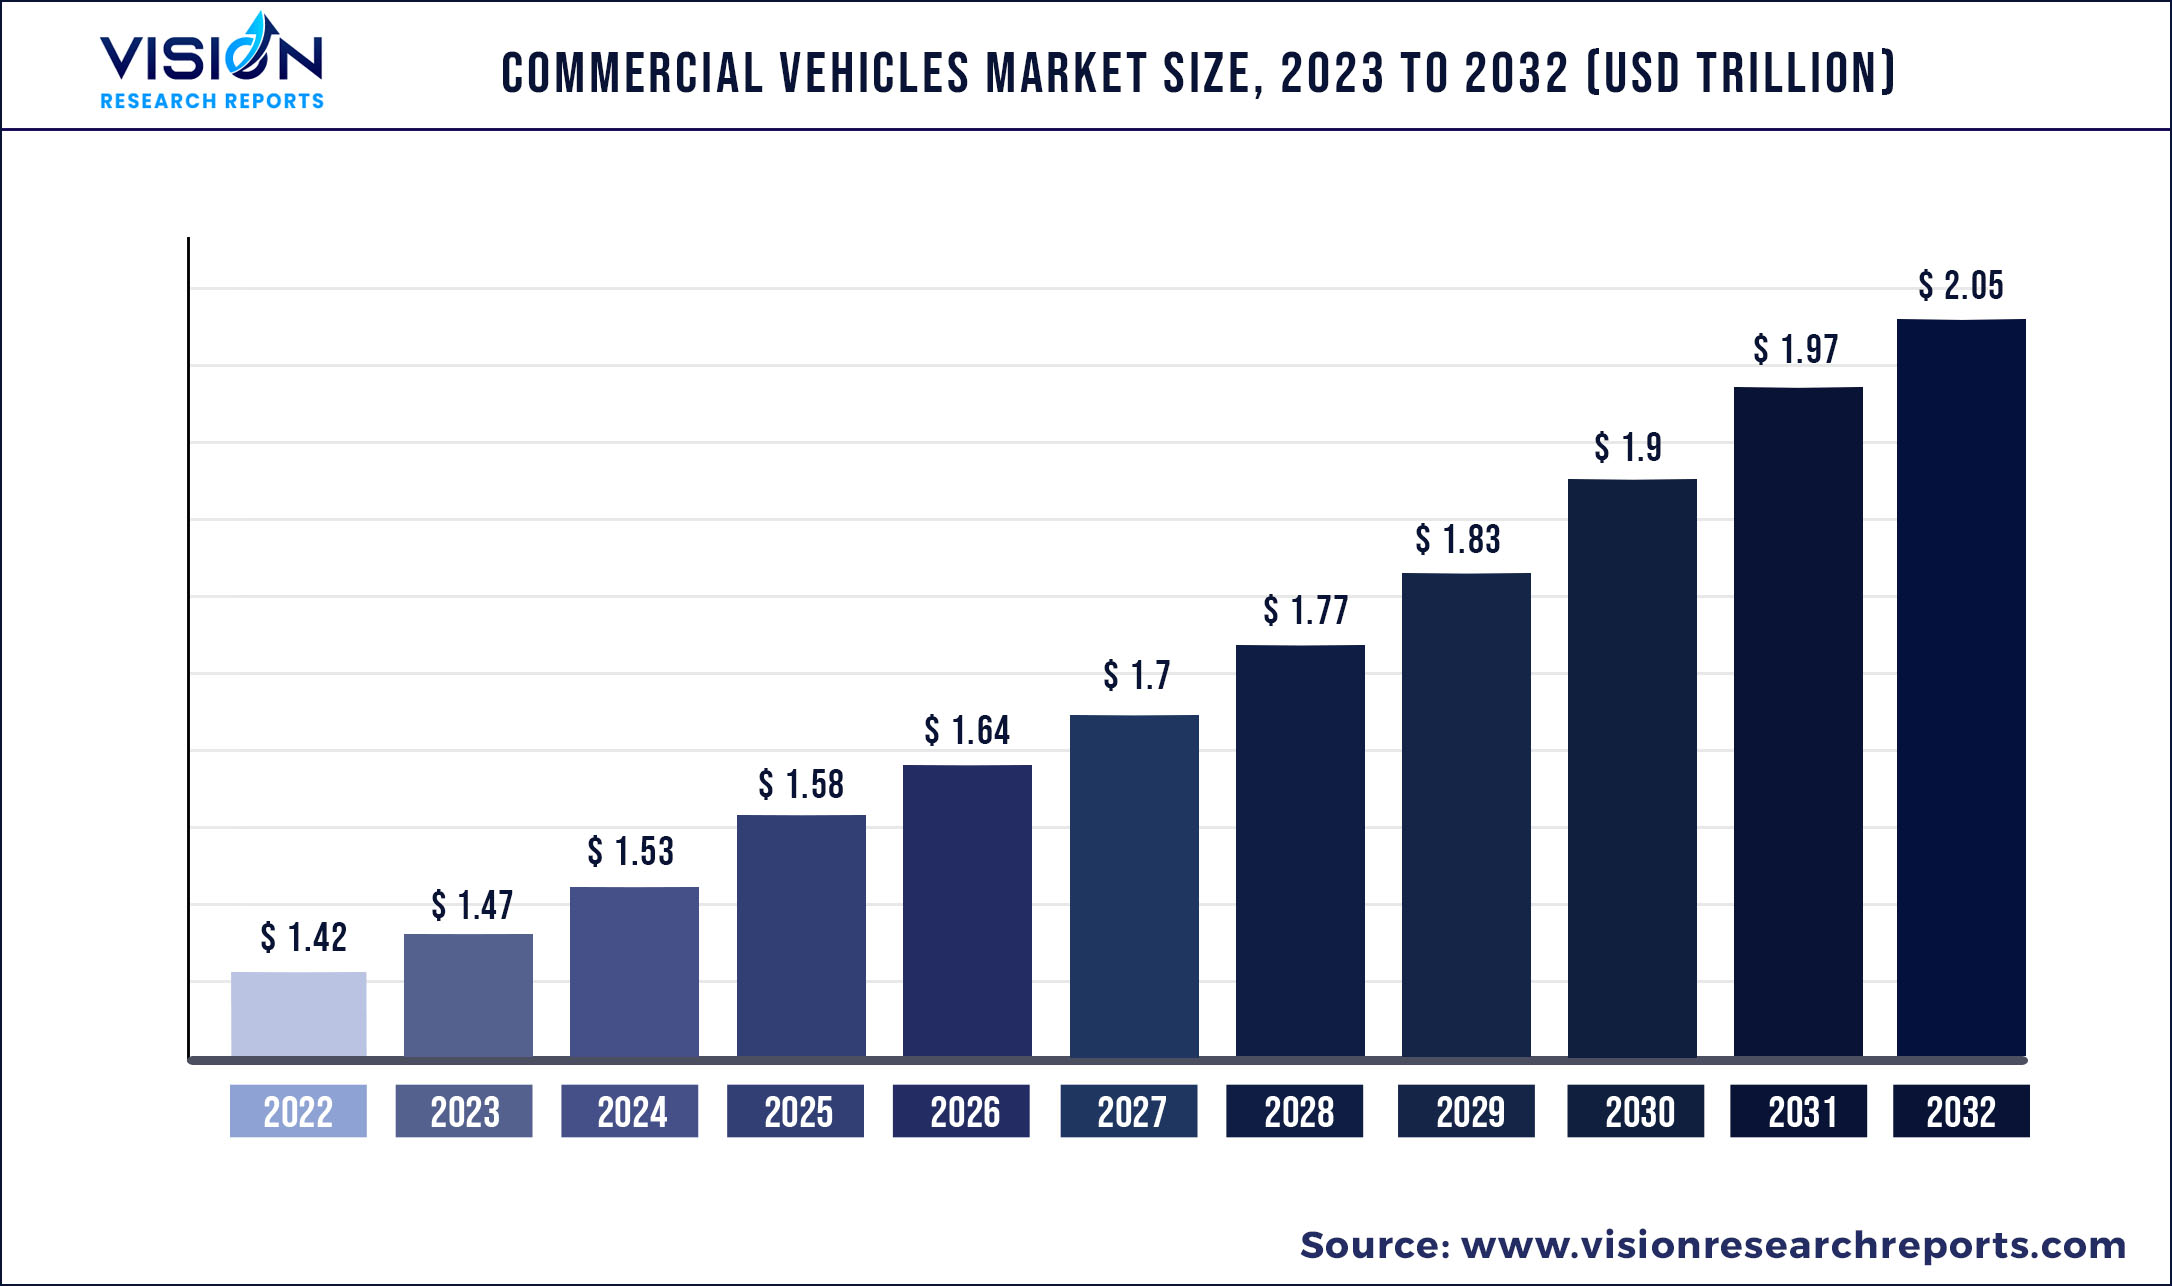
The global commercial vehicles market was valued at USD 1.42 trillion in 2022 and it is predicted to surpass around USD 2.05 trillion by 2032 with a CAGR of 3.72% from 2023 to 2032.
Key Pointers
| Report Coverage | Details |
| Market Size in 2022 | USD 1.42 trillion |
| Revenue Forecast by 2032 | USD 2.05 trillion |
| Growth rate from 2023 to 2032 | CAGR of 3.72% |
| Base Year | 2022 |
| Forecast Period | 2023 to 2032 |
| Regions Covered | North America, Europe, Asia Pacific, Latin America, Middle East & Africa |
| Companies Covered | Ashok Leyland; Bosch Rexroth AG; Daimler; Volkswagen AG; Toyota Motor Corporation; Mahindra and Mahindra; TATA Motors; AB Volvo; Golden Dragon; General Motors |
Implementation of vehicle scrappage programs, aggressive investments in infrastructure development and rural development, and drafting of stringent regulatory norms for vehicle length and loading limits, among other parameters, are anticipated to fuel the growth. The resumption of mining activities in some parts of the world, which has triggered the demand for tippers, is also expected to drive growth.
The rising levels of disposable income in both developing and developed countries and the continued infrastructure development are also projected to bode well for the growth of the market. The rise in awareness for environmentally sustainable transportation solutions has motivated commercial vehicle manufacturers to develop vehicles that reduce carbon emissions. Manufacturers are working on innovating vehicle design, reducing load factors & size, and customizing vehicles according to weight regulations.
Infrastructure conditions, driver technique, weather management, and national policy are additional influential factors considered by automakers for developing vehicles. Research & development for manufacturing such vehicles requires a significant investment. Thus, there is a requirement for policy action and investment initiatives to be taken by the government, private and public sectors. Such initiatives will support manufacturers in reducing operational & production costs.
Furthermore, the demand for small, medium-, and heavy commercial vehicles has increased for logistics and transportation purposes in association with e-commerce. The logistics market has shifted from just being a service provider to offering customer-centric solutions. Thus, the requirement for commercial vehicles has increased for transportation purposes. Supportive regulatory frameworks and additional incentives from governments have raised the demand for commercial electric vehicles. There has been an increase in electric buses and heavy-duty truck registrations in North America, Europe, and the Asia Pacific regions.
With the emerging economies in the Asia Pacific region, China dominates the overall electric bus and electric truck market. According to IEA, with more than 78k buses and 31k trucks registered, local policies of the Chinese government are a significant contributor to high sales of Electric Commercial Vehicles (ECVs). Thus, with the rapid increase in the adoption of electric vehicles, electric commercial vehicles are also expected to witness considerable traction over the forecast period.
While various factors contribute to the growth of the commercial vehicle market, COVID-19 has posed a severe challenge. Global lockdowns stalled all manufacturing and transportation activities. Disruption of the supply chain and economic slowdowns impacted several sectors such as automobile, transportation, and logistics. As the transportation and logistics sectors hold around 50% share in the market for commercial vehicles, less demand from this sector resulted in declining sales of commercial vehicles.
Commercial Vehicles Market Segmentations:
| By Product | By End-Use |
|
Light Commercial Vehicles (LCVs) Heavy Trucks Buses & Coaches |
Industrial Mining & Construction Logistics Passenger Transportation Others |
Chapter 1. Introduction
1.1. Research Objective
1.2. Scope of the Study
1.3. Definition
Chapter 2. Research Methodology
2.1. Research Approach
2.2. Data Sources
2.3. Assumptions & Limitations
Chapter 3. Executive Summary
3.1. Market Snapshot
Chapter 4. Market Variables and Scope
4.1. Introduction
4.2. Market Classification and Scope
4.3. Industry Value Chain Analysis
4.3.1. Raw Material Procurement Analysis
4.3.2. Sales and Distribution Channel Analysis
4.3.3. Downstream Buyer Analysis
Chapter 5. COVID 19 Impact on Commercial Vehicles Market
5.1. COVID-19 Landscape: Commercial Vehicles Industry Impact
5.2. COVID 19 - Impact Assessment for the Industry
5.3. COVID 19 Impact: Global Major Government Policy
5.4. Market Trends and Opportunities in the COVID-19 Landscape
Chapter 6. Market Dynamics Analysis and Trends
6.1. Market Dynamics
6.1.1. Market Drivers
6.1.2. Market Restraints
6.1.3. Market Opportunities
6.2. Porter’s Five Forces Analysis
6.2.1. Bargaining power of suppliers
6.2.2. Bargaining power of buyers
6.2.3. Threat of substitute
6.2.4. Threat of new entrants
6.2.5. Degree of competition
Chapter 7. Competitive Landscape
7.1.1. Company Market Share/Positioning Analysis
7.1.2. Key Strategies Adopted by Players
7.1.3. Vendor Landscape
7.1.3.1. List of Suppliers
7.1.3.2. List of Buyers
Chapter 8. Global Commercial Vehicles Market, By Product
8.1. Commercial Vehicles Market, by Product, 2023-2032
8.1.1. Light Commercial Vehicles (LCVs)
8.1.1.1. Market Revenue and Forecast (2020-2032)
8.1.2. Heavy Trucks
8.1.2.1. Market Revenue and Forecast (2020-2032)
8.1.3. Buses & Coaches
8.1.3.1. Market Revenue and Forecast (2020-2032)
Chapter 9. Global Commercial Vehicles Market, By End-Use
9.1. Commercial Vehicles Market, by End-Use, 2023-2032
9.1.1. Industrial
9.1.1.1. Market Revenue and Forecast (2020-2032)
9.1.2. Mining & Construction
9.1.2.1. Market Revenue and Forecast (2020-2032)
9.1.3. Logistics
9.1.3.1. Market Revenue and Forecast (2020-2032)
9.1.4. Passenger Transportation
9.1.4.1. Market Revenue and Forecast (2020-2032)
9.1.5. Others
9.1.5.1. Market Revenue and Forecast (2020-2032)
Chapter 10. Global Commercial Vehicles Market, Regional Estimates and Trend Forecast
10.1. North America
10.1.1. Market Revenue and Forecast, by Product (2020-2032)
10.1.2. Market Revenue and Forecast, by End-Use (2020-2032)
10.1.3. U.S.
10.1.3.1. Market Revenue and Forecast, by Product (2020-2032)
10.1.3.2. Market Revenue and Forecast, by End-Use (2020-2032)
10.1.4. Rest of North America
10.1.4.1. Market Revenue and Forecast, by Product (2020-2032)
10.1.4.2. Market Revenue and Forecast, by End-Use (2020-2032)
10.2. Europe
10.2.1. Market Revenue and Forecast, by Product (2020-2032)
10.2.2. Market Revenue and Forecast, by End-Use (2020-2032)
10.2.3. UK
10.2.3.1. Market Revenue and Forecast, by Product (2020-2032)
10.2.3.2. Market Revenue and Forecast, by End-Use (2020-2032)
10.2.4. Germany
10.2.4.1. Market Revenue and Forecast, by Product (2020-2032)
10.2.4.2. Market Revenue and Forecast, by End-Use (2020-2032)
10.2.5. France
10.2.5.1. Market Revenue and Forecast, by Product (2020-2032)
10.2.5.2. Market Revenue and Forecast, by End-Use (2020-2032)
10.2.6. Rest of Europe
10.2.6.1. Market Revenue and Forecast, by Product (2020-2032)
10.2.6.2. Market Revenue and Forecast, by End-Use (2020-2032)
10.3. APAC
10.3.1. Market Revenue and Forecast, by Product (2020-2032)
10.3.2. Market Revenue and Forecast, by End-Use (2020-2032)
10.3.3. India
10.3.3.1. Market Revenue and Forecast, by Product (2020-2032)
10.3.3.2. Market Revenue and Forecast, by End-Use (2020-2032)
10.3.4. China
10.3.4.1. Market Revenue and Forecast, by Product (2020-2032)
10.3.4.2. Market Revenue and Forecast, by End-Use (2020-2032)
10.3.5. Japan
10.3.5.1. Market Revenue and Forecast, by Product (2020-2032)
10.3.5.2. Market Revenue and Forecast, by End-Use (2020-2032)
10.3.6. Rest of APAC
10.3.6.1. Market Revenue and Forecast, by Product (2020-2032)
10.3.6.2. Market Revenue and Forecast, by End-Use (2020-2032)
10.4. MEA
10.4.1. Market Revenue and Forecast, by Product (2020-2032)
10.4.2. Market Revenue and Forecast, by End-Use (2020-2032)
10.4.3. GCC
10.4.3.1. Market Revenue and Forecast, by Product (2020-2032)
10.4.3.2. Market Revenue and Forecast, by End-Use (2020-2032)
10.4.4. North Africa
10.4.4.1. Market Revenue and Forecast, by Product (2020-2032)
10.4.4.2. Market Revenue and Forecast, by End-Use (2020-2032)
10.4.5. South Africa
10.4.5.1. Market Revenue and Forecast, by Product (2020-2032)
10.4.5.2. Market Revenue and Forecast, by End-Use (2020-2032)
10.4.6. Rest of MEA
10.4.6.1. Market Revenue and Forecast, by Product (2020-2032)
10.4.6.2. Market Revenue and Forecast, by End-Use (2020-2032)
10.5. Latin America
10.5.1. Market Revenue and Forecast, by Product (2020-2032)
10.5.2. Market Revenue and Forecast, by End-Use (2020-2032)
10.5.3. Brazil
10.5.3.1. Market Revenue and Forecast, by Product (2020-2032)
10.5.3.2. Market Revenue and Forecast, by End-Use (2020-2032)
10.5.4. Rest of LATAM
10.5.4.1. Market Revenue and Forecast, by Product (2020-2032)
10.5.4.2. Market Revenue and Forecast, by End-Use (2020-2032)
Chapter 11. Company Profiles
11.1. Ashok Leyland
11.1.1. Company Overview
11.1.2. Product Offerings
11.1.3. Financial Performance
11.1.4. Recent Initiatives
11.2. Bosch Rexroth AG
11.2.1. Company Overview
11.2.2. Product Offerings
11.2.3. Financial Performance
11.2.4. Recent Initiatives
11.3. Daimler
11.3.1. Company Overview
11.3.2. Product Offerings
11.3.3. Financial Performance
11.3.4. Recent Initiatives
11.4. Volkswagen AG
11.4.1. Company Overview
11.4.2. Product Offerings
11.4.3. Financial Performance
11.4.4. LTE Scientific
11.5. Toyota Motor Corporation
11.5.1. Company Overview
11.5.2. Product Offerings
11.5.3. Financial Performance
11.5.4. Recent Initiatives
11.6. Mahindra and Mahindra
11.6.1. Company Overview
11.6.2. Product Offerings
11.6.3. Financial Performance
11.6.4. Recent Initiatives
11.7. TATA Motors
11.7.1. Company Overview
11.7.2. Product Offerings
11.7.3. Financial Performance
11.7.4. Recent Initiatives
11.8. AB Volvo
11.8.1. Company Overview
11.8.2. Product Offerings
11.8.3. Financial Performance
11.8.4. Recent Initiatives
11.9. Golden Dragon
11.9.1. Company Overview
11.9.2. Product Offerings
11.9.3. Financial Performance
11.9.4. Recent Initiatives
11.10. General Motors
11.10.1. Company Overview
11.10.2. Product Offerings
11.10.3. Financial Performance
11.10.4. Recent Initiatives
Chapter 12. Research Methodology
12.1. Primary Research
12.2. Secondary Research
12.3. Assumptions
Chapter 13. Appendix
13.1. About Us
13.2. Glossary of Terms
 Cross-segment Market Size and Analysis for
Mentioned Segments
Additional Company Profiles (Upto 5 With No Cost)
Additional Countries (Apart From Mentioned Countries)
Country/Region-specific Report
Go To Market Strategy
Region Specific Market DynamicsRegion Level Market Share Import Export AnalysisProduction AnalysisOthers
Cross-segment Market Size and Analysis for
Mentioned Segments
Additional Company Profiles (Upto 5 With No Cost)
Additional Countries (Apart From Mentioned Countries)
Country/Region-specific Report
Go To Market Strategy
Region Specific Market DynamicsRegion Level Market Share Import Export AnalysisProduction AnalysisOthers