Compression Therapy Market Size, Trends, Share, Growth | Report 2023-2032
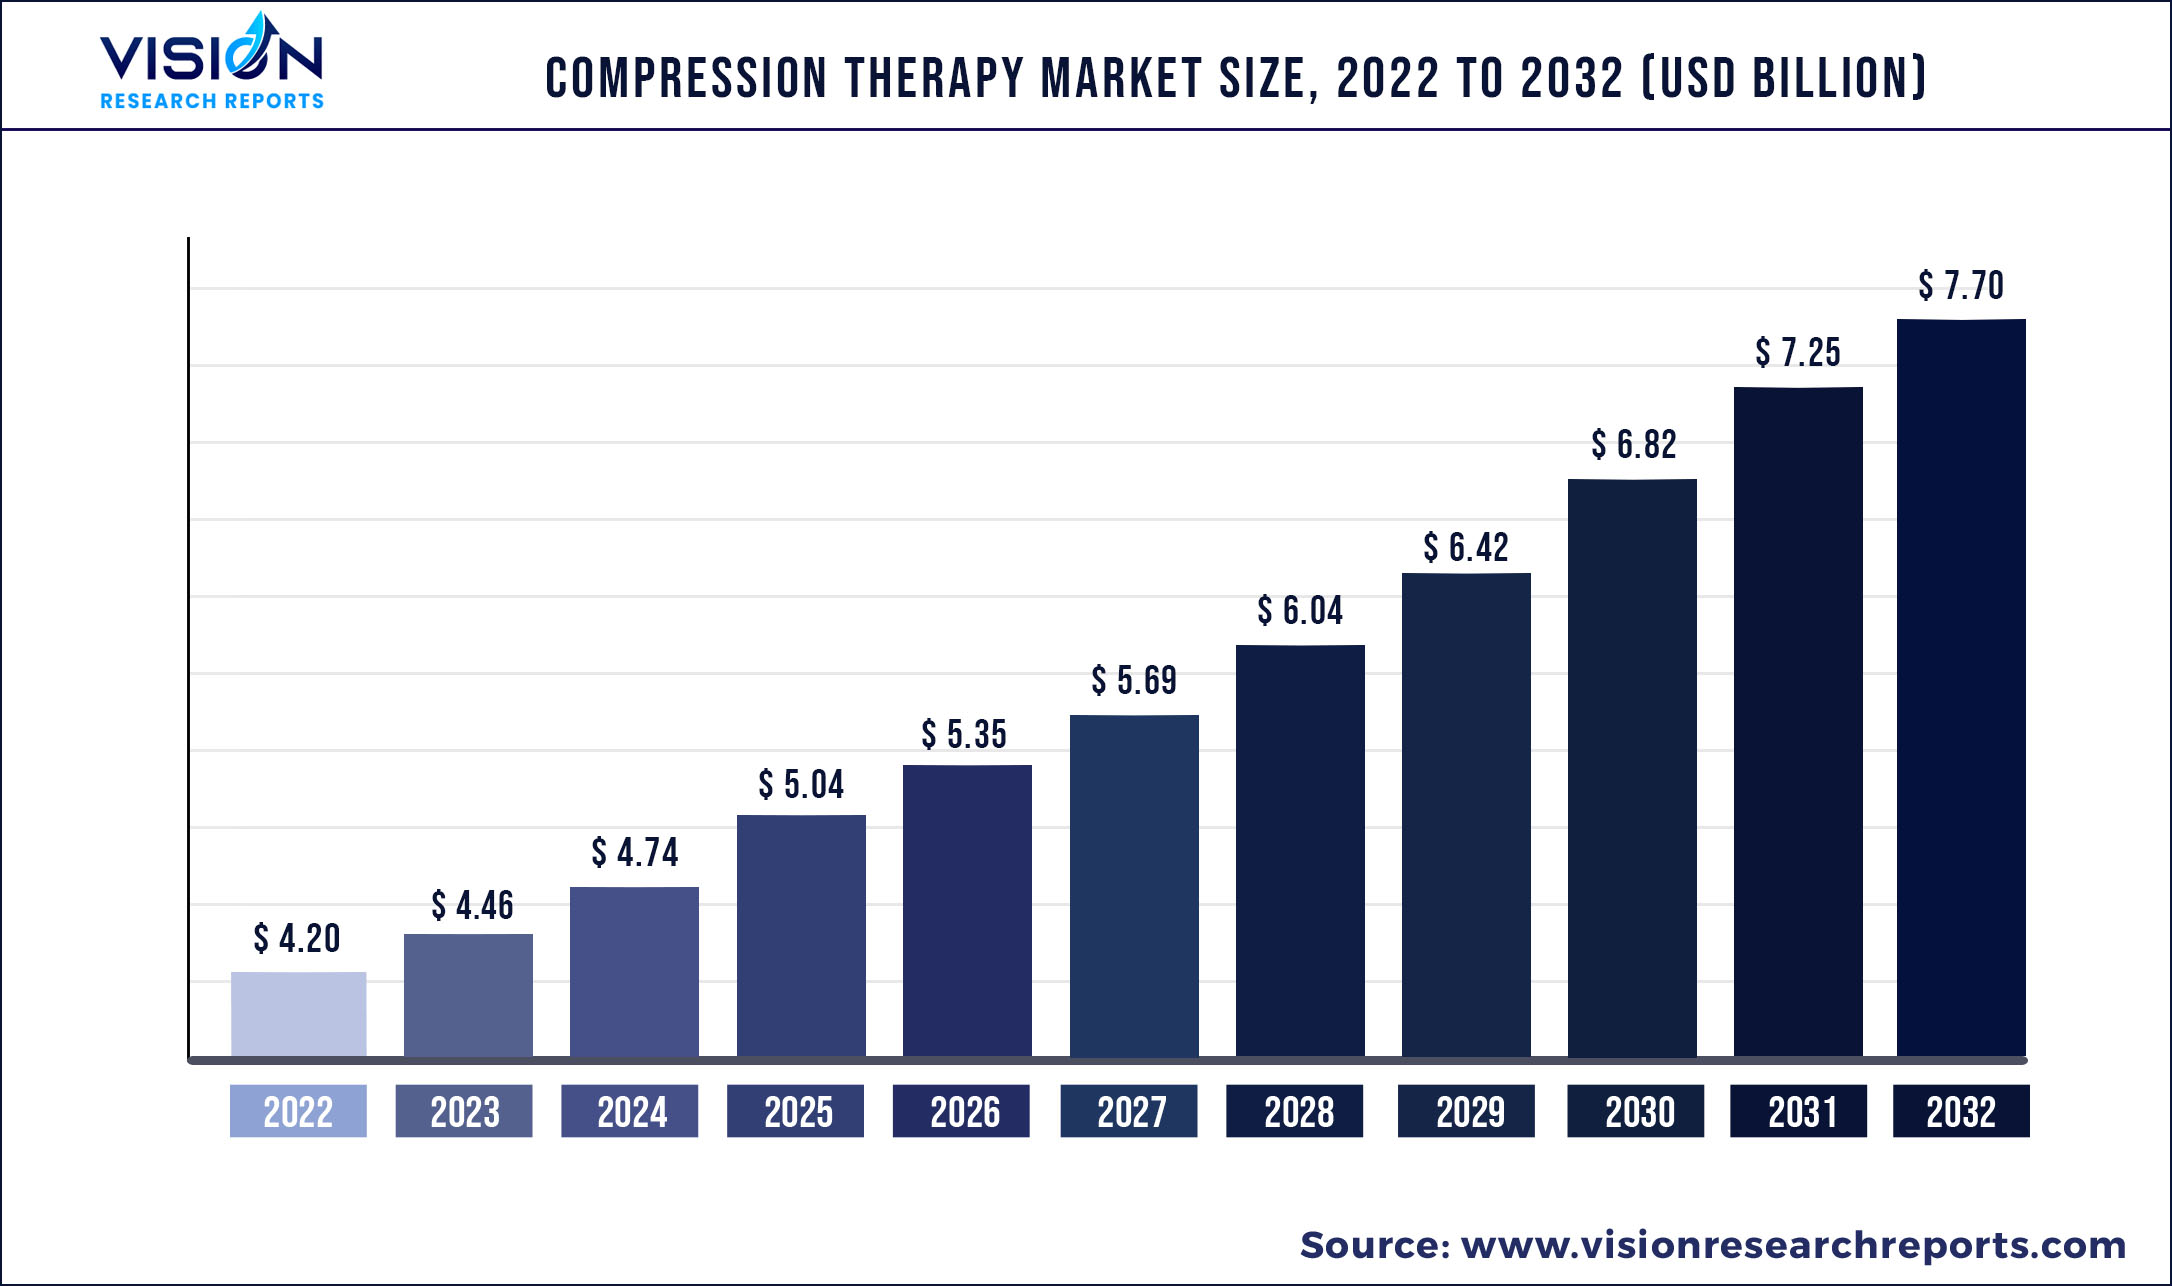
The global compression therapy market was estimated at USD 4.20 billion in 2022 and it is expected to surpass around USD 7.70 billion by 2032, poised to grow at a CAGR of 6.25% from 2023 to 2032.
Key Pointers
| Report Coverage | Details |
| Market Size in 2022 | USD 4.20 billion |
| Revenue Forecast by 2032 | USD 7.70 billion |
| Growth rate from 2023 to 2032 | CAGR of 6.25% |
| Base Year | 2022 |
| Forecast Period | 2023 to 2032 |
| Regions Covered | North America, Europe, Asia Pacific, Latin America, Middle East & Africa |
| Companies Covered | Cardinal Health; Julius Zorn GmbH; Hartmann AG;Medi GmbH & Co.; SIGVARIS; BSN Medical GmbH; ArjoHuntleigh; 3M Health Care; Spectrum Healthcare; Bio Compression Systems, Inc.; Stryker; Gottfried Medical |
Rise in the prevalence of vein disorders such as leg ulcers, deep vein thrombosis, lymphedema, varicose veins, and blood clots is a high impact driver. Products, especially stockings and bandages are being increasingly used to treat the aforementioned disorders, thus driving the market growth. The COVID-19 pandemic had a great impact on human life and economic activities. The rapid spread of the virus and the immense threat that the virus possessed to human life resulted in a large number of hospitalizations across different countries. This rise in the number of hospitalized patients had a positive impact on the compression therapy market.
As hospitalized patients had to stay in one position for a very long time during their hospital stay, it led to a rise in the prevalence of venous disorders. For instance, according to a research article published in 2022, by PLOS, a non-profit organization in the U.S., upper extremity deep vein thrombosis can occur in COVID-19 patients despite adequate prophylaxis, especially in patients undergoing helmet CPAP ventilation.
Potential benefits associated with the application of compression therapy products in the treatment of the target diseases, such as reduction of leg and foot volume, venous reflux, and hypertension, are expected to propel the demand during the forecast period. In addition, the availability of various alternatives or modalities, ranging from bandages and stockings to pneumatic devices, to achieve efficient treatment provides several options to patients with varying conditions.
The market is predominantly driven by the growing number of orthopedic procedures due to a significant rise in the number of accidents and the obese population globally. The increasing geriatric population is highly susceptible to orthopedic conditions thereby contributing to the high number of orthopedic procedures. Moreover, varicose veins are also a common vein disorder in the geriatric population. For instance, according to a research article published by Chicago Vein Institute, in 2022, an estimated 50% of the U.S. population over 50 years old has varicose veins. These factors are leading to an upsurge in the consumption of the products.
Compression Therapy Market Segmentations:
| By Technology | By Product |
|
Static Compression Therapy Dynamic Compression Therapy |
Compression Pumps Compression Stockings Compression Bandages Compression Tape |
Chapter 1. Introduction
1.1. Research Objective
1.2. Scope of the Study
1.3. Definition
Chapter 2. Research Methodology
2.1. Research Approach
2.2. Data Sources
2.3. Assumptions & Limitations
Chapter 3. Executive Summary
3.1. Market Snapshot
Chapter 4. Market Variables and Scope
4.1. Introduction
4.2. Market Classification and Scope
4.3. Industry Value Chain Analysis
4.3.1. Raw Material Procurement Analysis
4.3.2. Sales and Distribution Channel Analysis
4.3.3. Downstream Buyer Analysis
Chapter 5. COVID 19 Impact on Compression Therapy Market
5.1. COVID-19 Landscape: Compression Therapy Industry Impact
5.2. COVID 19 - Impact Assessment for the Industry
5.3. COVID 19 Impact: Global Major Government Policy
5.4. Market Trends and Opportunities in the COVID-19 Landscape
Chapter 6. Market Dynamics Analysis and Trends
6.1. Market Dynamics
6.1.1. Market Drivers
6.1.2. Market Restraints
6.1.3. Market Opportunities
6.2. Porter’s Five Forces Analysis
6.2.1. Bargaining power of suppliers
6.2.2. Bargaining power of buyers
6.2.3. Threat of substitute
6.2.4. Threat of new entrants
6.2.5. Degree of competition
Chapter 7. Competitive Landscape
7.1.1. Company Market Share/Positioning Analysis
7.1.2. Key Strategies Adopted by Players
7.1.3. Vendor Landscape
7.1.3.1. List of Suppliers
7.1.3.2. List of Buyers
Chapter 8. Global Compression Therapy Market, By Technology
8.1. Compression Therapy Market, by Technology, 2023-2032
8.1.1. Static Compression Therapy
8.1.1.1. Market Revenue and Forecast (2019-2032)
8.1.2. Dynamic Compression Therapy
8.1.2.1. Market Revenue and Forecast (2019-2032)
Chapter 9. Global Compression Therapy Market, By Product
9.1. Compression Therapy Market, by Product, 2023-2032
9.1.1. Compression Pumps
9.1.1.1. Market Revenue and Forecast (2019-2032)
9.1.2. Compression Stockings
9.1.2.1. Market Revenue and Forecast (2019-2032)
9.1.3. Compression Bandages
9.1.3.1. Market Revenue and Forecast (2019-2032)
9.1.4. Compression Tape
9.1.4.1. Market Revenue and Forecast (2019-2032)
Chapter 10. Global Compression Therapy Market, Regional Estimates and Trend Forecast
10.1. North America
10.1.1. Market Revenue and Forecast, by Technology (2019-2032)
10.1.2. Market Revenue and Forecast, by Product (2019-2032)
10.1.3. U.S.
10.1.3.1. Market Revenue and Forecast, by Technology (2019-2032)
10.1.3.2. Market Revenue and Forecast, by Product (2019-2032)
10.1.4. Rest of North America
10.1.4.1. Market Revenue and Forecast, by Technology (2019-2032)
10.1.4.2. Market Revenue and Forecast, by Product (2019-2032)
10.2. Europe
10.2.1. Market Revenue and Forecast, by Technology (2019-2032)
10.2.2. Market Revenue and Forecast, by Product (2019-2032)
10.2.3. UK
10.2.3.1. Market Revenue and Forecast, by Technology (2019-2032)
10.2.3.2. Market Revenue and Forecast, by Product (2019-2032)
10.2.4. Germany
10.2.4.1. Market Revenue and Forecast, by Technology (2019-2032)
10.2.4.2. Market Revenue and Forecast, by Product (2019-2032)
10.2.5. France
10.2.5.1. Market Revenue and Forecast, by Technology (2019-2032)
10.2.5.2. Market Revenue and Forecast, by Product (2019-2032)
10.2.6. Rest of Europe
10.2.6.1. Market Revenue and Forecast, by Technology (2019-2032)
10.2.6.2. Market Revenue and Forecast, by Product (2019-2032)
10.3. APAC
10.3.1. Market Revenue and Forecast, by Technology (2019-2032)
10.3.2. Market Revenue and Forecast, by Product (2019-2032)
10.3.3. India
10.3.3.1. Market Revenue and Forecast, by Technology (2019-2032)
10.3.3.2. Market Revenue and Forecast, by Product (2019-2032)
10.3.4. China
10.3.4.1. Market Revenue and Forecast, by Technology (2019-2032)
10.3.4.2. Market Revenue and Forecast, by Product (2019-2032)
10.3.5. Japan
10.3.5.1. Market Revenue and Forecast, by Technology (2019-2032)
10.3.5.2. Market Revenue and Forecast, by Product (2019-2032)
10.3.6. Rest of APAC
10.3.6.1. Market Revenue and Forecast, by Technology (2019-2032)
10.3.6.2. Market Revenue and Forecast, by Product (2019-2032)
10.4. MEA
10.4.1. Market Revenue and Forecast, by Technology (2019-2032)
10.4.2. Market Revenue and Forecast, by Product (2019-2032)
10.4.3. GCC
10.4.3.1. Market Revenue and Forecast, by Technology (2019-2032)
10.4.3.2. Market Revenue and Forecast, by Product (2019-2032)
10.4.4. North Africa
10.4.4.1. Market Revenue and Forecast, by Technology (2019-2032)
10.4.4.2. Market Revenue and Forecast, by Product (2019-2032)
10.4.5. South Africa
10.4.5.1. Market Revenue and Forecast, by Technology (2019-2032)
10.4.5.2. Market Revenue and Forecast, by Product (2019-2032)
10.4.6. Rest of MEA
10.4.6.1. Market Revenue and Forecast, by Technology (2019-2032)
10.4.6.2. Market Revenue and Forecast, by Product (2019-2032)
10.5. Latin America
10.5.1. Market Revenue and Forecast, by Technology (2019-2032)
10.5.2. Market Revenue and Forecast, by Product (2019-2032)
10.5.3. Brazil
10.5.3.1. Market Revenue and Forecast, by Technology (2019-2032)
10.5.3.2. Market Revenue and Forecast, by Product (2019-2032)
10.5.4. Rest of LATAM
10.5.4.1. Market Revenue and Forecast, by Technology (2019-2032)
10.5.4.2. Market Revenue and Forecast, by Product (2019-2032)
Chapter 11. Company Profiles
11.1. Cardinal Health
11.1.1. Company Overview
11.1.2. Product Offerings
11.1.3. Financial Performance
11.1.4. Recent Initiatives
11.2. Julius Zorn GmbH
11.2.1. Company Overview
11.2.2. Product Offerings
11.2.3. Financial Performance
11.2.4. Recent Initiatives
11.3. Hartmann AG
11.3.1. Company Overview
11.3.2. Product Offerings
11.3.3. Financial Performance
11.3.4. Recent Initiatives
11.4. Medi GmbH & Co.
11.4.1. Company Overview
11.4.2. Product Offerings
11.4.3. Financial Performance
11.4.4. LTE Scientific
11.5. SIGVARIS
11.5.1. Company Overview
11.5.2. Product Offerings
11.5.3. Financial Performance
11.5.4. Recent Initiatives
11.6. BSN Medical GmbH
11.6.1. Company Overview
11.6.2. Product Offerings
11.6.3. Financial Performance
11.6.4. Recent Initiatives
11.7. ArjoHuntleigh
11.7.1. Company Overview
11.7.2. Product Offerings
11.7.3. Financial Performance
11.7.4. Recent Initiatives
11.8. 3M Health Care
11.8.1. Company Overview
11.8.2. Product Offerings
11.8.3. Financial Performance
11.8.4. Recent Initiatives
11.9. Spectrum Healthcare
11.9.1. Company Overview
11.9.2. Product Offerings
11.9.3. Financial Performance
11.9.4. Recent Initiatives
11.10. Bio Compression Systems, Inc.
11.10.1. Company Overview
11.10.2. Product Offerings
11.10.3. Financial Performance
11.10.4. Recent Initiatives
Chapter 12. Research Methodology
12.1. Primary Research
12.2. Secondary Research
12.3. Assumptions
Chapter 13. Appendix
13.1. About Us
13.2. Glossary of Terms
 Cross-segment Market Size and Analysis for
Mentioned Segments
Additional Company Profiles (Upto 5 With No Cost)
Additional Countries (Apart From Mentioned Countries)
Country/Region-specific Report
Go To Market Strategy
Region Specific Market DynamicsRegion Level Market Share Import Export AnalysisProduction AnalysisOthers
Cross-segment Market Size and Analysis for
Mentioned Segments
Additional Company Profiles (Upto 5 With No Cost)
Additional Countries (Apart From Mentioned Countries)
Country/Region-specific Report
Go To Market Strategy
Region Specific Market DynamicsRegion Level Market Share Import Export AnalysisProduction AnalysisOthers