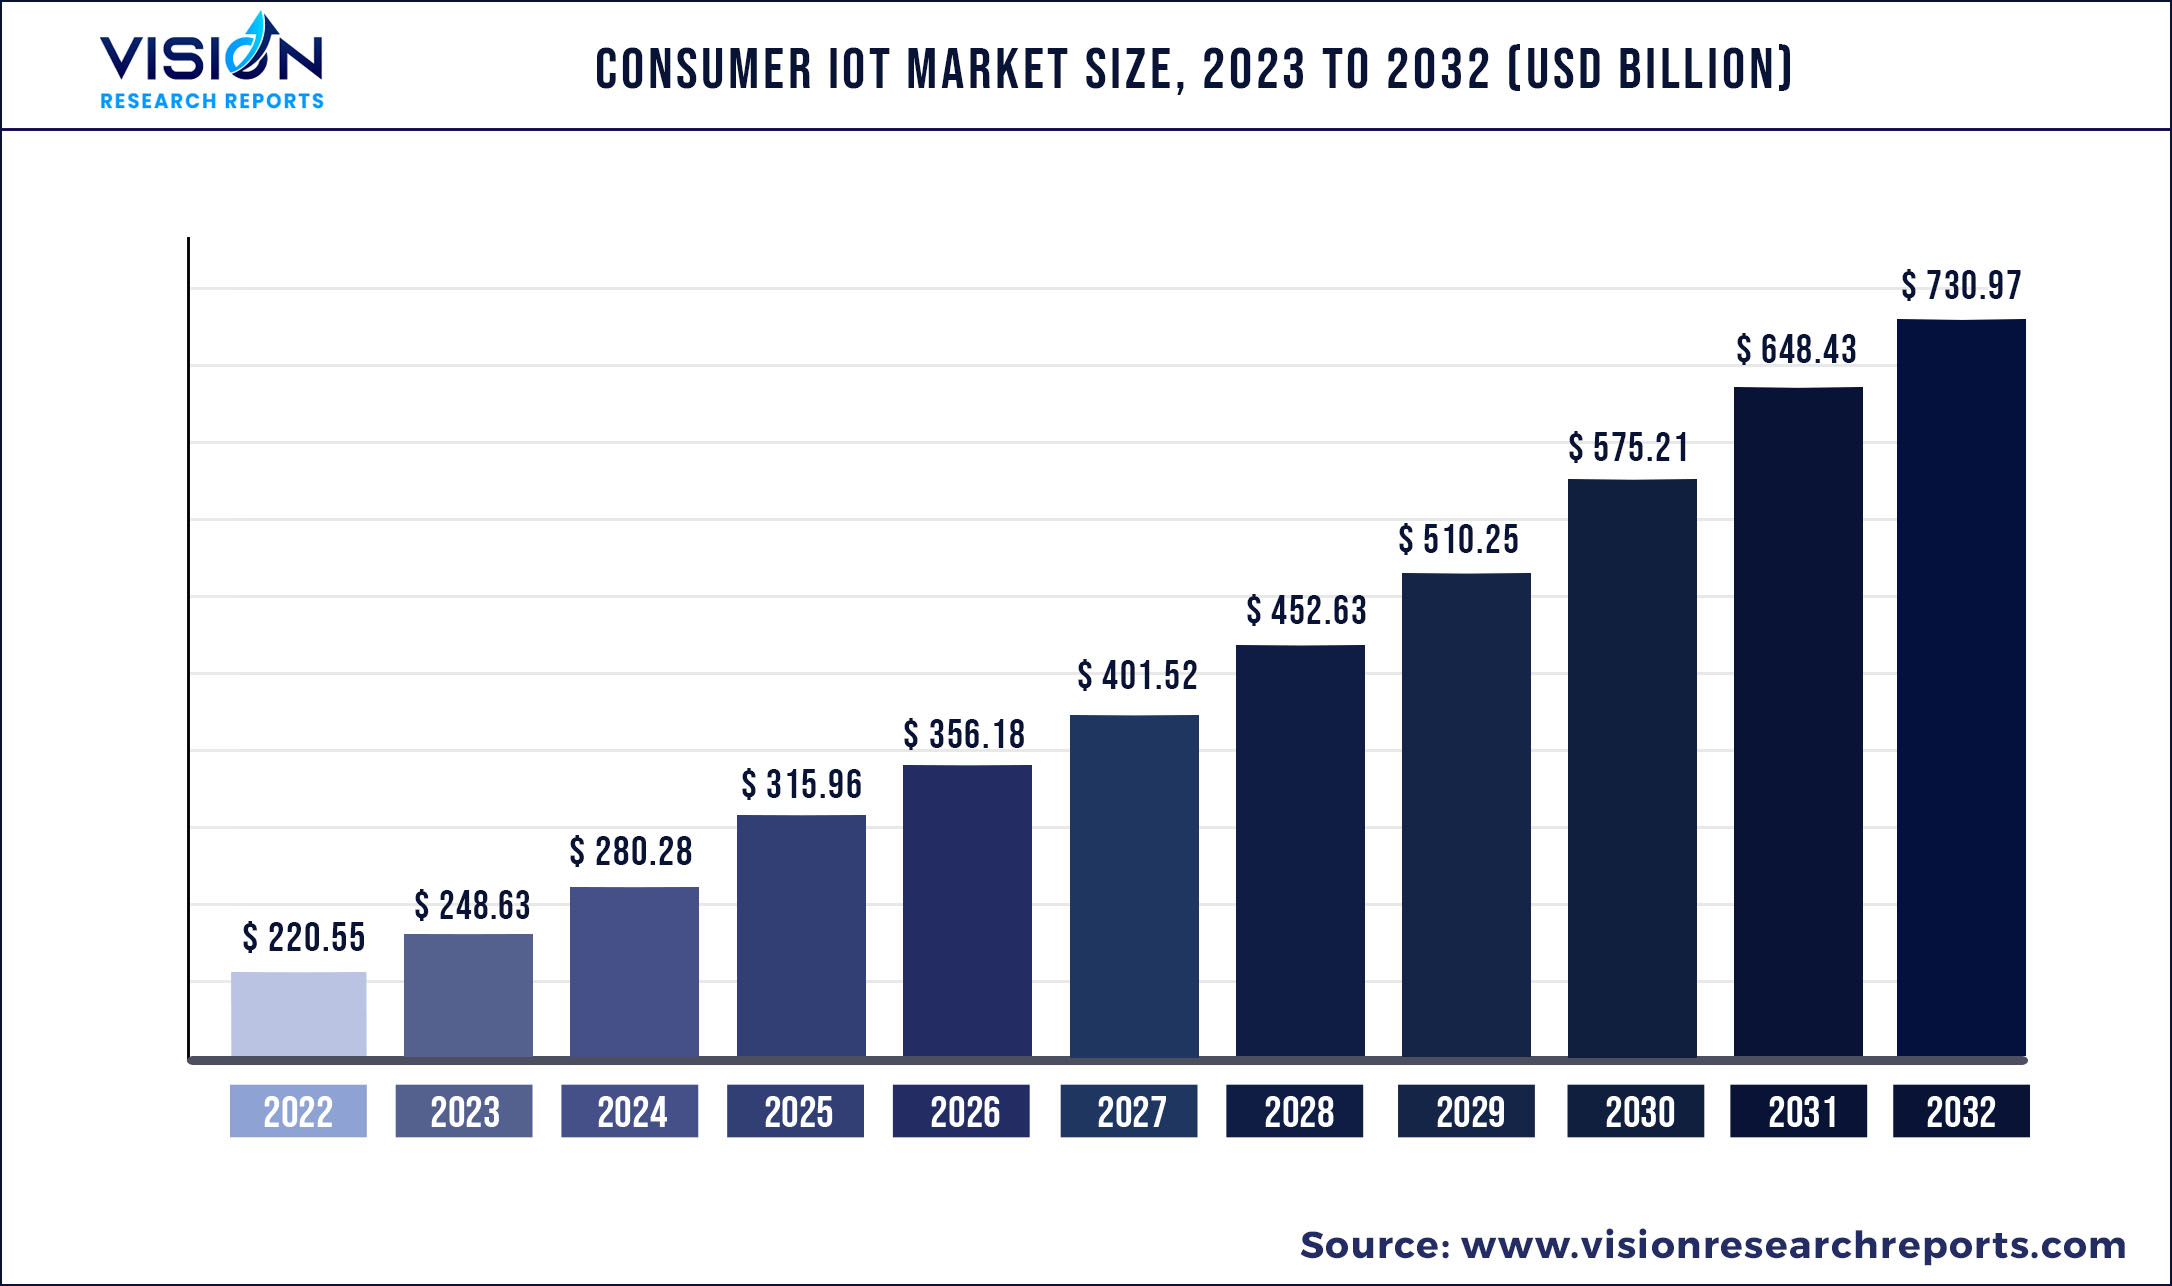
The global consumer IoT market was surpassed at USD 220.55 billion in 2022 and is expected to hit around USD 730.97 billion by 2032, growing at a CAGR of 12.73% from 2023 to 2032.
Key Pointers
| Report Coverage | Details |
| Market Size in 2022 | USD 220.55 billion |
| Revenue Forecast by 2032 | USD 730.97 billion |
| Growth rate from 2023 to 2032 | CAGR of 12.73% |
| Base Year | 2022 |
| Forecast Period | 2023 to 2032 |
| Regions Covered | North America, Europe, Asia Pacific, Latin America, Middle East & Africa |
| Companies Covered | Alphabet Inc.; Amazon.com, Inc.; Apple Inc.; AT&T, Cisco Systems, Inc.; Honeywell International Inc.; IBM Corp.; Intel Corp.; LG Corp.; Microsoft; Samsung; Schneider Electric; Sony Corp.; Texas Instruments; TE Connectivity |
The growth can be credited to the growing popularity of technologically advanced devices and home appliances. Consumer internet of things (IoT) devices are integrated with multiple microcontrollers and wireless technologies, making it easier to share data without direct interaction between the users or the computer. Consumer IoT refers to an interconnected system of digital and physical objects, such as smartphones, smart wearables, and smart home devices, designed for the consumer markets.
In the past few years, such devices have quickly become an integral part of day-to-day lives. A prominent example of these developments is Echo, a Bluetooth device by Amazon.com, Inc. It is powered by the company’s voice assistant Alexa, which is compatible with various smart home devices. The increasing demand for such devices is expected to create opportunities for the market of consumer internet of things in the coming years. The industry growth is further propelled by the increased adoption of personal wearables for monitoring health parameters.
Consumer IoT applications are playing a vital role in improving personal healthcare through IoT wearables that transmit data to patients and their doctors. In addition, their application is emerging as a common practice in various sports. Many consumer IoT devices help monitor heart rate, sleep, blood sugar, and other variables, thereby positively influencing the overall industry statistics.
The COVID-19 pandemic opened up new growth avenues for the overall market as the global health crisis created a greater need for solutions that can help obtain patient care remotely. The wearable devices, such as smartwatches and biosensors, helped healthcare professionals remotely monitor the ongoing health conditions of the patients, allowing observation and treatment that was earlier possible only in hospitals and clinics. The rising product adoption encouraged the industry players to develop new wearables to fulfill the increased consumer demand during the pandemic. For instance, in May 2020, Koninklijke Philips N.V. received CE marking and FDA approval for its wireless wearable biosensor designed for monitoring patients affected by the coronavirus.
Regional Insights
North America accounted for the largest share of more than 23.38% of the overall revenue in 2022 and is expected to grow significantly during the forecast period. This can be credited to the increased product demand, especially fitness tracking devices, in the region. According to a 2022 survey conducted by ValuePenguin on over 1,500 consumers, while 45% of Americans are already using smartwatches such as Fitbits and Apple Watches, 69% of respondents are willing to use a fitness tracker to get discounts on health insurance. Asia Pacific is expected to record a substantial CAGR from 2023 to 2030 with the growing popularity of smart home solutions in the region.
According to 2021 data released by the China Business Industry Research Institute, the smart home market in China expanded from USD 40.96 billion in 2016 to USD 91.08 billion in 2021. Moreover, the IoT developments across the Middle East and Africa (MEA) region, attributed to the government-initiated smart city projects to leverage long-term sustainability, are expected to propel the growth of the market across the MEA region. The regional market is estimated to grow at a significant rate during the forecast period.
Consumer IoT Market Segmentations:
By Component
By Connectivity Technology
By Application
Chapter 1. Introduction
1.1. Research Objective
1.2. Scope of the Study
1.3. Definition
Chapter 2. Research Methodology
2.1. Research Approach
2.2. Data Sources
2.3. Assumptions & Limitations
Chapter 3. Executive Summary
3.1. Market Snapshot
Chapter 4. Market Variables and Scope
4.1. Introduction
4.2. Market Classification and Scope
4.3. Industry Value Chain Analysis
4.3.1. Raw Material Procurement Analysis
4.3.2. Sales and Distribution Channel Analysis
4.3.3. Downstream Buyer Analysis
Chapter 5. COVID 19 Impact on Consumer IoT Market
5.1. COVID-19 Landscape: Consumer IoT Industry Impact
5.2. COVID 19 - Impact Assessment for the Industry
5.3. COVID 19 Impact: Global Major Government Policy
5.4. Market Trends and Opportunities in the COVID-19 Landscape
Chapter 6. Market Dynamics Analysis and Trends
6.1. Market Dynamics
6.1.1. Market Drivers
6.1.2. Market Restraints
6.1.3. Market Opportunities
6.2. Porter’s Five Forces Analysis
6.2.1. Bargaining power of suppliers
6.2.2. Bargaining power of buyers
6.2.3. Threat of substitute
6.2.4. Threat of new entrants
6.2.5. Degree of competition
Chapter 7. Competitive Landscape
7.1.1. Company Market Share/Positioning Analysis
7.1.2. Key Strategies Adopted by Players
7.1.3. Vendor Landscape
7.1.3.1. List of Suppliers
7.1.3.2. List of Buyers
Chapter 8. Global Consumer IoT Market, By Component
8.1. Consumer IoT Market, by Component, 2023-2032
8.1.1 Hardware
8.1.1.1. Market Revenue and Forecast (2020-2032)
8.1.2. Software
8.1.2.1. Market Revenue and Forecast (2020-2032)
8.1.3. Services
8.1.3.1. Market Revenue and Forecast (2020-2032)
Chapter 9. Global Consumer IoT Market, By Connectivity Technology
9.1. Consumer IoT Market, by Connectivity Technology, 2023-2032
9.1.1. Wired
9.1.1.1. Market Revenue and Forecast (2020-2032)
9.1.2. Wireless
9.1.2.1. Market Revenue and Forecast (2020-2032)
Chapter 10. Global Consumer IoT Market, By Application
10.1. Consumer IoT Market, by Application, 2023-2032
10.1.1. Consumer Electronics
10.1.1.1. Market Revenue and Forecast (2020-2032)
10.1.2. Healthcare
10.1.2.1. Market Revenue and Forecast (2020-2032)
10.1.3. Wearable Devices
10.1.3.1. Market Revenue and Forecast (2020-2032)
10.1.4. Automotive
10.1.4.1. Market Revenue and Forecast (2020-2032)
Chapter 11. Global Consumer IoT Market, Regional Estimates and Trend Forecast
11.1. North America
11.1.1. Market Revenue and Forecast, by Component (2020-2032)
11.1.2. Market Revenue and Forecast, by Connectivity Technology (2020-2032)
11.1.3. Market Revenue and Forecast, by Application (2020-2032)
11.1.4. U.S.
11.1.4.1. Market Revenue and Forecast, by Component (2020-2032)
11.1.4.2. Market Revenue and Forecast, by Connectivity Technology (2020-2032)
11.1.4.3. Market Revenue and Forecast, by Application (2020-2032)
11.1.5. Rest of North America
11.1.5.1. Market Revenue and Forecast, by Component (2020-2032)
11.1.5.2. Market Revenue and Forecast, by Connectivity Technology (2020-2032)
11.1.5.3. Market Revenue and Forecast, by Application (2020-2032)
11.2. Europe
11.2.1. Market Revenue and Forecast, by Component (2020-2032)
11.2.2. Market Revenue and Forecast, by Connectivity Technology (2020-2032)
11.2.3. Market Revenue and Forecast, by Application (2020-2032)
11.2.4. UK
11.2.4.1. Market Revenue and Forecast, by Component (2020-2032)
11.2.4.2. Market Revenue and Forecast, by Connectivity Technology (2020-2032)
11.2.4.3. Market Revenue and Forecast, by Application (2020-2032)
11.2.5. Germany
11.2.5.1. Market Revenue and Forecast, by Component (2020-2032)
11.2.5.2. Market Revenue and Forecast, by Connectivity Technology (2020-2032)
11.2.5.3. Market Revenue and Forecast, by Application (2020-2032)
11.2.6. France
11.2.6.1. Market Revenue and Forecast, by Component (2020-2032)
11.2.6.2. Market Revenue and Forecast, by Connectivity Technology (2020-2032)
11.2.6.3. Market Revenue and Forecast, by Application (2020-2032)
11.2.7. Rest of Europe
11.2.7.1. Market Revenue and Forecast, by Component (2020-2032)
11.2.7.2. Market Revenue and Forecast, by Connectivity Technology (2020-2032)
11.2.7.3. Market Revenue and Forecast, by Application (2020-2032)
11.3. APAC
11.3.1. Market Revenue and Forecast, by Component (2020-2032)
11.3.2. Market Revenue and Forecast, by Connectivity Technology (2020-2032)
11.3.3. Market Revenue and Forecast, by Application (2020-2032)
11.3.4. India
11.3.4.1. Market Revenue and Forecast, by Component (2020-2032)
11.3.4.2. Market Revenue and Forecast, by Connectivity Technology (2020-2032)
11.3.4.3. Market Revenue and Forecast, by Application (2020-2032)
11.3.5. China
11.3.5.1. Market Revenue and Forecast, by Component (2020-2032)
11.3.5.2. Market Revenue and Forecast, by Connectivity Technology (2020-2032)
11.3.5.3. Market Revenue and Forecast, by Application (2020-2032)
11.3.6. Japan
11.3.6.1. Market Revenue and Forecast, by Component (2020-2032)
11.3.6.2. Market Revenue and Forecast, by Connectivity Technology (2020-2032)
11.3.6.3. Market Revenue and Forecast, by Application (2020-2032)
11.3.7. Rest of APAC
11.3.7.1. Market Revenue and Forecast, by Component (2020-2032)
11.3.7.2. Market Revenue and Forecast, by Connectivity Technology (2020-2032)
11.3.7.3. Market Revenue and Forecast, by Application (2020-2032)
11.4. MEA
11.4.1. Market Revenue and Forecast, by Component (2020-2032)
11.4.2. Market Revenue and Forecast, by Connectivity Technology (2020-2032)
11.4.3. Market Revenue and Forecast, by Application (2020-2032)
11.4.4. GCC
11.4.4.1. Market Revenue and Forecast, by Component (2020-2032)
11.4.4.2. Market Revenue and Forecast, by Connectivity Technology (2020-2032)
11.4.4.3. Market Revenue and Forecast, by Application (2020-2032)
11.4.5. North Africa
11.4.5.1. Market Revenue and Forecast, by Component (2020-2032)
11.4.5.2. Market Revenue and Forecast, by Connectivity Technology (2020-2032)
11.4.5.3. Market Revenue and Forecast, by Application (2020-2032)
11.4.6. South Africa
11.4.6.1. Market Revenue and Forecast, by Component (2020-2032)
11.4.6.2. Market Revenue and Forecast, by Connectivity Technology (2020-2032)
11.4.6.3. Market Revenue and Forecast, by Application (2020-2032)
11.4.7. Rest of MEA
11.4.7.1. Market Revenue and Forecast, by Component (2020-2032)
11.4.7.2. Market Revenue and Forecast, by Connectivity Technology (2020-2032)
11.4.7.3. Market Revenue and Forecast, by Application (2020-2032)
11.5. Latin America
11.5.1. Market Revenue and Forecast, by Component (2020-2032)
11.5.2. Market Revenue and Forecast, by Connectivity Technology (2020-2032)
11.5.3. Market Revenue and Forecast, by Application (2020-2032)
11.5.4. Brazil
11.5.4.1. Market Revenue and Forecast, by Component (2020-2032)
11.5.4.2. Market Revenue and Forecast, by Connectivity Technology (2020-2032)
11.5.4.3. Market Revenue and Forecast, by Application (2020-2032)
11.5.5. Rest of LATAM
11.5.5.1. Market Revenue and Forecast, by Component (2020-2032)
11.5.5.2. Market Revenue and Forecast, by Connectivity Technology (2020-2032)
11.5.5.3. Market Revenue and Forecast, by Application (2020-2032)
Chapter 12. Company Profiles
12.1. Alphabet Inc.
12.1.1. Company Overview
12.1.2. Product Offerings
12.1.3. Financial Performance
12.1.4. Recent Initiatives
12.2. Amazon.com, Inc.
12.2.1. Company Overview
12.2.2. Product Offerings
12.2.3. Financial Performance
12.2.4. Recent Initiatives
12.3. Apple Inc.
12.3.1. Company Overview
12.3.2. Product Offerings
12.3.3. Financial Performance
12.3.4. Recent Initiatives
12.4. AT&T
12.4.1. Company Overview
12.4.2. Product Offerings
12.4.3. Financial Performance
12.4.4. Recent Initiatives
12.5. Cisco Systems, Inc.
12.5.1. Company Overview
12.5.2. Product Offerings
12.5.3. Financial Performance
12.5.4. Recent Initiatives
12.6. Honeywell International Inc.
12.6.1. Company Overview
12.6.2. Product Offerings
12.6.3. Financial Performance
12.6.4. Recent Initiatives
12.7. IBM Corp.
12.7.1. Company Overview
12.7.2. Product Offerings
12.7.3. Financial Performance
12.7.4. Recent Initiatives
12.8. Intel Corp.
12.8.1. Company Overview
12.8.2. Product Offerings
12.8.3. Financial Performance
12.8.4. Recent Initiatives
12.9. LG Corp.
12.9.1. Company Overview
12.9.2. Product Offerings
12.9.3. Financial Performance
12.9.4. Recent Initiatives
12.10. Microsoft
12.10.1. Company Overview
12.10.2. Product Offerings
12.10.3. Financial Performance
12.10.4. Recent Initiatives
Chapter 13. Research Methodology
13.1. Primary Research
13.2. Secondary Research
13.3. Assumptions
Chapter 14. Appendix
14.1. About Us
14.2. Glossary of Terms
 Cross-segment Market Size and Analysis for
Mentioned Segments
Additional Company Profiles (Upto 5 With No Cost)
Additional Countries (Apart From Mentioned Countries)
Country/Region-specific Report
Go To Market Strategy
Region Specific Market DynamicsRegion Level Market Share Import Export AnalysisProduction AnalysisOthers
Cross-segment Market Size and Analysis for
Mentioned Segments
Additional Company Profiles (Upto 5 With No Cost)
Additional Countries (Apart From Mentioned Countries)
Country/Region-specific Report
Go To Market Strategy
Region Specific Market DynamicsRegion Level Market Share Import Export AnalysisProduction AnalysisOthers