Data Center Automation Market Size, Share | Report 2023-2032
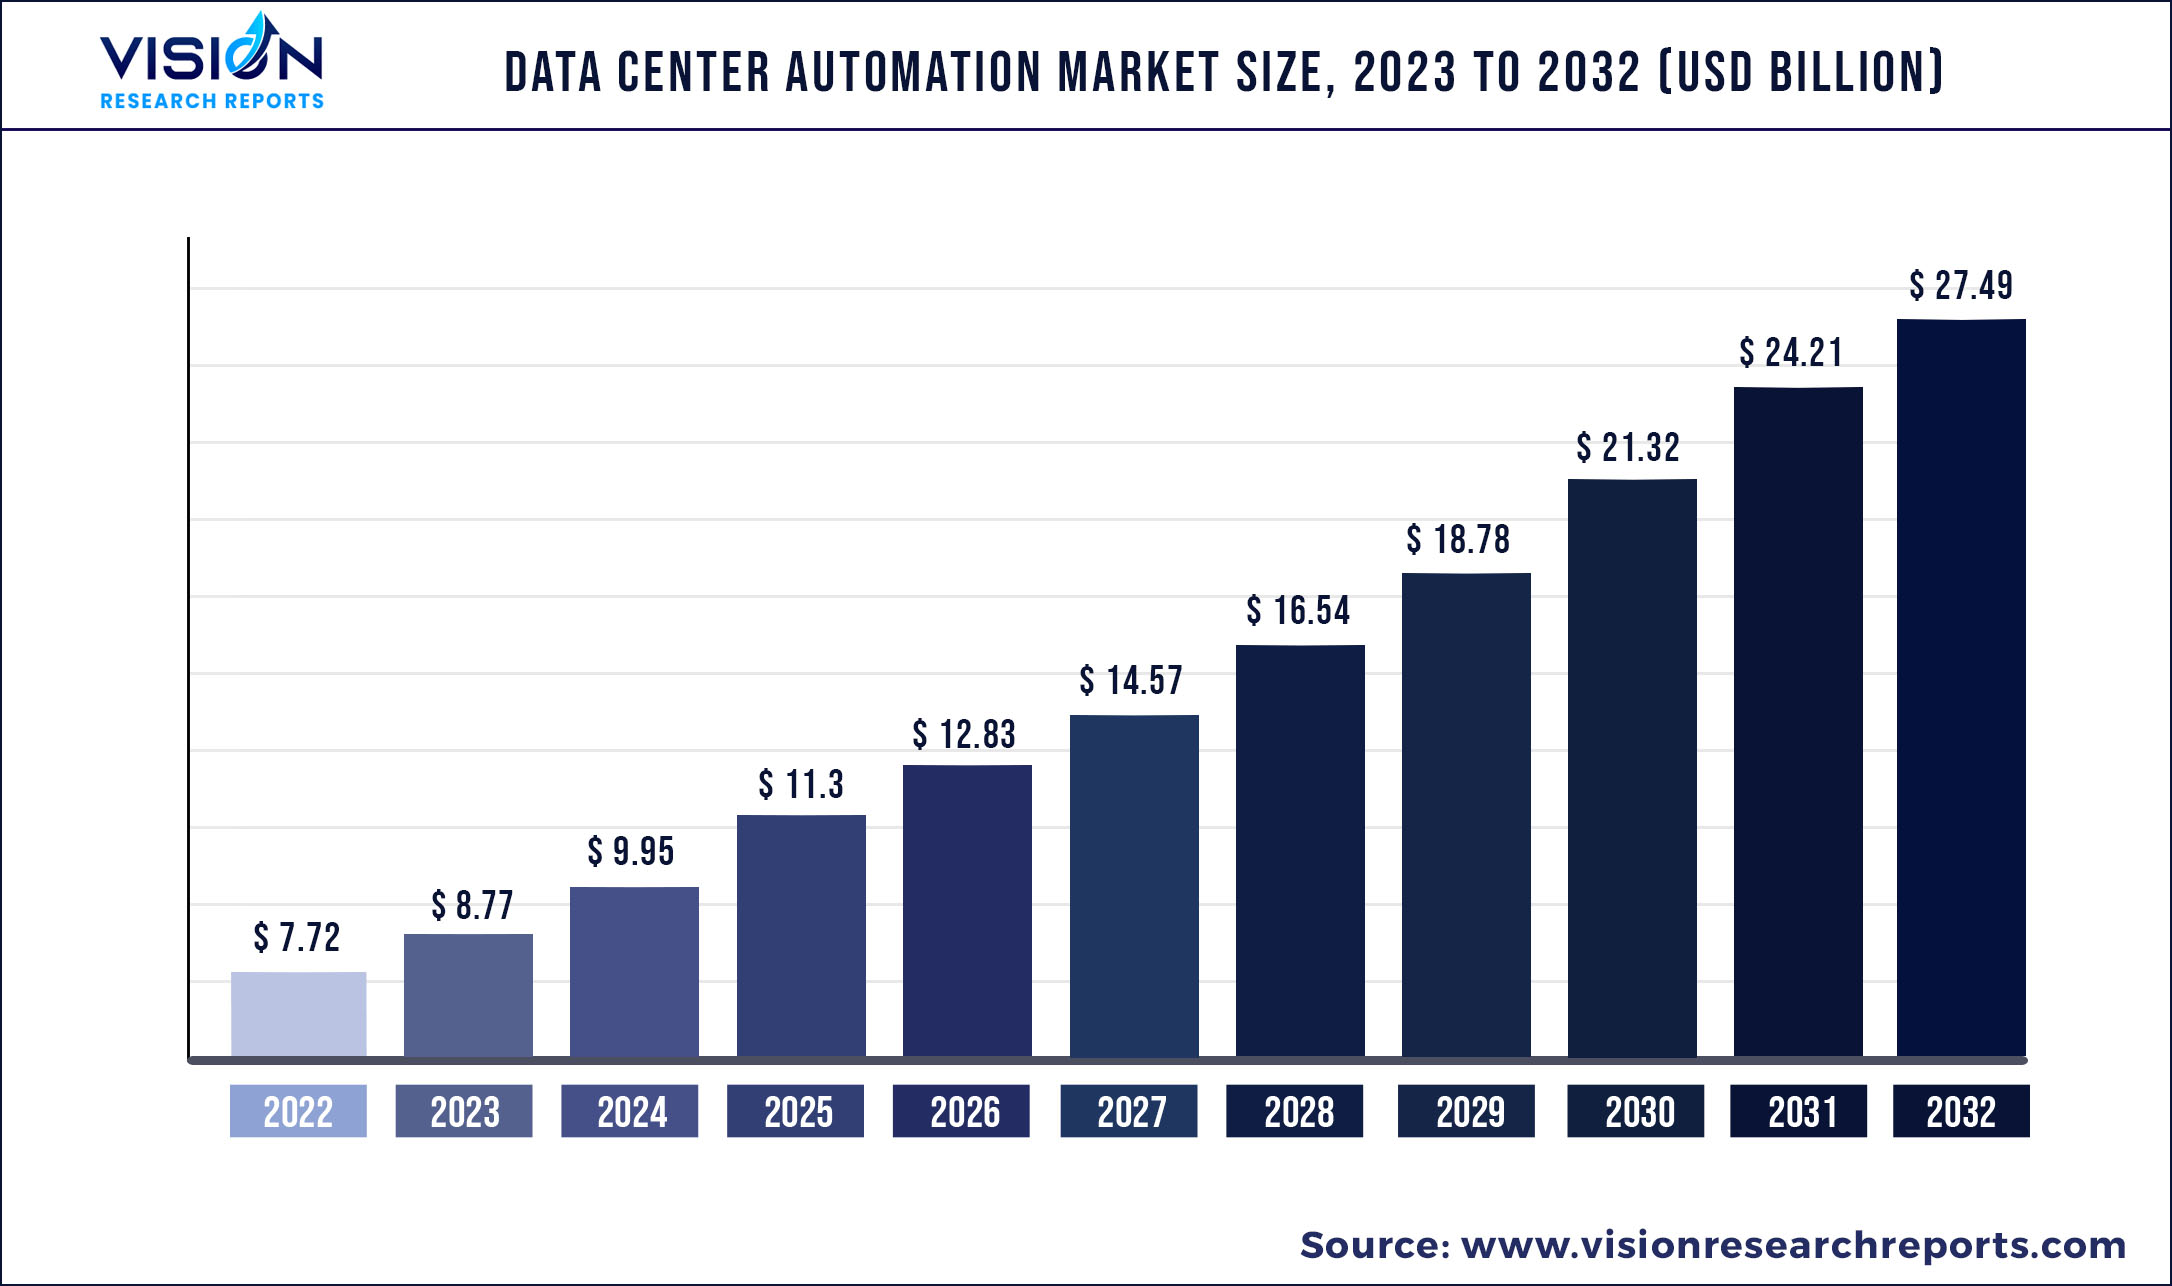
The global data center automation market was surpassed at USD 7.72 billion in 2022 and is expected to hit around USD 27.49 billion by 2032, growing at a CAGR of 13.54% from 2023 to 2032.
Key Pointers
Report Scope of the Data Center Automation Market
| Report Coverage | Details |
| Market Size in 2022 | USD 7.72 billion |
| Revenue Forecast by 2032 | USD 27.49 billion |
| Growth rate from 2023 to 2032 | CAGR of 13.54% |
| Base Year | 2022 |
| Forecast Period | 2023 to 2032 |
| Regions Covered | North America, Europe, Asia Pacific, Latin America, Middle East & Africa |
The growth of the market is driven by the increasing deployment of 5G networking technologies and the popularity of hybrid cloud architectures. As businesses spend more money on establishing a reliable data center infrastructure, the demand for data center automation is rising. The unexpected COVID-19 outbreak presented substantial growth potential for the market for data centers. Although the lockout initially halted the market, the surge in cloud computing use, mainly due to the developing work-from-home culture and rising popularity of mobile streaming apps, is expected to create lucrative development possibilities for the market during the forecast period.
The pandemic significantly impacted the desire for automated solutions. Due to the pandemic and other health and safety issues, companies have adopted data automation for production. People became more concerned about their privacy and security, which led to a surge in the automation industry. The digitization of healthcare data, for instance, has significantly expanded its volume and portability. The growing use of digital Electronic Health Records (EHRs) and online prescriptions tend to increase storage demands among healthcare providers, prompting them to invest in data centers. In November 2022, Hartford HealthCare collaborated with Google Cloud to expedite the health system's digital transformation, data analytics, and patient access. The two organizations would collaborate to unlock the potential of Hartford HealthCare's patient data, which is often hard to acquire and utilize as it is unorganized or difficult to locate in ever-more-complex EHRs.
Regional Insights
North America dominated the market with a revenue share of 47.83% in 2022. Numerous organizations increasing the adoption of cloud computing solutions is driving the market for data center automation. Consequently, numerous market participants in the region are increasing their investments in cloud computing services. Even more, companies are dedicated to providing data center automation services.
Asia Pacific is expected to grow at the highest CAGR of 15.95% during the forecast period. Countries such as Japan, China, and India, among others, are spending heavily on the IT infrastructure and development of new data centers to maintain the ever-increasing data volume in their respective regions. In addition, a large number of small and medium-sized businesses and their increasing adoption of cloud computing create lucrative growth potential for the Asia-Pacific data center automation market.
Key Companies & Market Share Insights
The market's competitive landscape is fragmented due to the presence of numerous global and regional market players. In order to survive in a highly competitive industry and expand their business footprints, market leaders are implementing strategies such as partnerships, collaborations, and product launches. In November 2021, Microsoft launched its sustainable data center zone in Sweden, generating new potential for a cloud-first Sweden. The new data center region offers the company’s sustainability investment, powering the center with 100 percent carbon-free energy. It supports zero-waste operations emphasizing Microsoft's ongoing investment to help in creating long-term opportunities in Sweden's public and commercial sectors. Some of the prominent players operating in the global data center automation market include:
Data Center Automation Market Segmentations:
| By Component | By Solution | By Deployment | By Enterprise | By End-Use |
|
Solution Services |
Storage Network Server |
On-Premise Cloud |
Large Size Enterprises Small and Medium Sized Enterprises (SMEs) |
Manufacturing BFSI Healthcare Retail IT & telecommunication Others |
Chapter 1. Introduction
1.1. Research Objective
1.2. Scope of the Study
1.3. Definition
Chapter 2. Research Methodology
2.1. Research Approach
2.2. Data Sources
2.3. Assumptions & Limitations
Chapter 3. Executive Summary
3.1. Market Snapshot
Chapter 4. Market Variables and Scope
4.1. Introduction
4.2. Market Classification and Scope
4.3. Industry Value Chain Analysis
4.3.1. Raw Material Procurement Analysis
4.3.2. Sales and Distribution Channel Analysis
4.3.3. Downstream Buyer Analysis
Chapter 5. COVID 19 Impact on Data Center Automation Market
5.1. COVID-19 Landscape: Data Center Automation Industry Impact
5.2. COVID 19 - Impact Assessment for the Industry
5.3. COVID 19 Impact: Global Major Government Policy
5.4. Market Trends and Opportunities in the COVID-19 Landscape
Chapter 6. Market Dynamics Analysis and Trends
6.1. Market Dynamics
6.1.1. Market Drivers
6.1.2. Market Restraints
6.1.3. Market Opportunities
6.2. Porter’s Five Forces Analysis
6.2.1. Bargaining power of suppliers
6.2.2. Bargaining power of buyers
6.2.3. Threat of substitute
6.2.4. Threat of new entrants
6.2.5. Degree of competition
Chapter 7. Competitive Landscape
7.1.1. Company Market Share/Positioning Analysis
7.1.2. Key Strategies Adopted by Players
7.1.3. Vendor Landscape
7.1.3.1. List of Suppliers
7.1.3.2. List of Buyers
Chapter 8. Global Data Center Automation Market, By Component
8.1. Data Center Automation Market, by Component, 2023-2032
8.1.1. Solution
8.1.1.1. Market Revenue and Forecast (2020-2032)
8.1.2. Services
8.1.2.1. Market Revenue and Forecast (2020-2032)
Chapter 9. Global Data Center Automation Market, By Solution
9.1. Data Center Automation Market, by Solution, 2023-2032
9.1.1. Solution
9.1.1.1. Market Revenue and Forecast (2020-2032)
9.1.2. Network
9.1.2.1. Market Revenue and Forecast (2020-2032)
9.1.3. Server
9.1.3.1. Market Revenue and Forecast (2020-2032)
Chapter 10. Global Data Center Automation Market, By Deployment
10.1. Data Center Automation Market, by Deployment, 2023-2032
10.1.1. On-Premise
10.1.1.1. Market Revenue and Forecast (2020-2032)
10.1.2. Cloud
10.1.2.1. Market Revenue and Forecast (2020-2032)
Chapter 11. Global Data Center Automation Market, By Enterprise
11.1. Data Center Automation Market, by Enterprise, 2023-2032
11.1.1. Large Size Enterprises
11.1.1.1. Market Revenue and Forecast (2020-2032)
11.1.2. Small and Medium Sized Enterprises (SMEs)
11.1.2.1. Market Revenue and Forecast (2020-2032)
Chapter 12. Global Data Center Automation Market, By End-Use
12.1. Data Center Automation Market, by End-Use, 2023-2032
12.1.1. Manufacturing
12.1.1.1. Market Revenue and Forecast (2020-2032)
12.1.2. BFSI
12.1.2.1. Market Revenue and Forecast (2020-2032)
12.1.3. Healthcare
12.1.3.1. Market Revenue and Forecast (2020-2032)
12.1.4. Retail
12.1.4.1. Market Revenue and Forecast (2020-2032)
12.1.5. IT & telecommunication
12.1.5.1. Market Revenue and Forecast (2020-2032)
12.1.6. Others
12.1.6.1. Market Revenue and Forecast (2020-2032)
Chapter 13. Global Data Center Automation Market, Regional Estimates and Trend Forecast
13.1. North America
13.1.1. Market Revenue and Forecast, by Component (2020-2032)
13.1.2. Market Revenue and Forecast, by Solution (2020-2032)
13.1.3. Market Revenue and Forecast, by Deployment (2020-2032)
13.1.4. Market Revenue and Forecast, by Enterprise (2020-2032)
13.1.5. Market Revenue and Forecast, by End-Use (2020-2032)
13.1.6. U.S.
13.1.6.1. Market Revenue and Forecast, by Component (2020-2032)
13.1.6.2. Market Revenue and Forecast, by Solution (2020-2032)
13.1.6.3. Market Revenue and Forecast, by Deployment (2020-2032)
13.1.6.4. Market Revenue and Forecast, by Enterprise (2020-2032)
13.1.7. Market Revenue and Forecast, by End-Use (2020-2032)
13.1.8. Rest of North America
13.1.8.1. Market Revenue and Forecast, by Component (2020-2032)
13.1.8.2. Market Revenue and Forecast, by Solution (2020-2032)
13.1.8.3. Market Revenue and Forecast, by Deployment (2020-2032)
13.1.8.4. Market Revenue and Forecast, by Enterprise (2020-2032)
13.1.8.5. Market Revenue and Forecast, by End-Use (2020-2032)
13.2. Europe
13.2.1. Market Revenue and Forecast, by Component (2020-2032)
13.2.2. Market Revenue and Forecast, by Solution (2020-2032)
13.2.3. Market Revenue and Forecast, by Deployment (2020-2032)
13.2.4. Market Revenue and Forecast, by Enterprise (2020-2032)
13.2.5. Market Revenue and Forecast, by End-Use (2020-2032)
13.2.6. UK
13.2.6.1. Market Revenue and Forecast, by Component (2020-2032)
13.2.6.2. Market Revenue and Forecast, by Solution (2020-2032)
13.2.6.3. Market Revenue and Forecast, by Deployment (2020-2032)
13.2.7. Market Revenue and Forecast, by Enterprise (2020-2032)
13.2.8. Market Revenue and Forecast, by End-Use (2020-2032)
13.2.9. Germany
13.2.9.1. Market Revenue and Forecast, by Component (2020-2032)
13.2.9.2. Market Revenue and Forecast, by Solution (2020-2032)
13.2.9.3. Market Revenue and Forecast, by Deployment (2020-2032)
13.2.10. Market Revenue and Forecast, by Enterprise (2020-2032)
13.2.11. Market Revenue and Forecast, by End-Use (2020-2032)
13.2.12. France
13.2.12.1. Market Revenue and Forecast, by Component (2020-2032)
13.2.12.2. Market Revenue and Forecast, by Solution (2020-2032)
13.2.12.3. Market Revenue and Forecast, by Deployment (2020-2032)
13.2.12.4. Market Revenue and Forecast, by Enterprise (2020-2032)
13.2.13. Market Revenue and Forecast, by End-Use (2020-2032)
13.2.14. Rest of Europe
13.2.14.1. Market Revenue and Forecast, by Component (2020-2032)
13.2.14.2. Market Revenue and Forecast, by Solution (2020-2032)
13.2.14.3. Market Revenue and Forecast, by Deployment (2020-2032)
13.2.14.4. Market Revenue and Forecast, by Enterprise (2020-2032)
13.2.15. Market Revenue and Forecast, by End-Use (2020-2032)
13.3. APAC
13.3.1. Market Revenue and Forecast, by Component (2020-2032)
13.3.2. Market Revenue and Forecast, by Solution (2020-2032)
13.3.3. Market Revenue and Forecast, by Deployment (2020-2032)
13.3.4. Market Revenue and Forecast, by Enterprise (2020-2032)
13.3.5. Market Revenue and Forecast, by End-Use (2020-2032)
13.3.6. India
13.3.6.1. Market Revenue and Forecast, by Component (2020-2032)
13.3.6.2. Market Revenue and Forecast, by Solution (2020-2032)
13.3.6.3. Market Revenue and Forecast, by Deployment (2020-2032)
13.3.6.4. Market Revenue and Forecast, by Enterprise (2020-2032)
13.3.7. Market Revenue and Forecast, by End-Use (2020-2032)
13.3.8. China
13.3.8.1. Market Revenue and Forecast, by Component (2020-2032)
13.3.8.2. Market Revenue and Forecast, by Solution (2020-2032)
13.3.8.3. Market Revenue and Forecast, by Deployment (2020-2032)
13.3.8.4. Market Revenue and Forecast, by Enterprise (2020-2032)
13.3.9. Market Revenue and Forecast, by End-Use (2020-2032)
13.3.10. Japan
13.3.10.1. Market Revenue and Forecast, by Component (2020-2032)
13.3.10.2. Market Revenue and Forecast, by Solution (2020-2032)
13.3.10.3. Market Revenue and Forecast, by Deployment (2020-2032)
13.3.10.4. Market Revenue and Forecast, by Enterprise (2020-2032)
13.3.10.5. Market Revenue and Forecast, by End-Use (2020-2032)
13.3.11. Rest of APAC
13.3.11.1. Market Revenue and Forecast, by Component (2020-2032)
13.3.11.2. Market Revenue and Forecast, by Solution (2020-2032)
13.3.11.3. Market Revenue and Forecast, by Deployment (2020-2032)
13.3.11.4. Market Revenue and Forecast, by Enterprise (2020-2032)
13.3.11.5. Market Revenue and Forecast, by End-Use (2020-2032)
13.4. MEA
13.4.1. Market Revenue and Forecast, by Component (2020-2032)
13.4.2. Market Revenue and Forecast, by Solution (2020-2032)
13.4.3. Market Revenue and Forecast, by Deployment (2020-2032)
13.4.4. Market Revenue and Forecast, by Enterprise (2020-2032)
13.4.5. Market Revenue and Forecast, by End-Use (2020-2032)
13.4.6. GCC
13.4.6.1. Market Revenue and Forecast, by Component (2020-2032)
13.4.6.2. Market Revenue and Forecast, by Solution (2020-2032)
13.4.6.3. Market Revenue and Forecast, by Deployment (2020-2032)
13.4.6.4. Market Revenue and Forecast, by Enterprise (2020-2032)
13.4.7. Market Revenue and Forecast, by End-Use (2020-2032)
13.4.8. North Africa
13.4.8.1. Market Revenue and Forecast, by Component (2020-2032)
13.4.8.2. Market Revenue and Forecast, by Solution (2020-2032)
13.4.8.3. Market Revenue and Forecast, by Deployment (2020-2032)
13.4.8.4. Market Revenue and Forecast, by Enterprise (2020-2032)
13.4.9. Market Revenue and Forecast, by End-Use (2020-2032)
13.4.10. South Africa
13.4.10.1. Market Revenue and Forecast, by Component (2020-2032)
13.4.10.2. Market Revenue and Forecast, by Solution (2020-2032)
13.4.10.3. Market Revenue and Forecast, by Deployment (2020-2032)
13.4.10.4. Market Revenue and Forecast, by Enterprise (2020-2032)
13.4.10.5. Market Revenue and Forecast, by End-Use (2020-2032)
13.4.11. Rest of MEA
13.4.11.1. Market Revenue and Forecast, by Component (2020-2032)
13.4.11.2. Market Revenue and Forecast, by Solution (2020-2032)
13.4.11.3. Market Revenue and Forecast, by Deployment (2020-2032)
13.4.11.4. Market Revenue and Forecast, by Enterprise (2020-2032)
13.4.11.5. Market Revenue and Forecast, by End-Use (2020-2032)
13.5. Latin America
13.5.1. Market Revenue and Forecast, by Component (2020-2032)
13.5.2. Market Revenue and Forecast, by Solution (2020-2032)
13.5.3. Market Revenue and Forecast, by Deployment (2020-2032)
13.5.4. Market Revenue and Forecast, by Enterprise (2020-2032)
13.5.5. Market Revenue and Forecast, by End-Use (2020-2032)
13.5.6. Brazil
13.5.6.1. Market Revenue and Forecast, by Component (2020-2032)
13.5.6.2. Market Revenue and Forecast, by Solution (2020-2032)
13.5.6.3. Market Revenue and Forecast, by Deployment (2020-2032)
13.5.6.4. Market Revenue and Forecast, by Enterprise (2020-2032)
13.5.7. Market Revenue and Forecast, by End-Use (2020-2032)
13.5.8. Rest of LATAM
13.5.8.1. Market Revenue and Forecast, by Component (2020-2032)
13.5.8.2. Market Revenue and Forecast, by Solution (2020-2032)
13.5.8.3. Market Revenue and Forecast, by Deployment (2020-2032)
13.5.8.4. Market Revenue and Forecast, by Enterprise (2020-2032)
13.5.8.5. Market Revenue and Forecast, by End-Use (2020-2032)
Chapter 14. Company Profiles
14.1. Cisco Systems, Inc.
14.1.1. Company Overview
14.1.2. Product Offerings
14.1.3. Financial Performance
14.1.4. Recent Initiatives
14.2. ABB
14.2.1. Company Overview
14.2.2. Product Offerings
14.2.3. Financial Performance
14.2.4. Recent Initiatives
14.3. Oracle
14.3.1. Company Overview
14.3.2. Product Offerings
14.3.3. Financial Performance
14.3.4. Recent Initiatives
14.4. VMWare
14.4.1. Company Overview
14.4.2. Product Offerings
14.4.3. Financial Performance
14.4.4. Recent Initiatives
14.5. Hewlett Packard Enterprise Development LP
14.5.1. Company Overview
14.5.2. Product Offerings
14.5.3. Financial Performance
14.5.4. Recent Initiatives
14.6. BMC Software, Inc.
14.6.1. Company Overview
14.6.2. Product Offerings
14.6.3. Financial Performance
14.6.4. Recent Initiatives
14.7. Microsoft
14.7.1. Company Overview
14.7.2. Product Offerings
14.7.3. Financial Performance
14.7.4. Recent Initiatives
14.8. Citrix Systems, Inc.
14.8.1. Company Overview
14.8.2. Product Offerings
14.8.3. Financial Performance
14.8.4. Recent Initiatives
14.9. ServiceNow
14.9.1. Company Overview
14.9.2. Product Offerings
14.9.3. Financial Performance
14.9.4. Recent Initiatives
14.10. FUJITSU
14.10.1. Company Overview
14.10.2. Product Offerings
14.10.3. Financial Performance
14.10.4. Recent Initiatives
Chapter 15. Research Methodology
15.1. Primary Research
15.2. Secondary Research
15.3. Assumptions
Chapter 16. Appendix
16.1. About Us
16.2. Glossary of Terms
 Cross-segment Market Size and Analysis for
Mentioned Segments
Additional Company Profiles (Upto 5 With No Cost)
Additional Countries (Apart From Mentioned Countries)
Country/Region-specific Report
Go To Market Strategy
Region Specific Market DynamicsRegion Level Market Share Import Export AnalysisProduction AnalysisOthers
Cross-segment Market Size and Analysis for
Mentioned Segments
Additional Company Profiles (Upto 5 With No Cost)
Additional Countries (Apart From Mentioned Countries)
Country/Region-specific Report
Go To Market Strategy
Region Specific Market DynamicsRegion Level Market Share Import Export AnalysisProduction AnalysisOthers