Dermatoscope Market Size, Growth, Trends | Report 2023-2032
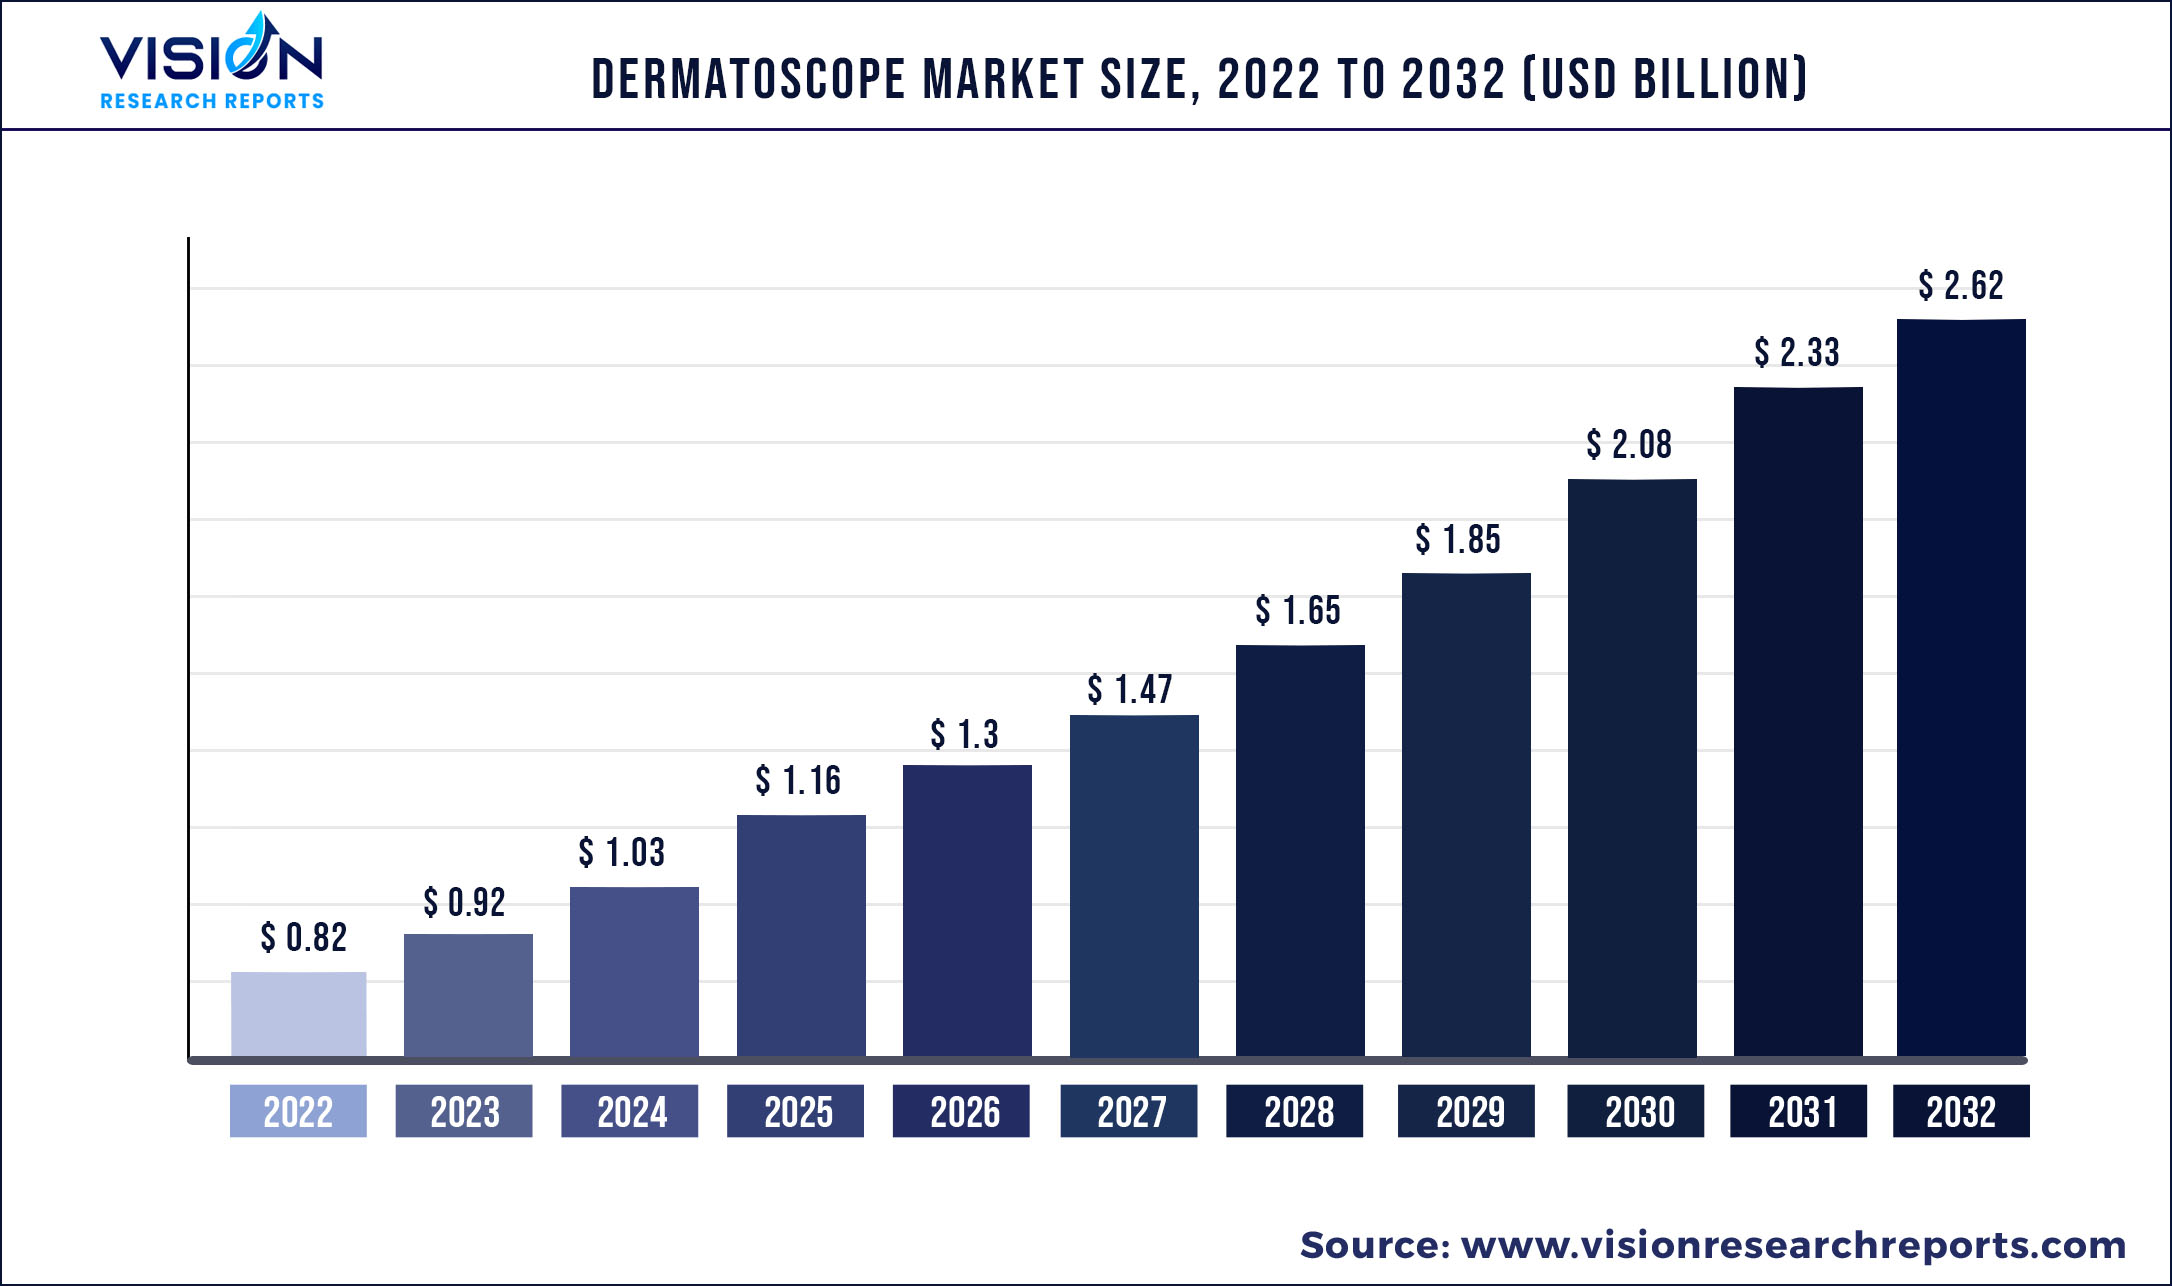
The global dermatoscope market size was estimated at around USD 0.82 billion in 2022 and it is projected to hit around USD 2.62 billion by 2032, growing at a CAGR of 12.33% from 2023 to 2032.
Report Highlights
Dermatoscopy plays a vital role in screening for skin cancer, which has resulted in the early detection and identification of pigmented lesions. Benign pigmented moles possess a certain risk of developing melanoma.
The incidence of several skin conditions has increased during the COVID-19 pandemic. Contact dermatitis, pressure urticaria, pressure injury, itching, seborrheic dermatitis, acne, and worsening of pre-existing skin diseases. The Dermatology Practical & Conceptual conducted a survey on 678 dermatologists to investigate the impact of the coronavirus disease 2019 outbreak on the daily practice of dermatologists working with skin cancer patients. This survey stated that there was a 75% reduction in daily work activity and 118 dermatologists experienced telemedicine for the first time. However, with the ease in the restrictions, the aesthetic industry is again witnessing lucrative growth rate.
Skin cancer is a chronic disease affecting a large population of the world. The rising incidence of melanoma and nonmelanoma skin cancers is providing an upthrust to the market. Certain moles, such as giant congenital pigmented hairy moles, are at high risk of developing melanoma. This has boosted the need for effective diagnosis with dermatoscopes.
Early detection of skin cancer has been proven to be very useful in its effective treatment. Hence, a rising number of awareness campaigns is estimated to fuel the demand for dermatoscopes, which is anticipated to propel the market. Earlier, the usage of these technologically advanced devices was limited to the detection of noninvasive melanoma. However, with technological advancements, their application has widened to the advanced diagnosis of various skin disorders.
North America region is currently the dominant region in terms of market share in dermatoscopes market. High prevalence of skin diseases, the presence of advanced healthcare infrastructure, presence of medical device manufacturers, and huge economic development are some of the major factors propels the North America dermatoscopes market.
| Report Coverage | Details |
| Market Size in 2022 | USD 0.82 billion |
| Revenue Forecast by 2032 | USD 2.62 billion |
| Growth rate from 2023 to 2032 | CAGR of 12.33% |
| Base Year | 2022 |
| Forecast Period | 2023 to 2032 |
| Segmentation | Product, technology, modality, end-use, region |
| Companies Covered | Canfield Scientific, Inc.; 3Gen; FotoFinder Systems, Inc.; Optilia; HEINE Optotechnik GmbH & Co. KG; Caliber Imaging & Diagnostics, Inc.; Firefly Global; ILLUCO Corporation Ltd.; Welch Allyn; Bio-Therapeutic, Inc. |
Product Insights
Contact dermatoscopes held the largest share of 37.36% in the market in 2022. Many of these devices are available, such as those with LED or halogen bulbs, optical lenses, and power sources that include rechargeable batteries.
Hybrid dermatoscopes are poised to exhibit lucrative growth in the forecast period. These novel medical devices possess qualities of contact as well as noncontact dermatoscopes. They also combine polarized and non-polarized modes for purpose of imaging. The Dermlite DL200 developed by 3Gen Company is a hybrid dermatoscope that combines non-polarized and polarized illumination for enhanced visualization of vascular structures and pigment.
In 2022, noncontact dermatoscopes held a significant share of the market. These instruments are new-age medical devices that exhibit increased efficiency and effectiveness. They aid in the early detection of skin melanoma and other lesions owing to which their adoption is rising.
Technology Insights
Based on technology, LED dominated the dermatoscopes market in 2022 with 42.43% shares. It is also anticipated to exhibit the fastest growth in the forecast period. This technology is being increasingly used as LEDs produce less heat during illumination and prevent accidental fatalities. The illumination offered by these bulbs is also brighter than xenon and halogen bulbs.
Xenon technology and halogen lights are likely to account for relatively smaller shares in the market throughout the forecast period. Halogens produce a large quantity of heat, which can cause fatalities in medical settings where they are used. Similarly, xenon lights have several disadvantages.
Ultraviolet technology is expected to witness a lucrative CAGR during the forecast period owing to its introduction as a novel technology in the field of dermatoscopy. Lumio UV, manufactured by 3Gen, helps capture clinical images quickly and easily in the workplace with high-resolution image quality and ultraviolet light.
Modality Insights
Based on modality, handheld devices dominated the market in 2022 with 51.85% shares owing to the convenient usage of these products. Enhanced visualization offered by them allows dermatologists to understand various conditions better. In contrast to trolley-mounted dermatoscopes, these instruments are lightweight and offer an enhanced viewing experience, owing to which their adoption is increasing.
The growth of the trolley-mounted instruments segment is estimated to be limited by their high price and portability. However, they are useful for mapping out and monitoring several skin diseases and lesions. These devices are designed to provide images of the entire body and capture the entire skin surface in a few clicks.
Headband dermatoscopes are anticipated to exhibit a significant CAGR of 12.3% in the forecast period owing to the novel technology associated with these devices. These devices are worn by dermatologists on their heads to illuminate lesions on a patient’s skin.
End-use Insights
Dermatology clinics represented the leading share of 56.42% in the market in terms of revenue in 2022. Based on end-use, the market is bifurcated into dermatology clinics and hospitals. The increasing prevalence of skin cancer and melanoma is boosting the number of patients who visit dermatology clinics for treatment and care. The availability of sophisticated and technologically advanced medical equipment at dermatology clinics provides patients with quick and rapid diagnosis, which, in turn, provides the better treatment.
Hospitals held a significant share in 2022 owing to the high risk of skin cancer. Patients diagnosed with cancer are likelier to visit hospitals for advanced diagnosis and treatment. Also, the easy availability of specialized doctors in hospitals aids in convenient cancer diagnosis and treatment.
Regional Insights
In 2022, North America accounted for the largest revenue of 37.06%. The high prevalence of skin diseases, the presence of advanced healthcare infrastructure, medical device manufacturers, and economic development are some of the key growth stimulants for the regional market.
Europe held a sizeable share of the market in 2022 owing to the high adoption of technologically advanced devices for the diagnosis of skin cancer, inflammatory dermatoses, and lesions, especially in Germany. Increasing the incidence of skin-related diseases in the U.K. is contributing to the growth of the regional market.
Asia Pacific is projected to register the highest CAGR of 13.44% during the forecast period owing to the high prevalence of basal cell carcinoma, melanoma, squamous cell carcinoma, actinic keratosis, inflammatory dermatoses, and non-pigmented skin lesions in the region.
Key Players
Market Segmentation
Chapter 1. Introduction
1.1. Research Objective
1.2. Scope of the Study
1.3. Definition
Chapter 2. Research Methodology
2.1. Research Approach
2.2. Data Sources
2.3. Assumptions & Limitations
Chapter 3. Executive Summary
3.1. Market Snapshot
Chapter 4. Market Variables and Scope
4.1. Introduction
4.2. Market Classification and Scope
4.3. Industry Value Chain Analysis
4.3.1. Raw Material Procurement Analysis
4.3.2. Sales and Distribution Channel Analysis
4.3.3. Downstream Buyer Analysis
Chapter 5. COVID 19 Impact on Dermatoscope Market
5.1. COVID-19 Landscape: Dermatoscope Industry Impact
5.2. COVID 19 - Impact Assessment for the Industry
5.3. COVID 19 Impact: Global Major Government Policy
5.4. Market Trends and Opportunities in the COVID-19 Landscape
Chapter 6. Market Dynamics Analysis and Trends
6.1. Market Dynamics
6.1.1. Market Drivers
6.1.2. Market Restraints
6.1.3. Market Opportunities
6.2. Porter’s Five Forces Analysis
6.2.1. Bargaining power of suppliers
6.2.2. Bargaining power of buyers
6.2.3. Threat of substitute
6.2.4. Threat of new entrants
6.2.5. Degree of competition
Chapter 7. Competitive Landscape
7.1.1. Company Market Share/Positioning Analysis
7.1.2. Key Strategies Adopted by Players
7.1.3. Vendor Landscape
7.1.3.1. List of Suppliers
7.1.3.2. List of Buyers
Chapter 8. Global Dermatoscope Market, By Product
8.1. Dermatoscope Market, by Product, 2023-2032
8.1.1. Contact Dermatoscope
8.1.1.1. Market Revenue and Forecast (2019-2032)
8.1.2. Hybrid Dermatoscope
8.1.2.1. Market Revenue and Forecast (2019-2032)
8.1.3. Noncontact Dermatoscope
8.1.3.1. Market Revenue and Forecast (2019-2032)
Chapter 9. Global Dermatoscope Market, By Technology
9.1. Dermatoscope Market, by Technology, 2023-2032
9.1.1. LED
9.1.1.1. Market Revenue and Forecast (2019-2032)
9.1.2. Xenon
9.1.2.1. Market Revenue and Forecast (2019-2032)
9.1.3. Halogen
9.1.3.1. Market Revenue and Forecast (2019-2032)
9.1.4. Ultraviolet
9.1.4.1. Market Revenue and Forecast (2019-2032)
Chapter 10. Global Dermatoscope Market, By Modality
10.1. Dermatoscope Market, by Modality, 2023-2032
10.1.1. Handheld
10.1.1.1. Market Revenue and Forecast (2019-2032)
10.1.2. Trolley Mounted
10.1.2.1. Market Revenue and Forecast (2019-2032)
10.1.3. Headband
10.1.3.1. Market Revenue and Forecast (2019-2032)
Chapter 11. Global Dermatoscope Market, By End-use
11.1. Dermatoscope Market, by End-use, 2023-2032
11.1.1. Dermatology Clinics
11.1.1.1. Market Revenue and Forecast (2019-2032)
11.1.2. Hospitals
11.1.2.1. Market Revenue and Forecast (2019-2032)
Chapter 12. Global Dermatoscope Market, Regional Estimates and Trend Forecast
12.1. North America
12.1.1. Market Revenue and Forecast, by Product (2019-2032)
12.1.2. Market Revenue and Forecast, by Technology (2019-2032)
12.1.3. Market Revenue and Forecast, by Modality (2019-2032)
12.1.4. Market Revenue and Forecast, by End-use (2019-2032)
12.1.5. U.S.
12.1.5.1. Market Revenue and Forecast, by Product (2019-2032)
12.1.5.2. Market Revenue and Forecast, by Technology (2019-2032)
12.1.5.3. Market Revenue and Forecast, by Modality (2019-2032)
12.1.5.4. Market Revenue and Forecast, by End-use (2019-2032)
12.1.6. Rest of North America
12.1.6.1. Market Revenue and Forecast, by Product (2019-2032)
12.1.6.2. Market Revenue and Forecast, by Technology (2019-2032)
12.1.6.3. Market Revenue and Forecast, by Modality (2019-2032)
12.1.6.4. Market Revenue and Forecast, by End-use (2019-2032)
12.2. Europe
12.2.1. Market Revenue and Forecast, by Product (2019-2032)
12.2.2. Market Revenue and Forecast, by Technology (2019-2032)
12.2.3. Market Revenue and Forecast, by Modality (2019-2032)
12.2.4. Market Revenue and Forecast, by End-use (2019-2032)
12.2.5. UK
12.2.5.1. Market Revenue and Forecast, by Product (2019-2032)
12.2.5.2. Market Revenue and Forecast, by Technology (2019-2032)
12.2.5.3. Market Revenue and Forecast, by Modality (2019-2032)
12.2.5.4. Market Revenue and Forecast, by End-use (2019-2032)
12.2.6. Germany
12.2.6.1. Market Revenue and Forecast, by Product (2019-2032)
12.2.6.2. Market Revenue and Forecast, by Technology (2019-2032)
12.2.6.3. Market Revenue and Forecast, by Modality (2019-2032)
12.2.6.4. Market Revenue and Forecast, by End-use (2019-2032)
12.2.7. France
12.2.7.1. Market Revenue and Forecast, by Product (2019-2032)
12.2.7.2. Market Revenue and Forecast, by Technology (2019-2032)
12.2.7.3. Market Revenue and Forecast, by Modality (2019-2032)
12.2.7.4. Market Revenue and Forecast, by End-use (2019-2032)
12.2.8. Rest of Europe
12.2.8.1. Market Revenue and Forecast, by Product (2019-2032)
12.2.8.2. Market Revenue and Forecast, by Technology (2019-2032)
12.2.8.3. Market Revenue and Forecast, by Modality (2019-2032)
12.2.8.4. Market Revenue and Forecast, by End-use (2019-2032)
12.3. APAC
12.3.1. Market Revenue and Forecast, by Product (2019-2032)
12.3.2. Market Revenue and Forecast, by Technology (2019-2032)
12.3.3. Market Revenue and Forecast, by Modality (2019-2032)
12.3.4. Market Revenue and Forecast, by End-use (2019-2032)
12.3.5. India
12.3.5.1. Market Revenue and Forecast, by Product (2019-2032)
12.3.5.2. Market Revenue and Forecast, by Technology (2019-2032)
12.3.5.3. Market Revenue and Forecast, by Modality (2019-2032)
12.3.5.4. Market Revenue and Forecast, by End-use (2019-2032)
12.3.6. China
12.3.6.1. Market Revenue and Forecast, by Product (2019-2032)
12.3.6.2. Market Revenue and Forecast, by Technology (2019-2032)
12.3.6.3. Market Revenue and Forecast, by Modality (2019-2032)
12.3.6.4. Market Revenue and Forecast, by End-use (2019-2032)
12.3.7. Japan
12.3.7.1. Market Revenue and Forecast, by Product (2019-2032)
12.3.7.2. Market Revenue and Forecast, by Technology (2019-2032)
12.3.7.3. Market Revenue and Forecast, by Modality (2019-2032)
12.3.7.4. Market Revenue and Forecast, by End-use (2019-2032)
12.3.8. Rest of APAC
12.3.8.1. Market Revenue and Forecast, by Product (2019-2032)
12.3.8.2. Market Revenue and Forecast, by Technology (2019-2032)
12.3.8.3. Market Revenue and Forecast, by Modality (2019-2032)
12.3.8.4. Market Revenue and Forecast, by End-use (2019-2032)
12.4. MEA
12.4.1. Market Revenue and Forecast, by Product (2019-2032)
12.4.2. Market Revenue and Forecast, by Technology (2019-2032)
12.4.3. Market Revenue and Forecast, by Modality (2019-2032)
12.4.4. Market Revenue and Forecast, by End-use (2019-2032)
12.4.5. GCC
12.4.5.1. Market Revenue and Forecast, by Product (2019-2032)
12.4.5.2. Market Revenue and Forecast, by Technology (2019-2032)
12.4.5.3. Market Revenue and Forecast, by Modality (2019-2032)
12.4.5.4. Market Revenue and Forecast, by End-use (2019-2032)
12.4.6. North Africa
12.4.6.1. Market Revenue and Forecast, by Product (2019-2032)
12.4.6.2. Market Revenue and Forecast, by Technology (2019-2032)
12.4.6.3. Market Revenue and Forecast, by Modality (2019-2032)
12.4.6.4. Market Revenue and Forecast, by End-use (2019-2032)
12.4.7. South Africa
12.4.7.1. Market Revenue and Forecast, by Product (2019-2032)
12.4.7.2. Market Revenue and Forecast, by Technology (2019-2032)
12.4.7.3. Market Revenue and Forecast, by Modality (2019-2032)
12.4.7.4. Market Revenue and Forecast, by End-use (2019-2032)
12.4.8. Rest of MEA
12.4.8.1. Market Revenue and Forecast, by Product (2019-2032)
12.4.8.2. Market Revenue and Forecast, by Technology (2019-2032)
12.4.8.3. Market Revenue and Forecast, by Modality (2019-2032)
12.4.8.4. Market Revenue and Forecast, by End-use (2019-2032)
12.5. Latin America
12.5.1. Market Revenue and Forecast, by Product (2019-2032)
12.5.2. Market Revenue and Forecast, by Technology (2019-2032)
12.5.3. Market Revenue and Forecast, by Modality (2019-2032)
12.5.4. Market Revenue and Forecast, by End-use (2019-2032)
12.5.5. Brazil
12.5.5.1. Market Revenue and Forecast, by Product (2019-2032)
12.5.5.2. Market Revenue and Forecast, by Technology (2019-2032)
12.5.5.3. Market Revenue and Forecast, by Modality (2019-2032)
12.5.5.4. Market Revenue and Forecast, by End-use (2019-2032)
12.5.6. Rest of LATAM
12.5.6.1. Market Revenue and Forecast, by Product (2019-2032)
12.5.6.2. Market Revenue and Forecast, by Technology (2019-2032)
12.5.6.3. Market Revenue and Forecast, by Modality (2019-2032)
12.5.6.4. Market Revenue and Forecast, by End-use (2019-2032)
Chapter 13. Company Profiles
13.1. Canfield Scientific, Inc.
13.1.1. Company Overview
13.1.2. Product Offerings
13.1.3. Financial Performance
13.1.4. Recent Initiatives
13.2. 3Gen
13.2.1. Company Overview
13.2.2. Product Offerings
13.2.3. Financial Performance
13.2.4. Recent Initiatives
13.3. FotoFinder Systems
13.3.1. Company Overview
13.3.2. Product Offerings
13.3.3. Financial Performance
13.3.4. Recent Initiatives
13.4. Optilia Instruments AB
13.4.1. Company Overview
13.4.2. Product Offerings
13.4.3. Financial Performance
13.4.4. Recent Initiatives
13.5. HEINE Optotechnik GmbH & Co. KG
13.5.1. Company Overview
13.5.2. Product Offerings
13.5.3. Financial Performance
13.5.4. Recent Initiatives
13.6. Caliber Imaging & Diagnostics, Inc.
13.6.1. Company Overview
13.6.2. Product Offerings
13.6.3. Financial Performance
13.6.4. Recent Initiatives
13.7. Firefly Global
13.7.1. Company Overview
13.7.2. Product Offerings
13.7.3. Financial Performance
13.7.4. Recent Initiatives
13.8. ILLUCO Corporation Ltd.
13.8.1. Company Overview
13.8.2. Product Offerings
13.8.3. Financial Performance
13.8.4. Recent Initiatives
13.9. Welch Allyn
13.9.1. Company Overview
13.9.2. Product Offerings
13.9.3. Financial Performance
13.9.4. Recent Initiatives
13.10. Bio-Therapeutic Inc.
13.10.1. Company Overview
13.10.2. Product Offerings
13.10.3. Financial Performance
13.10.4. Recent Initiatives
Chapter 14. Research Methodology
14.1. Primary Research
14.2. Secondary Research
14.3. Assumptions
Chapter 15. Appendix
15.1. About Us
15.2. Glossary of Terms
 Cross-segment Market Size and Analysis for
Mentioned Segments
Additional Company Profiles (Upto 5 With No Cost)
Additional Countries (Apart From Mentioned Countries)
Country/Region-specific Report
Go To Market Strategy
Region Specific Market DynamicsRegion Level Market Share Import Export AnalysisProduction AnalysisOthers
Cross-segment Market Size and Analysis for
Mentioned Segments
Additional Company Profiles (Upto 5 With No Cost)
Additional Countries (Apart From Mentioned Countries)
Country/Region-specific Report
Go To Market Strategy
Region Specific Market DynamicsRegion Level Market Share Import Export AnalysisProduction AnalysisOthers