Device-as-a-Service Market Size, Share | Report 2023-2032
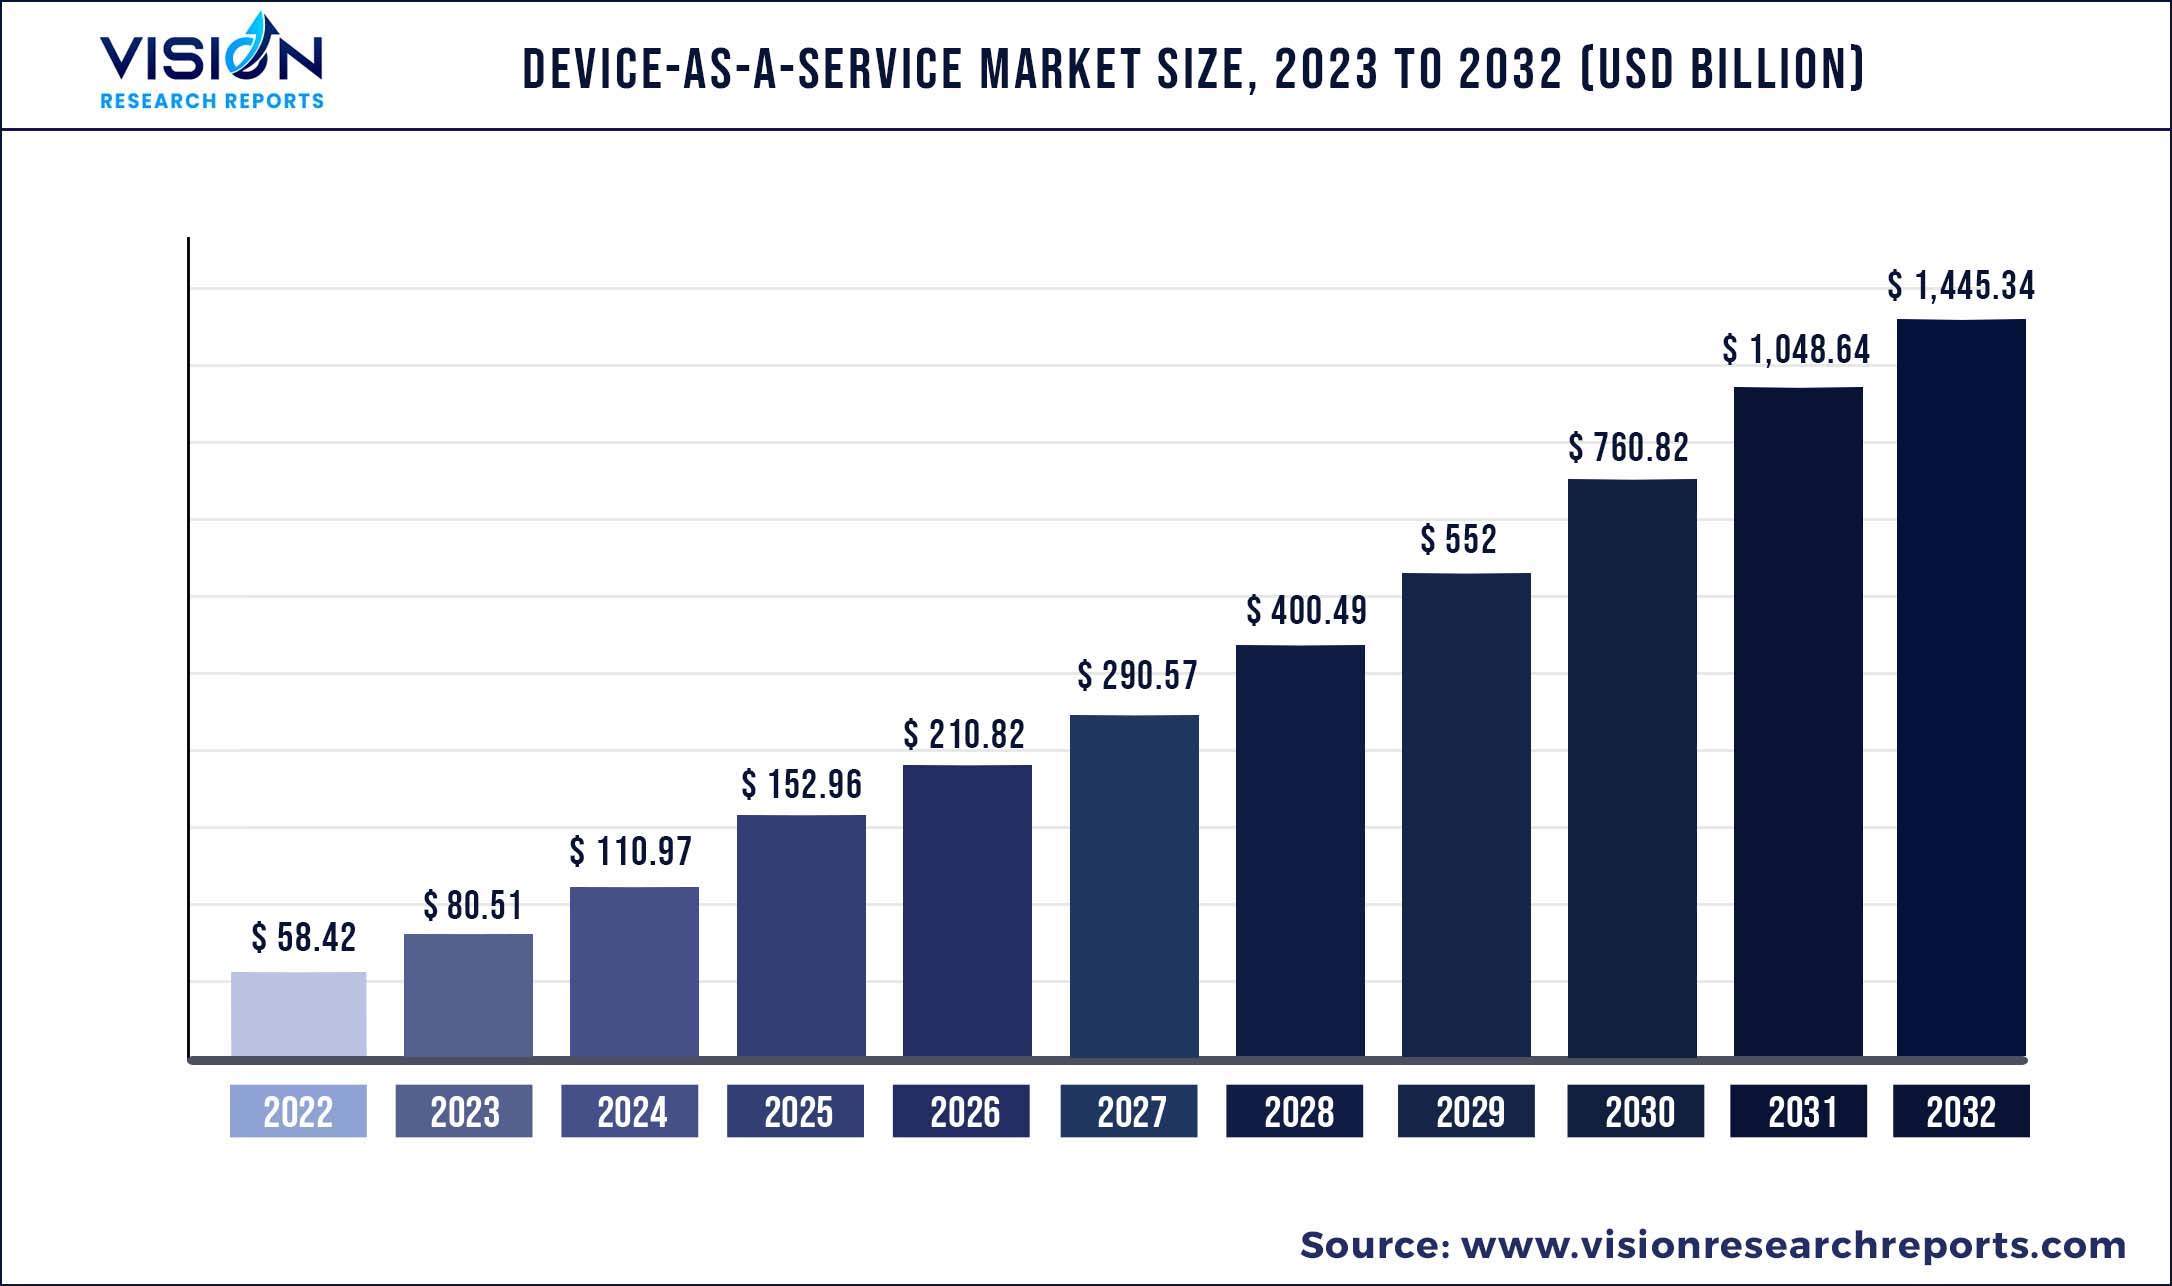
The global device-as-a-service market size was estimated at around USD 58.42 billion in 2022 and it is projected to hit around USD 1,445.34 billion by 2032, growing at a CAGR of 37.83% from 2023 to 2032.
Key Pointers
Report Scope of the Device-as-a-Service Market
| Report Coverage | Details |
| Market Size in 2022 | USD 58.42 billion |
| Revenue Forecast by 2032 | USD 1,445.34 billion |
| Growth rate from 2023 to 2032 | CAGR of 37.83% |
| Base Year | 2022 |
| Forecast Period | 2023 to 2032 |
| Regions Covered | North America, Europe, Asia Pacific, Latin America, Middle East & Africa |
| Companies Covered | Accenture; Acer Inc.; Apple Inc.; Cisco; Cognizant; Computacenter; Dell technologies; Intel Corporation; Hewlett Packard; Lenovo |
The promising growth prospects of the market can be attributed to the growing demand for a subscription model that can allow end-users to switch from a capital expenditure-based model to an operating expenses-based model and acquire the latest technology. The increasing adoption of cloud services in developing countries is expected to drive market growth. Furthermore, the adoption of contact-based services and solutions by small and medium enterprises is expected to favor the growth of the market. The COVID-19 pandemic had a positive impact on the market. The pandemic significantly changed the work dynamics globally, compelling businesses to prioritize the adoption of the cloud and remote working practices to curb the spread of COVID-19 infections. Furthermore, the pandemic has encouraged digital transformation activities and the adoption of several technologies, boosting the adoption of the device-as-a-service (DaaS) model.
DaaS enables timely upgrade and maintenance of software and hardware, allowing companies to reduce the IT burden; moreover, the model helps avoid technological obsolescence, ultimately enhancing productivity. Flexible structuring of device-as-a-service offers businesses to scale up/scale down device count and attached services. These factors are expected to drive the market over the forecast period.
Furthermore, the rapid adoption of the subscription model, higher policy compliance, increased user productivity, reduction in help desk spending, and the growing need for cost-efficient and secured devices have accelerated the market growth. The boost in the startup ecosystem is expected to drive the demand for the DaaS model. However, the lack of technical expertise and adoption of CYOD policies could hamper the growth of the market.
The device-as-a-service model is gaining popularity among large as well as small and medium enterprises as it allows them to lease hardware such as laptops, desktops, smartphones, and tablets with preconfigured software or services. The increased adoption of IoT is also expected to drive the demand for the model. Technological advancements, increasing penetration of high-speed networks, and growing advancements in web services are other factors expected to drive the growth of the Device-as-a-Service market.
Device-as-a-Service Market Segmentations:
| By Offering | By Device Type | By Organization | By Industry Vertical |
|
Hardware Software Service |
Desktop Laptop, Notebook, and Tablet Smartphone and Peripheral |
Small and Medium Enterprise Large Enterprise |
Banking, Financial Services and Insurance (BFSI) Educational Institution Healthcare and Life Science IT & Telecommunication Public Sector and Government Office Others |
Chapter 1. Introduction
1.1. Research Objective
1.2. Scope of the Study
1.3. Definition
Chapter 2. Research Methodology
2.1. Research Approach
2.2. Data Sources
2.3. Assumptions & Limitations
Chapter 3. Executive Summary
3.1. Market Snapshot
Chapter 4. Market Variables and Scope
4.1. Introduction
4.2. Market Classification and Scope
4.3. Industry Value Chain Analysis
4.3.1. Raw Material Procurement Analysis
4.3.2. Sales and Distribution Channel Analysis
4.3.3. Downstream Buyer Analysis
Chapter 5. COVID 19 Impact on Device-as-a-Service Market
5.1. COVID-19 Landscape: Device-as-a-Service Industry Impact
5.2. COVID 19 - Impact Assessment for the Industry
5.3. COVID 19 Impact: Global Major Government Policy
5.4. Market Trends and Opportunities in the COVID-19 Landscape
Chapter 6. Market Dynamics Analysis and Trends
6.1. Market Dynamics
6.1.1. Market Drivers
6.1.2. Market Restraints
6.1.3. Market Opportunities
6.2. Porter’s Five Forces Analysis
6.2.1. Bargaining power of suppliers
6.2.2. Bargaining power of buyers
6.2.3. Threat of substitute
6.2.4. Threat of new entrants
6.2.5. Degree of competition
Chapter 7. Competitive Landscape
7.1.1. Company Market Share/Positioning Analysis
7.1.2. Key Strategies Adopted by Players
7.1.3. Vendor Landscape
7.1.3.1. List of Suppliers
7.1.3.2. List of Buyers
Chapter 8. Global Device-as-a-Service Market, By Offering
8.1. Device-as-a-Service Market, by Offering, 2023-2032
8.1.1. Hardware
8.1.1.1. Market Revenue and Forecast (2020-2032)
8.1.2. Software
8.1.2.1. Market Revenue and Forecast (2020-2032)
8.1.3. Service
8.1.3.1. Market Revenue and Forecast (2020-2032)
Chapter 9. Global Device-as-a-Service Market, By Device Type
9.1. Device-as-a-Service Market, by Device Type, 2023-2032
9.1.1. Desktop
9.1.1.1. Market Revenue and Forecast (2020-2032)
9.1.2. Laptop, Notebook, and Tablet
9.1.2.1. Market Revenue and Forecast (2020-2032)
9.1.3. Smartphone and Peripheral
9.1.3.1. Market Revenue and Forecast (2020-2032)
Chapter 10. Global Device-as-a-Service Market, By Organization
10.1. Device-as-a-Service Market, by Organization, 2023-2032
10.1.1. Small and Medium Enterprise
10.1.1.1. Market Revenue and Forecast (2020-2032)
10.1.2. Small and Medium Enterprise
10.1.2.1. Market Revenue and Forecast (2020-2032)
Chapter 11. Global Device-as-a-Service Market, By Industry Vertical
11.1. Device-as-a-Service Market, by Industry Vertical, 2023-2032
11.1.1. Banking, Financial Services and Insurance (BFSI)
11.1.1.1. Market Revenue and Forecast (2020-2032)
11.1.2. Educational Institution
11.1.2.1. Market Revenue and Forecast (2020-2032)
11.1.3. Healthcare and Life Science
11.1.3.1. Market Revenue and Forecast (2020-2032)
11.1.4. IT & Telecommunication
11.1.4.1. Market Revenue and Forecast (2020-2032)
11.1.5. Public Sector and Government Office
11.1.5.1. Market Revenue and Forecast (2020-2032)
11.1.6. Others
11.1.6.1. Market Revenue and Forecast (2020-2032)
Chapter 12. Global Device-as-a-Service Market, Regional Estimates and Trend Forecast
12.1. North America
12.1.1. Market Revenue and Forecast, by Offering (2020-2032)
12.1.2. Market Revenue and Forecast, by Device Type (2020-2032)
12.1.3. Market Revenue and Forecast, by Organization (2020-2032)
12.1.4. Market Revenue and Forecast, by Industry Vertical (2020-2032)
12.1.5. U.S.
12.1.5.1. Market Revenue and Forecast, by Offering (2020-2032)
12.1.5.2. Market Revenue and Forecast, by Device Type (2020-2032)
12.1.5.3. Market Revenue and Forecast, by Organization (2020-2032)
12.1.5.4. Market Revenue and Forecast, by Industry Vertical (2020-2032)
12.1.6. Rest of North America
12.1.6.1. Market Revenue and Forecast, by Offering (2020-2032)
12.1.6.2. Market Revenue and Forecast, by Device Type (2020-2032)
12.1.6.3. Market Revenue and Forecast, by Organization (2020-2032)
12.1.6.4. Market Revenue and Forecast, by Industry Vertical (2020-2032)
12.2. Europe
12.2.1. Market Revenue and Forecast, by Offering (2020-2032)
12.2.2. Market Revenue and Forecast, by Device Type (2020-2032)
12.2.3. Market Revenue and Forecast, by Organization (2020-2032)
12.2.4. Market Revenue and Forecast, by Industry Vertical (2020-2032)
12.2.5. UK
12.2.5.1. Market Revenue and Forecast, by Offering (2020-2032)
12.2.5.2. Market Revenue and Forecast, by Device Type (2020-2032)
12.2.5.3. Market Revenue and Forecast, by Organization (2020-2032)
12.2.5.4. Market Revenue and Forecast, by Industry Vertical (2020-2032)
12.2.6. Germany
12.2.6.1. Market Revenue and Forecast, by Offering (2020-2032)
12.2.6.2. Market Revenue and Forecast, by Device Type (2020-2032)
12.2.6.3. Market Revenue and Forecast, by Organization (2020-2032)
12.2.6.4. Market Revenue and Forecast, by Industry Vertical (2020-2032)
12.2.7. France
12.2.7.1. Market Revenue and Forecast, by Offering (2020-2032)
12.2.7.2. Market Revenue and Forecast, by Device Type (2020-2032)
12.2.7.3. Market Revenue and Forecast, by Organization (2020-2032)
12.2.7.4. Market Revenue and Forecast, by Industry Vertical (2020-2032)
12.2.8. Rest of Europe
12.2.8.1. Market Revenue and Forecast, by Offering (2020-2032)
12.2.8.2. Market Revenue and Forecast, by Device Type (2020-2032)
12.2.8.3. Market Revenue and Forecast, by Organization (2020-2032)
12.2.8.4. Market Revenue and Forecast, by Industry Vertical (2020-2032)
12.3. APAC
12.3.1. Market Revenue and Forecast, by Offering (2020-2032)
12.3.2. Market Revenue and Forecast, by Device Type (2020-2032)
12.3.3. Market Revenue and Forecast, by Organization (2020-2032)
12.3.4. Market Revenue and Forecast, by Industry Vertical (2020-2032)
12.3.5. India
12.3.5.1. Market Revenue and Forecast, by Offering (2020-2032)
12.3.5.2. Market Revenue and Forecast, by Device Type (2020-2032)
12.3.5.3. Market Revenue and Forecast, by Organization (2020-2032)
12.3.5.4. Market Revenue and Forecast, by Industry Vertical (2020-2032)
12.3.6. China
12.3.6.1. Market Revenue and Forecast, by Offering (2020-2032)
12.3.6.2. Market Revenue and Forecast, by Device Type (2020-2032)
12.3.6.3. Market Revenue and Forecast, by Organization (2020-2032)
12.3.6.4. Market Revenue and Forecast, by Industry Vertical (2020-2032)
12.3.7. Japan
12.3.7.1. Market Revenue and Forecast, by Offering (2020-2032)
12.3.7.2. Market Revenue and Forecast, by Device Type (2020-2032)
12.3.7.3. Market Revenue and Forecast, by Organization (2020-2032)
12.3.7.4. Market Revenue and Forecast, by Industry Vertical (2020-2032)
12.3.8. Rest of APAC
12.3.8.1. Market Revenue and Forecast, by Offering (2020-2032)
12.3.8.2. Market Revenue and Forecast, by Device Type (2020-2032)
12.3.8.3. Market Revenue and Forecast, by Organization (2020-2032)
12.3.8.4. Market Revenue and Forecast, by Industry Vertical (2020-2032)
12.4. MEA
12.4.1. Market Revenue and Forecast, by Offering (2020-2032)
12.4.2. Market Revenue and Forecast, by Device Type (2020-2032)
12.4.3. Market Revenue and Forecast, by Organization (2020-2032)
12.4.4. Market Revenue and Forecast, by Industry Vertical (2020-2032)
12.4.5. GCC
12.4.5.1. Market Revenue and Forecast, by Offering (2020-2032)
12.4.5.2. Market Revenue and Forecast, by Device Type (2020-2032)
12.4.5.3. Market Revenue and Forecast, by Organization (2020-2032)
12.4.5.4. Market Revenue and Forecast, by Industry Vertical (2020-2032)
12.4.6. North Africa
12.4.6.1. Market Revenue and Forecast, by Offering (2020-2032)
12.4.6.2. Market Revenue and Forecast, by Device Type (2020-2032)
12.4.6.3. Market Revenue and Forecast, by Organization (2020-2032)
12.4.6.4. Market Revenue and Forecast, by Industry Vertical (2020-2032)
12.4.7. South Africa
12.4.7.1. Market Revenue and Forecast, by Offering (2020-2032)
12.4.7.2. Market Revenue and Forecast, by Device Type (2020-2032)
12.4.7.3. Market Revenue and Forecast, by Organization (2020-2032)
12.4.7.4. Market Revenue and Forecast, by Industry Vertical (2020-2032)
12.4.8. Rest of MEA
12.4.8.1. Market Revenue and Forecast, by Offering (2020-2032)
12.4.8.2. Market Revenue and Forecast, by Device Type (2020-2032)
12.4.8.3. Market Revenue and Forecast, by Organization (2020-2032)
12.4.8.4. Market Revenue and Forecast, by Industry Vertical (2020-2032)
12.5. Latin America
12.5.1. Market Revenue and Forecast, by Offering (2020-2032)
12.5.2. Market Revenue and Forecast, by Device Type (2020-2032)
12.5.3. Market Revenue and Forecast, by Organization (2020-2032)
12.5.4. Market Revenue and Forecast, by Industry Vertical (2020-2032)
12.5.5. Brazil
12.5.5.1. Market Revenue and Forecast, by Offering (2020-2032)
12.5.5.2. Market Revenue and Forecast, by Device Type (2020-2032)
12.5.5.3. Market Revenue and Forecast, by Organization (2020-2032)
12.5.5.4. Market Revenue and Forecast, by Industry Vertical (2020-2032)
12.5.6. Rest of LATAM
12.5.6.1. Market Revenue and Forecast, by Offering (2020-2032)
12.5.6.2. Market Revenue and Forecast, by Device Type (2020-2032)
12.5.6.3. Market Revenue and Forecast, by Organization (2020-2032)
12.5.6.4. Market Revenue and Forecast, by Industry Vertical (2020-2032)
Chapter 13. Company Profiles
13.1. Accenture
13.1.1. Company Overview
13.1.2. Product Offerings
13.1.3. Financial Performance
13.1.4. Recent Initiatives
13.2. Acer Inc.
13.2.1. Company Overview
13.2.2. Product Offerings
13.2.3. Financial Performance
13.2.4. Recent Initiatives
13.3. Apple Inc.
13.3.1. Company Overview
13.3.2. Product Offerings
13.3.3. Financial Performance
13.3.4. Recent Initiatives
13.4. Cisco
13.4.1. Company Overview
13.4.2. Product Offerings
13.4.3. Financial Performance
13.4.4. Recent Initiatives
13.5. Cognizant
13.5.1. Company Overview
13.5.2. Product Offerings
13.5.3. Financial Performance
13.5.4. Recent Initiatives
13.6. Computacenter
13.6.1. Company Overview
13.6.2. Product Offerings
13.6.3. Financial Performance
13.6.4. Recent Initiatives
13.7. Dell Technologies
13.7.1. Company Overview
13.7.2. Product Offerings
13.7.3. Financial Performance
13.7.4. Recent Initiatives
13.8. Intel Corporation
13.8.1. Company Overview
13.8.2. Product Offerings
13.8.3. Financial Performance
13.8.4. Recent Initiatives
13.9. Hewlett Packard
13.9.1. Company Overview
13.9.2. Product Offerings
13.9.3. Financial Performance
13.9.4. Recent Initiatives
13.10. Lenovo
13.10.1. Company Overview
13.10.2. Product Offerings
13.10.3. Financial Performance
13.10.4. Recent Initiatives
Chapter 14. Research Methodology
14.1. Primary Research
14.2. Secondary Research
14.3. Assumptions
Chapter 15. Appendix
15.1. About Us
15.2. Glossary of Terms
 Cross-segment Market Size and Analysis for
Mentioned Segments
Additional Company Profiles (Upto 5 With No Cost)
Additional Countries (Apart From Mentioned Countries)
Country/Region-specific Report
Go To Market Strategy
Region Specific Market DynamicsRegion Level Market Share Import Export AnalysisProduction AnalysisOthers
Cross-segment Market Size and Analysis for
Mentioned Segments
Additional Company Profiles (Upto 5 With No Cost)
Additional Countries (Apart From Mentioned Countries)
Country/Region-specific Report
Go To Market Strategy
Region Specific Market DynamicsRegion Level Market Share Import Export AnalysisProduction AnalysisOthers