Electrolyzer Market Size, Growth, Trends | Report 2023-2032
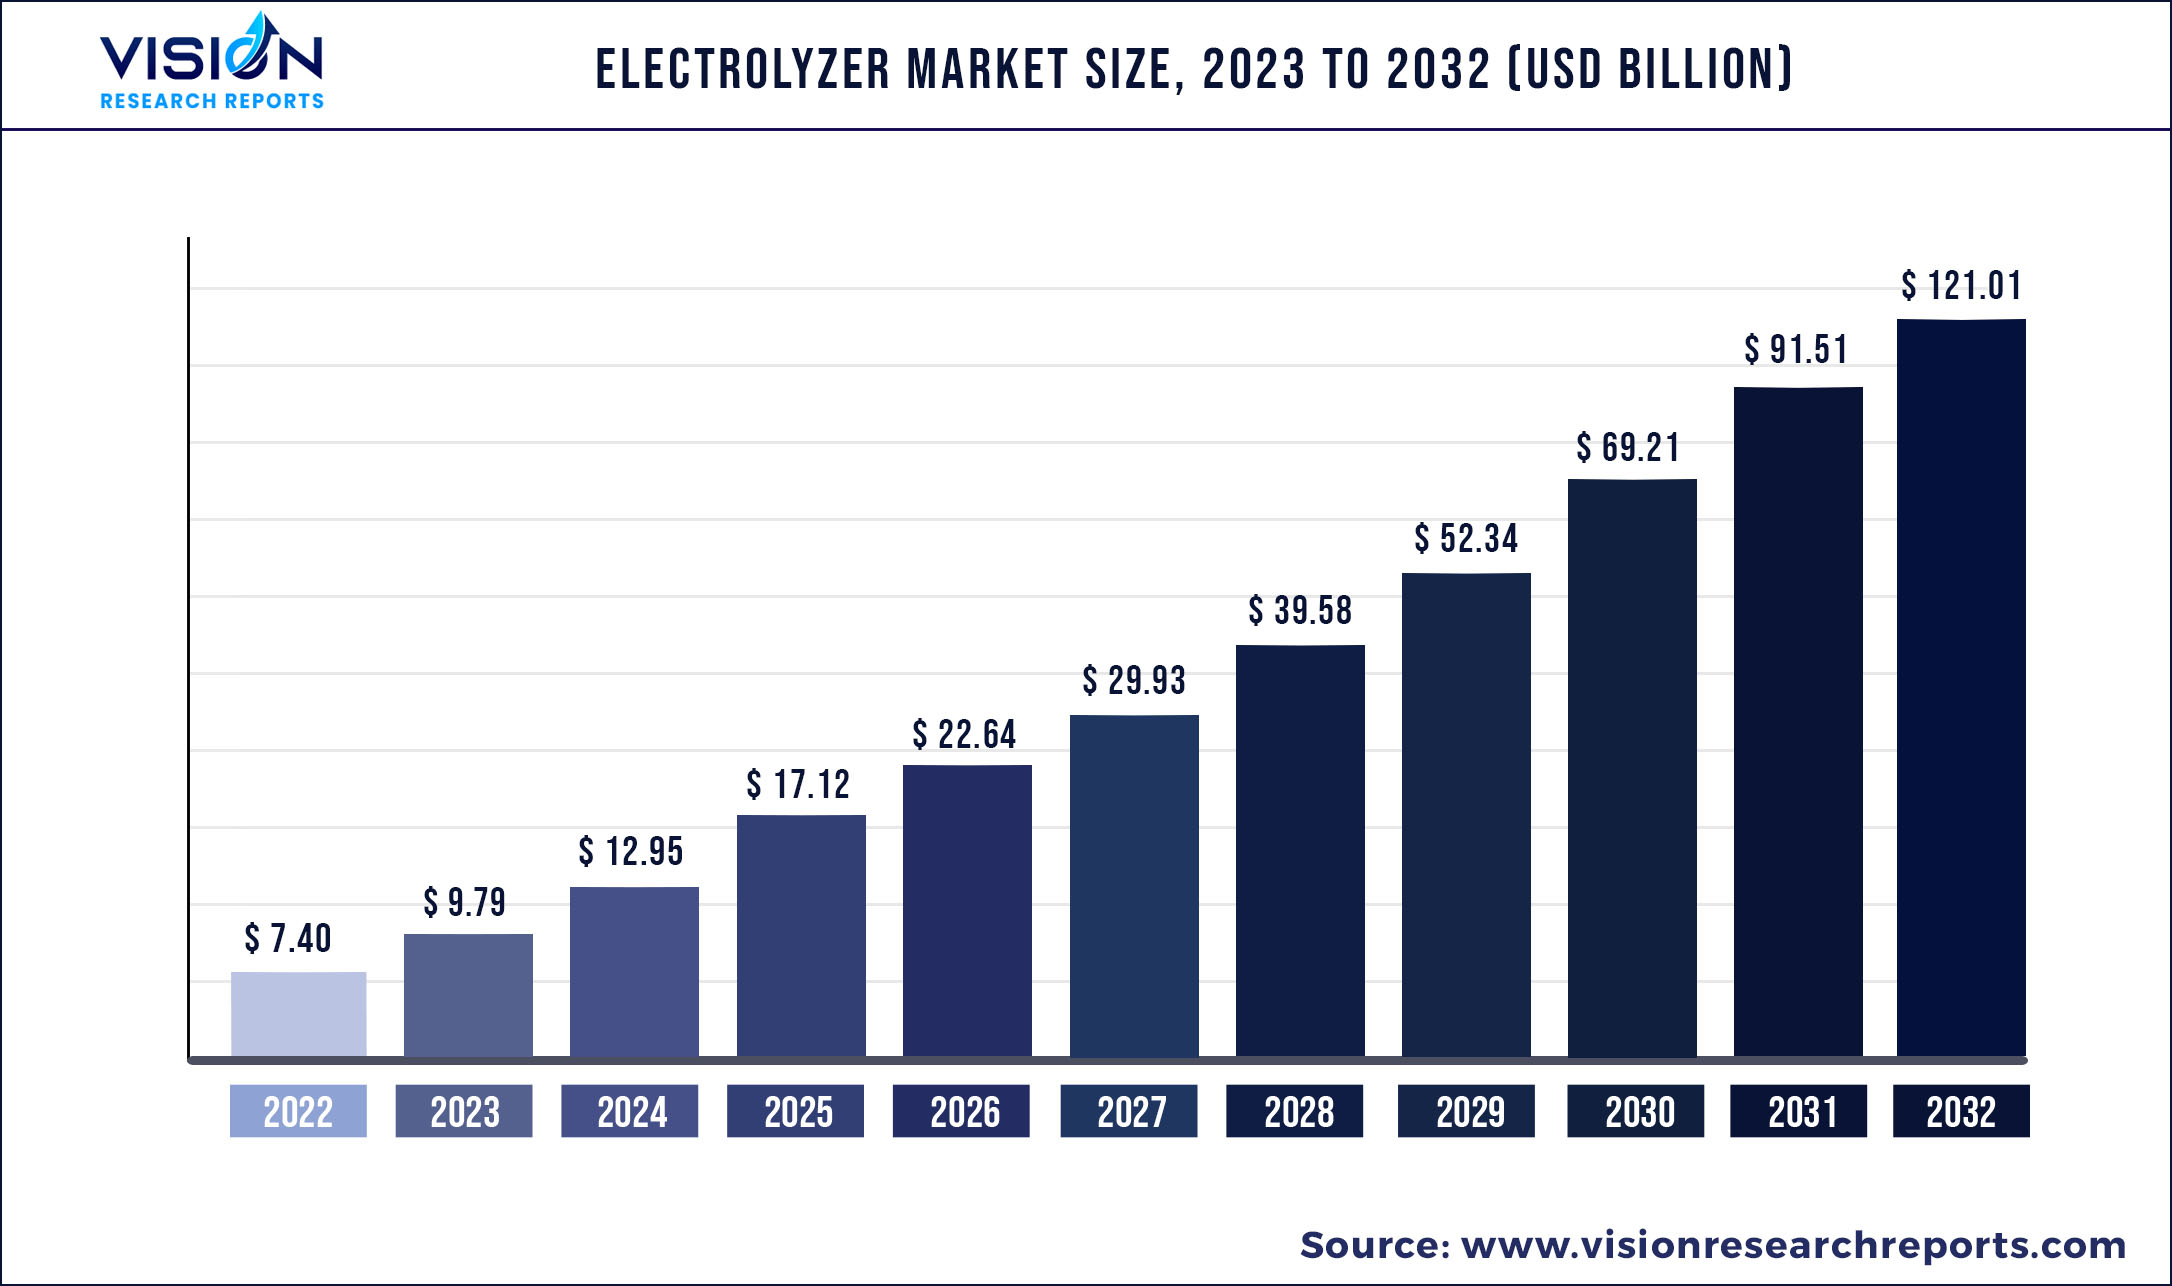
The global electrolyzer market was valued at USD 7.40 billion in 2022 and it is predicted to surpass around USD 121.01 billion by 2032 with a CAGR of 32.23% from 2023 to 2032.
Key Pointers
| Report Coverage | Details |
| Market Size in 2022 | USD 7.40 billion |
| Revenue Forecast by 2032 | USD 121.01 billion |
| Growth rate from 2023 to 2032 | CAGR of 32.23% |
| Base Year | 2022 |
| Forecast Period | 2023 to 2032 |
| Regions Covered | North America, Europe, Asia Pacific, Latin America, Middle East & Africa |
| Companies Covered | Nel Hydrogen (Norway), Asahi Kasei (Japan), Hydrogenics (Canada), Shandong Saikesaisi Hydrogen Energy Co., Ltd. (China), Teledyne Energy Systems (U.S.), Siemens (Germany), Kobelco Eco-Solutions (U.S.), Green Hydrogen Systems (Denmark), Next Hydrogen (Canada), H-Tec Systems (Germany) |
Due to the growing use of these tools in end-use industries such power plants, chemical, and petrochemical production, the market for hydrogen electrolyzers is anticipated to grow during the forecast period of 2023–2032. Due to the expansion of the need for green energy and the creation of green hydrogen, the market for hydrogen electrolyzers has simultaneously been presented with a wide range of potential for income generation. The market will grow as a result of continued research into dependable, state-of-the-art power solutions and the rising adoption of clean hydrogen generating technologies. The growing consumer shift toward environmental security and the broad adoption of renewable energy sources will affect the industrial trend.
The challenges of carbon emissions and global warming have come to light. Governments all around the world have implemented numerous laws and regulations requiring a decrease in carbon emissions from diverse sectors. Electrolyzers create hydrogen by using electricity to split water into hydrogen and oxygen. The electricity was generated using either renewable or nonrenewable resources. In addition, hydrogen can be produced using an electrolyzer that uses wind or sun energy. This approach promotes the production of carbon-neutral green hydrogen. In order to reduce their carbon footprint, many companies choose to build on-site electrolyzers with 1 to 5 MW of capacity, which has a significant impact on the expansion of the global electrolyzer sector.
As a result of concerns over climate change, the increase in earth's temperature, and the worrying development in carbon emissions, renewable energy sources have witnessed a spike in popularity. To be more responsible, many businesses have opted to use abundant natural resources like solar, wind, natural gas, and water instead of the traditional technique of producing electricity from fossil fuels. However, there was a high initial expense associated with creating such programmes. On the other hand, a number of helpful government policies have been implemented as a result of technology developments and ardent support for the benefits of renewable energy. With the added benefit of leaving a significantly smaller carbon footprint, the cost of renewable energy has decreased. These declining costs are increasing the demand for electrolyzers.
Electrolyzer Market Segmentations:
| By Type | By Capacity | By Application |
|
PEM Electrolyzer Alkaline Electrolyzer Solid Oxide Electrolyzer |
≤ 500 kW 500 kW - 2 MW Above 2 MW |
Steel plant Power plants Electronics and photovoltaics Energy storage for fuel cells Industrial gases Power to gas Others |
Chapter 1. Introduction
1.1. Research Objective
1.2. Scope of the Study
1.3. Definition
Chapter 2. Research Methodology
2.1. Research Approach
2.2. Data Sources
2.3. Assumptions & Limitations
Chapter 3. Executive Summary
3.1. Market Snapshot
Chapter 4. Market Variables and Scope
4.1. Introduction
4.2. Market Classification and Scope
4.3. Industry Value Chain Analysis
4.3.1. Raw Material Procurement Analysis
4.3.2. Sales and Distribution Channel Analysis
4.3.3. Downstream Buyer Analysis
Chapter 5. COVID 19 Impact on Electrolyzer Market
5.1. COVID-19 Landscape: Electrolyzer Industry Impact
5.2. COVID 19 - Impact Assessment for the Industry
5.3. COVID 19 Impact: Global Major Government Policy
5.4. Market Trends and Opportunities in the COVID-19 Landscape
Chapter 6. Market Dynamics Analysis and Trends
6.1. Market Dynamics
6.1.1. Market Drivers
6.1.2. Market Restraints
6.1.3. Market Opportunities
6.2. Porter’s Five Forces Analysis
6.2.1. Bargaining power of suppliers
6.2.2. Bargaining power of buyers
6.2.3. Threat of substitute
6.2.4. Threat of new entrants
6.2.5. Degree of competition
Chapter 7. Competitive Landscape
7.1.1. Company Market Share/Positioning Analysis
7.1.2. Key Strategies Adopted by Players
7.1.3. Vendor Landscape
7.1.3.1. List of Suppliers
7.1.3.2. List of Buyers
Chapter 8. Global Electrolyzer Market, By Type
8.1. Electrolyzer Market, by Type, 2023-2032
8.1.1 PEM Electrolyzer
8.1.1.1. Market Revenue and Forecast (2020-2032)
8.1.2. Alkaline Electrolyzer
8.1.2.1. Market Revenue and Forecast (2020-2032)
8.1.3. Solid Oxide Electrolyzer
8.1.3.1. Market Revenue and Forecast (2020-2032)
Chapter 9. Global Electrolyzer Market, By Capacity
9.1. Electrolyzer Market, by Capacity, 2023-2032
9.1.1. ≤ 500 kW
9.1.1.1. Market Revenue and Forecast (2020-2032)
9.1.2. 500 kW - 2 MW
9.1.2.1. Market Revenue and Forecast (2020-2032)
9.1.3. Above 2 MW
9.1.3.1. Market Revenue and Forecast (2020-2032)
Chapter 10. Global Electrolyzer Market, By Application
10.1. Electrolyzer Market, by Application, 2023-2032
10.1.1. Steel plant
10.1.1.1. Market Revenue and Forecast (2020-2032)
10.1.2. Power plants
10.1.2.1. Market Revenue and Forecast (2020-2032)
10.1.3. Electronics and photovoltaics
10.1.3.1. Market Revenue and Forecast (2020-2032)
10.1.4. Energy storage for fuel cells
10.1.4.1. Market Revenue and Forecast (2020-2032)
10.1.5. Industrial gases
10.1.5.1. Market Revenue and Forecast (2020-2032)
10.1.6. Power to gas
10.1.6.1. Market Revenue and Forecast (2020-2032)
10.1.7. Others
10.1.7.1. Market Revenue and Forecast (2020-2032)
Chapter 11. Global Electrolyzer Market, Regional Estimates and Trend Forecast
11.1. North America
11.1.1. Market Revenue and Forecast, by Type (2020-2032)
11.1.2. Market Revenue and Forecast, by Capacity (2020-2032)
11.1.3. Market Revenue and Forecast, by Application (2020-2032)
11.1.4. U.S.
11.1.4.1. Market Revenue and Forecast, by Type (2020-2032)
11.1.4.2. Market Revenue and Forecast, by Capacity (2020-2032)
11.1.4.3. Market Revenue and Forecast, by Application (2020-2032)
11.1.5. Rest of North America
11.1.5.1. Market Revenue and Forecast, by Type (2020-2032)
11.1.5.2. Market Revenue and Forecast, by Capacity (2020-2032)
11.1.5.3. Market Revenue and Forecast, by Application (2020-2032)
11.2. Europe
11.2.1. Market Revenue and Forecast, by Type (2020-2032)
11.2.2. Market Revenue and Forecast, by Capacity (2020-2032)
11.2.3. Market Revenue and Forecast, by Application (2020-2032)
11.2.4. UK
11.2.4.1. Market Revenue and Forecast, by Type (2020-2032)
11.2.4.2. Market Revenue and Forecast, by Capacity (2020-2032)
11.2.4.3. Market Revenue and Forecast, by Application (2020-2032)
11.2.5. Germany
11.2.5.1. Market Revenue and Forecast, by Type (2020-2032)
11.2.5.2. Market Revenue and Forecast, by Capacity (2020-2032)
11.2.5.3. Market Revenue and Forecast, by Application (2020-2032)
11.2.6. France
11.2.6.1. Market Revenue and Forecast, by Type (2020-2032)
11.2.6.2. Market Revenue and Forecast, by Capacity (2020-2032)
11.2.6.3. Market Revenue and Forecast, by Application (2020-2032)
11.2.7. Rest of Europe
11.2.7.1. Market Revenue and Forecast, by Type (2020-2032)
11.2.7.2. Market Revenue and Forecast, by Capacity (2020-2032)
11.2.7.3. Market Revenue and Forecast, by Application (2020-2032)
11.3. APAC
11.3.1. Market Revenue and Forecast, by Type (2020-2032)
11.3.2. Market Revenue and Forecast, by Capacity (2020-2032)
11.3.3. Market Revenue and Forecast, by Application (2020-2032)
11.3.4. India
11.3.4.1. Market Revenue and Forecast, by Type (2020-2032)
11.3.4.2. Market Revenue and Forecast, by Capacity (2020-2032)
11.3.4.3. Market Revenue and Forecast, by Application (2020-2032)
11.3.5. China
11.3.5.1. Market Revenue and Forecast, by Type (2020-2032)
11.3.5.2. Market Revenue and Forecast, by Capacity (2020-2032)
11.3.5.3. Market Revenue and Forecast, by Application (2020-2032)
11.3.6. Japan
11.3.6.1. Market Revenue and Forecast, by Type (2020-2032)
11.3.6.2. Market Revenue and Forecast, by Capacity (2020-2032)
11.3.6.3. Market Revenue and Forecast, by Application (2020-2032)
11.3.7. Rest of APAC
11.3.7.1. Market Revenue and Forecast, by Type (2020-2032)
11.3.7.2. Market Revenue and Forecast, by Capacity (2020-2032)
11.3.7.3. Market Revenue and Forecast, by Application (2020-2032)
11.4. MEA
11.4.1. Market Revenue and Forecast, by Type (2020-2032)
11.4.2. Market Revenue and Forecast, by Capacity (2020-2032)
11.4.3. Market Revenue and Forecast, by Application (2020-2032)
11.4.4. GCC
11.4.4.1. Market Revenue and Forecast, by Type (2020-2032)
11.4.4.2. Market Revenue and Forecast, by Capacity (2020-2032)
11.4.4.3. Market Revenue and Forecast, by Application (2020-2032)
11.4.5. North Africa
11.4.5.1. Market Revenue and Forecast, by Type (2020-2032)
11.4.5.2. Market Revenue and Forecast, by Capacity (2020-2032)
11.4.5.3. Market Revenue and Forecast, by Application (2020-2032)
11.4.6. South Africa
11.4.6.1. Market Revenue and Forecast, by Type (2020-2032)
11.4.6.2. Market Revenue and Forecast, by Capacity (2020-2032)
11.4.6.3. Market Revenue and Forecast, by Application (2020-2032)
11.4.7. Rest of MEA
11.4.7.1. Market Revenue and Forecast, by Type (2020-2032)
11.4.7.2. Market Revenue and Forecast, by Capacity (2020-2032)
11.4.7.3. Market Revenue and Forecast, by Application (2020-2032)
11.5. Latin America
11.5.1. Market Revenue and Forecast, by Type (2020-2032)
11.5.2. Market Revenue and Forecast, by Capacity (2020-2032)
11.5.3. Market Revenue and Forecast, by Application (2020-2032)
11.5.4. Brazil
11.5.4.1. Market Revenue and Forecast, by Type (2020-2032)
11.5.4.2. Market Revenue and Forecast, by Capacity (2020-2032)
11.5.4.3. Market Revenue and Forecast, by Application (2020-2032)
11.5.5. Rest of LATAM
11.5.5.1. Market Revenue and Forecast, by Type (2020-2032)
11.5.5.2. Market Revenue and Forecast, by Capacity (2020-2032)
11.5.5.3. Market Revenue and Forecast, by Application (2020-2032)
Chapter 12. Company Profiles
12.1. Nel Hydrogen (Norway)
12.1.1. Company Overview
12.1.2. Product Offerings
12.1.3. Financial Performance
12.1.4. Recent Initiatives
12.2. Asahi Kasei (Japan)
12.2.1. Company Overview
12.2.2. Product Offerings
12.2.3. Financial Performance
12.2.4. Recent Initiatives
12.3. Hydrogenics (Canada)
12.3.1. Company Overview
12.3.2. Product Offerings
12.3.3. Financial Performance
12.3.4. Recent Initiatives
12.4. Shandong Saikesaisi Hydrogen Energy Co., Ltd. (China)
12.4.1. Company Overview
12.4.2. Product Offerings
12.4.3. Financial Performance
12.4.4. Recent Initiatives
12.5. Teledyne Energy Systems (U.S.)
12.5.1. Company Overview
12.5.2. Product Offerings
12.5.3. Financial Performance
12.5.4. Recent Initiatives
12.6. Siemens (Germany)
12.6.1. Company Overview
12.6.2. Product Offerings
12.6.3. Financial Performance
12.6.4. Recent Initiatives
12.7. Kobelco Eco-Solutions (U.S.)
12.7.1. Company Overview
12.7.2. Product Offerings
12.7.3. Financial Performance
12.7.4. Recent Initiatives
12.8. Green Hydrogen Systems (Denmark)
12.8.1. Company Overview
12.8.2. Product Offerings
12.8.3. Financial Performance
12.8.4. Recent Initiatives
12.9. Next Hydrogen (Canada)
12.9.1. Company Overview
12.9.2. Product Offerings
12.9.3. Financial Performance
12.9.4. Recent Initiatives
12.10. H-Tec Systems (Germany)
12.10.1. Company Overview
12.10.2. Product Offerings
12.10.3. Financial Performance
12.10.4. Recent Initiatives
Chapter 13. Research Methodology
13.1. Primary Research
13.2. Secondary Research
13.3. Assumptions
Chapter 14. Appendix
14.1. About Us
14.2. Glossary of Terms
 Cross-segment Market Size and Analysis for
Mentioned Segments
Additional Company Profiles (Upto 5 With No Cost)
Additional Countries (Apart From Mentioned Countries)
Country/Region-specific Report
Go To Market Strategy
Region Specific Market DynamicsRegion Level Market Share Import Export AnalysisProduction AnalysisOthers
Cross-segment Market Size and Analysis for
Mentioned Segments
Additional Company Profiles (Upto 5 With No Cost)
Additional Countries (Apart From Mentioned Countries)
Country/Region-specific Report
Go To Market Strategy
Region Specific Market DynamicsRegion Level Market Share Import Export AnalysisProduction AnalysisOthers