Electronic Materials And Chemicals Market Size, Growth, Trends | Report 2023-2032
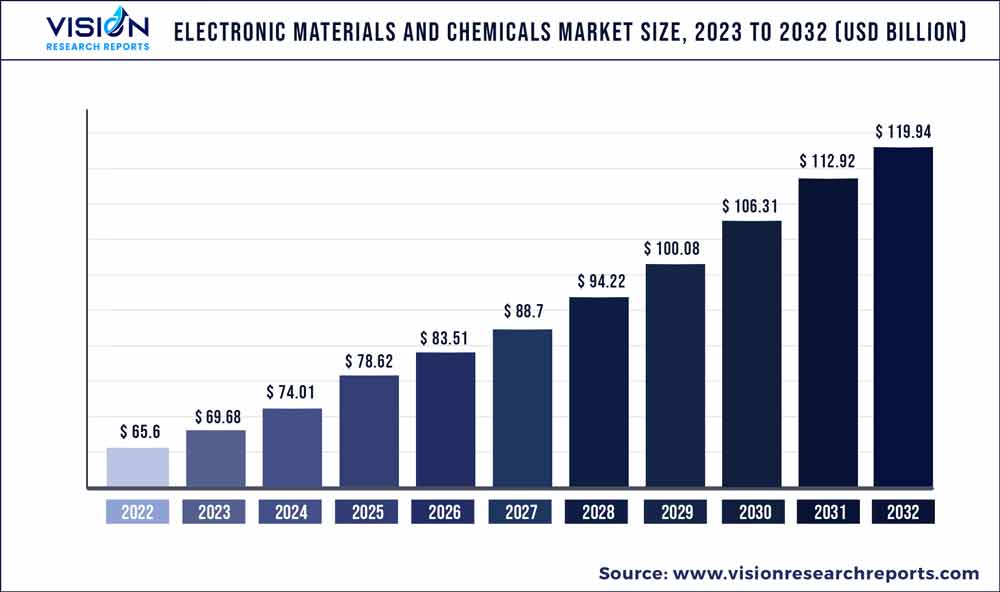
The global electronic materials and chemicals market size was estimated at around USD 65.6 billion in 2022 and it is projected to hit around USD 119.94 billion by 2032, growing at a CAGR of 6.22% from 2023 to 2032.
Key Pointers
Report Scope of the Electronic Materials And Chemicals Market
| Report Coverage | Details |
| Market Size in 2022 | USD 65.6 billion |
| Revenue Forecast by 2032 | USD 119.94 billion |
| Growth rate from 2023 to 2032 | CAGR of 6.22% |
| Base Year | 2022 |
| Forecast Period | 2023 to 2032 |
| Market Analysis (Terms Used) | Value (US$ Million/Billion) or (Volume/Units) |
| Regions Covered | North America, Europe, Asia Pacific, Latin America, Middle East & Africa |
| Companies Covered | Air Products & Chemicals Inc.; Bayer Ag; Albemarle Corporation; Ashland Inc.; BASF Electronic Chemicals; Air Liquide Holdings Inc.; AZ Electronic Materials Plc; Honeywell International Inc.; Cabot Microelectronics Corporation; Linde Group; Dow Chemical Company; KMG Chemicals Inc.; Hitachi Chemical Company; Sumitomo Chemical; Monsanto Electronic Materials Co.; Brewer Science; Drex-Chem Technologies; EKC Technology; HD Microsystems; High Purity Products |
Electronic materials & chemicals are an essential part of the electronic device manufacturing process. Increasing technological advancements in manufacturing electronic products owing to rising consumer demand for high-tech goods are expected to propel the product demand over the forecast period.
The consumer electronics segment is anticipated to drive market growth owing to significant demand from emerging economies including India, Indonesia, and Vietnam. China is the largest manufacturer of consumer electronics and is a major consumer of semiconductors and PCB. This trend is expected to continue over the forecast owing to the growing emergence of low-cost manufacturers in the country.
Rising R&D initiatives employed by manufacturers to develop advanced electronic materials which provide superior performance is expected to be a key factor driving growth over the forecast period. Rising demand for electronic equipment with lower energy consumption is likely to boost demand for use of new electronic Electronics such as organic and compound semiconductors. R&D related to the synthesis of bio-based and biodegradable materials and chemicals for the electronics industry is expected to drive the market’s growth.
The industry is characterized by the presence of numerous players with a strong foothold in the market. Fluctuating raw material prices and high competition is expected to pose a challenge for the industry players. Manufacturers are likely to establish production plants in the Asia Pacific to capitalize on high demand, low labor cost, land availability, and abundant raw material availability in the region.
Product Insights
Solid materials and chemicals dominated the product segment with a revenue share of more than 54.02% in 2022. Increasing product demand for manufacturing various consumer goods such as computers, laptops, and smartphones is expected to drive demand for solid electronic materials over the forecast period.
The liquid segment is expected to witness a significant CAGR of 6.33% over the forecast period. Growing demand for liquid electronic materials for cleaning and polishing the internal parts of electronic devices is expected to be a key driver for industry growth.
The gaseous electronic materials and chemicals demand was estimated at USD 6.09 billion in 2022 owing to their rising penetration in semiconductor and PCB manufacturing. Increasing demand for gaseous materials for manufacturing LEDs, solar photovoltaic, and flat panel displays are expected to drive growth over the forecast period.
Application Insights
Silicon wafers application dominated the market with a revenue share of over 43.1% in 2022. Increasing demand for PCB laminates in the manufacturing of various electronic products including amplifiers and LEDs is anticipated to positively impact the industry growth over the projected period.
Photoresist is expected to be the fastest-growing application segment and is likely to grow at a CAGR of 7.21%, from 2023 to 2032, owing to the growing demand for photoresists in microsystems and microelectronics. Photoresist involves the use of various chemicals which are used for many imaging and non-imaging applications.
PCB laminates accounted for 15.76% of total revenue in 2022 and are expected to witness significant growth over the forecast period. Increasing demand for PCB laminates in the manufacturing of various products including amplifiers and LEDs is anticipated to have a positive impact on the industry growth over the projected period.
End-use Insights
Semiconductors and integrated circuits dominated the end-use segment with a revenue share of over 68.03% in 2022. The semiconductors & integrated circuits are likely to witness significant growth over the next eight years owing to their rising applications in the telecom industry, consumer electronics industry, defense industry, and the automotive & transportation industry.
The Printed Circuit Boards (PCBs) segment is expected to witness a substantial CAGR over the forecast period. Increasing demand for printed circuit boards as vital components of integrated circuit chip technology that is used in consumer appliances, including smartphones, computers, and laptops is expected to boost the growth.
Increasing demand for semiconductors & integrated circuits for manufacturing computers and other consumer appliances is expected to be a key factor for the industry growth. Changing consumer lifestyles coupled with increasing consumer disposable income is likely to boost demand for consumer appliances, thereby driving the market’s growth.
Regional Insights
Asia Pacific dominated the market with a revenue share of more than 68.06% in 2022. The region is anticipated to continue its dominance over the forecast period. Rapid industrialization and the presence of numerous electronic device manufacturers in Asian countries including China, Taiwan, Japan, and South Korea are expected to positively impact the industry’s growth.
Middle East & Africa is expected to be the third fastest growing region owing to the increasing adoption of new technologies coupled with the technology-savvy population in the countries such as UAE, Qatar, and Saudi Arabia. The region is expected to grow exceptionally in solar applications, which is expected to drive the demand for silicon wafers.
As a result, the demand for electronic chemicals and materials required for manufacturing silicon wafers and semiconductors is expected to rise. Growing foreign investments in the manufacturing field coupled with rising consumer goods demand in the Middle East is expected to open new avenues for electronic materials & chemicals over the forecast period.
North America stood at USD 7.49 billion in 2022, owing to the large number of electronic device manufacturers in the region including Micron, Intel, Fairchild, Texas Instruments, and Avago. These players are engaged in the manufacturing of digital and analog semiconductor technologies for the end-users, thereby propelling product demand over the forecast period.
North America is a key player in specialty gases and is expected to grow in near future owing to the increasing demand for plasma display panels and photovoltaic products. However, the region is likely to face strong competition from Asian countries including China, Taiwan, and Japan, which are growing at higher CAGRs owing to the rapid developments in the electronic industry.
Europe is expected to witness substantial growth during the forecast period, owing to rising application across end-use industries such as electrical & electronics and automotive. The burgeoning production of hand-held gadgets is anticipated to bring about a surge in the manufacturing of electronic components, thereby propelling industry growth.
The constantly increasing applications of electronic and chemical materials are anticipated to take the concerned market to newer heights in Europe. The major applications include sand carving, microelectronics, and fabrication of printed circuit boards, solar voltaic cells, and semiconductors.
The increasing population coupled with rapidly growing markets in Europe, especially U.K., Germany, and France, is expected to bring about an upturn in the usage of a variety of products including electronic gadgets, and solar water heaters. The growing production of this merchandise is expected to bring about an upsurge in the electronic and chemical materials industry during the next eight years.
Electronic Materials And Chemicals Market Segmentations:
By Product
By Application
By End-use
By Regional
Chapter 1. Introduction
1.1. Research Objective
1.2. Scope of the Study
1.3. Definition
Chapter 2. Research Methodology
2.1. Research Approach
2.2. Data Sources
2.3. Assumptions & Limitations
Chapter 3. Executive Summary
3.1. Market Snapshot
Chapter 4. Market Variables and Scope
4.1. Introduction
4.2. Market Classification and Scope
4.3. Industry Value Chain Analysis
4.3.1. Raw Material Procurement Analysis
4.3.2. Sales and Distribution Product Analysis
4.3.3. Downstream Buyer Analysis
Chapter 5. COVID 19 Impact on Electronic Materials And Chemicals Market
5.1. COVID-19 Landscape: Electronic Materials And Chemicals Industry Impact
5.2. COVID 19 - Impact Assessment for the Industry
5.3. COVID 19 Impact: Global Major Government Policy
5.4. Market Trends and Opportunities in the COVID-19 Landscape
Chapter 6. Market Dynamics Analysis and Trends
6.1. Market Dynamics
6.1.1. Market Drivers
6.1.2. Market Restraints
6.1.3. Market Opportunities
6.2. Porter’s Five Forces Analysis
6.2.1. Bargaining power of suppliers
6.2.2. Bargaining power of buyers
6.2.3. Threat of substitute
6.2.4. Threat of new entrants
6.2.5. Degree of competition
Chapter 7. Competitive Landscape
7.1.1. Company Market Share/Positioning Analysis
7.1.2. Key Strategies Adopted by Players
7.1.3. Vendor Landscape
7.1.3.1. List of Suppliers
7.1.3.2. List of Buyers
Chapter 8. Global Electronic Materials And Chemicals Market, By Product
8.1. Electronic Materials And Chemicals Market, by Product, 2023-2032
8.1.1 Solid
8.1.1.1. Market Revenue and Forecast (2020-2032)
8.1.2. Liquid
8.1.2.1. Market Revenue and Forecast (2020-2032)
8.1.3. Gaseous
8.1.3.1. Market Revenue and Forecast (2020-2032)
Chapter 9. Global Electronic Materials And Chemicals Market, By Application
9.1. Electronic Materials And Chemicals Market, by Application, 2023-2032
9.1.1. Silicon wafers
9.1.1.1. Market Revenue and Forecast (2020-2032)
9.1.2. PCB Laminates
9.1.2.1. Market Revenue and Forecast (2020-2032)
9.1.3. Specialty gases
9.1.3.1. Market Revenue and Forecast (2020-2032)
9.1.4. Wet chemicals and solvents
9.1.4.1. Market Revenue and Forecast (2020-2032)
9.1.5. Photoresists
9.1.5.1. Market Revenue and Forecast (2020-2032)
9.1.6. Other Applications
9.1.6.1. Market Revenue and Forecast (2020-2032)
Chapter 10. Global Electronic Materials And Chemicals Market, By End-use
10.1. Electronic Materials And Chemicals Market, by End-use, 2023-2032
10.1.1. Semiconductors & Integrated Circuits
10.1.1.1. Market Revenue and Forecast (2020-2032)
10.1.2. Printed Circuit Boards
10.1.2.1. Market Revenue and Forecast (2020-2032)
Chapter 11. Global Electronic Materials And Chemicals Market, Regional Estimates and Trend Forecast
11.1. North America
11.1.1. Market Revenue and Forecast, by Product (2020-2032)
11.1.2. Market Revenue and Forecast, by Application (2020-2032)
11.1.3. Market Revenue and Forecast, by End-use (2020-2032)
11.1.4. U.S.
11.1.4.1. Market Revenue and Forecast, by Product (2020-2032)
11.1.4.2. Market Revenue and Forecast, by Application (2020-2032)
11.1.4.3. Market Revenue and Forecast, by End-use (2020-2032)
11.1.5. Rest of North America
11.1.5.1. Market Revenue and Forecast, by Product (2020-2032)
11.1.5.2. Market Revenue and Forecast, by Application (2020-2032)
11.1.5.3. Market Revenue and Forecast, by End-use (2020-2032)
11.2. Europe
11.2.1. Market Revenue and Forecast, by Product (2020-2032)
11.2.2. Market Revenue and Forecast, by Application (2020-2032)
11.2.3. Market Revenue and Forecast, by End-use (2020-2032)
11.2.4. UK
11.2.4.1. Market Revenue and Forecast, by Product (2020-2032)
11.2.4.2. Market Revenue and Forecast, by Application (2020-2032)
11.2.4.3. Market Revenue and Forecast, by End-use (2020-2032)
11.2.5. Germany
11.2.5.1. Market Revenue and Forecast, by Product (2020-2032)
11.2.5.2. Market Revenue and Forecast, by Application (2020-2032)
11.2.5.3. Market Revenue and Forecast, by End-use (2020-2032)
11.2.6. France
11.2.6.1. Market Revenue and Forecast, by Product (2020-2032)
11.2.6.2. Market Revenue and Forecast, by Application (2020-2032)
11.2.6.3. Market Revenue and Forecast, by End-use (2020-2032)
11.2.7. Rest of Europe
11.2.7.1. Market Revenue and Forecast, by Product (2020-2032)
11.2.7.2. Market Revenue and Forecast, by Application (2020-2032)
11.2.7.3. Market Revenue and Forecast, by End-use (2020-2032)
11.3. APAC
11.3.1. Market Revenue and Forecast, by Product (2020-2032)
11.3.2. Market Revenue and Forecast, by Application (2020-2032)
11.3.3. Market Revenue and Forecast, by End-use (2020-2032)
11.3.4. India
11.3.4.1. Market Revenue and Forecast, by Product (2020-2032)
11.3.4.2. Market Revenue and Forecast, by Application (2020-2032)
11.3.4.3. Market Revenue and Forecast, by End-use (2020-2032)
11.3.5. China
11.3.5.1. Market Revenue and Forecast, by Product (2020-2032)
11.3.5.2. Market Revenue and Forecast, by Application (2020-2032)
11.3.5.3. Market Revenue and Forecast, by End-use (2020-2032)
11.3.6. Japan
11.3.6.1. Market Revenue and Forecast, by Product (2020-2032)
11.3.6.2. Market Revenue and Forecast, by Application (2020-2032)
11.3.6.3. Market Revenue and Forecast, by End-use (2020-2032)
11.3.7. Rest of APAC
11.3.7.1. Market Revenue and Forecast, by Product (2020-2032)
11.3.7.2. Market Revenue and Forecast, by Application (2020-2032)
11.3.7.3. Market Revenue and Forecast, by End-use (2020-2032)
11.4. MEA
11.4.1. Market Revenue and Forecast, by Product (2020-2032)
11.4.2. Market Revenue and Forecast, by Application (2020-2032)
11.4.3. Market Revenue and Forecast, by End-use (2020-2032)
11.4.4. GCC
11.4.4.1. Market Revenue and Forecast, by Product (2020-2032)
11.4.4.2. Market Revenue and Forecast, by Application (2020-2032)
11.4.4.3. Market Revenue and Forecast, by End-use (2020-2032)
11.4.5. North Africa
11.4.5.1. Market Revenue and Forecast, by Product (2020-2032)
11.4.5.2. Market Revenue and Forecast, by Application (2020-2032)
11.4.5.3. Market Revenue and Forecast, by End-use (2020-2032)
11.4.6. South Africa
11.4.6.1. Market Revenue and Forecast, by Product (2020-2032)
11.4.6.2. Market Revenue and Forecast, by Application (2020-2032)
11.4.6.3. Market Revenue and Forecast, by End-use (2020-2032)
11.4.7. Rest of MEA
11.4.7.1. Market Revenue and Forecast, by Product (2020-2032)
11.4.7.2. Market Revenue and Forecast, by Application (2020-2032)
11.4.7.3. Market Revenue and Forecast, by End-use (2020-2032)
11.5. Latin America
11.5.1. Market Revenue and Forecast, by Product (2020-2032)
11.5.2. Market Revenue and Forecast, by Application (2020-2032)
11.5.3. Market Revenue and Forecast, by End-use (2020-2032)
11.5.4. Brazil
11.5.4.1. Market Revenue and Forecast, by Product (2020-2032)
11.5.4.2. Market Revenue and Forecast, by Application (2020-2032)
11.5.4.3. Market Revenue and Forecast, by End-use (2020-2032)
11.5.5. Rest of LATAM
11.5.5.1. Market Revenue and Forecast, by Product (2020-2032)
11.5.5.2. Market Revenue and Forecast, by Application (2020-2032)
11.5.5.3. Market Revenue and Forecast, by End-use (2020-2032)
Chapter 12. Company Profiles
12.1. Air Products & Chemicals Inc.
12.1.1. Company Overview
12.1.2. Product Offerings
12.1.3. Financial Performance
12.1.4. Recent Initiatives
12.2. Bayer Ag
12.2.1. Company Overview
12.2.2. Product Offerings
12.2.3. Financial Performance
12.2.4. Recent Initiatives
12.3. Albemarle Corporation
12.3.1. Company Overview
12.3.2. Product Offerings
12.3.3. Financial Performance
12.3.4. Recent Initiatives
12.4. Ashland Inc.
12.4.1. Company Overview
12.4.2. Product Offerings
12.4.3. Financial Performance
12.4.4. Recent Initiatives
12.5. BASF Electronic Chemicals
12.5.1. Company Overview
12.5.2. Product Offerings
12.5.3. Financial Performance
12.5.4. Recent Initiatives
12.6. Air Liquide Holdings Inc.
12.6.1. Company Overview
12.6.2. Product Offerings
12.6.3. Financial Performance
12.6.4. Recent Initiatives
12.7. AZ Electronic Materials Plc
12.7.1. Company Overview
12.7.2. Product Offerings
12.7.3. Financial Performance
12.7.4. Recent Initiatives
12.8. Honeywell International Inc.
12.8.1. Company Overview
12.8.2. Product Offerings
12.8.3. Financial Performance
12.8.4. Recent Initiatives
12.9. Cabot Microelectronics Corporation
12.9.1. Company Overview
12.9.2. Product Offerings
12.9.3. Financial Performance
12.9.4. Recent Initiatives
12.10. Linde Group
12.10.1. Company Overview
12.10.2. Product Offerings
12.10.3. Financial Performance
12.10.4. Recent Initiatives
Chapter 13. Research Methodology
13.1. Primary Research
13.2. Secondary Research
13.3. Assumptions
Chapter 14. Appendix
14.1. About Us
14.2. Glossary of Terms
 Cross-segment Market Size and Analysis for
Mentioned Segments
Additional Company Profiles (Upto 5 With No Cost)
Additional Countries (Apart From Mentioned Countries)
Country/Region-specific Report
Go To Market Strategy
Region Specific Market DynamicsRegion Level Market Share Import Export AnalysisProduction AnalysisOthers
Cross-segment Market Size and Analysis for
Mentioned Segments
Additional Company Profiles (Upto 5 With No Cost)
Additional Countries (Apart From Mentioned Countries)
Country/Region-specific Report
Go To Market Strategy
Region Specific Market DynamicsRegion Level Market Share Import Export AnalysisProduction AnalysisOthers