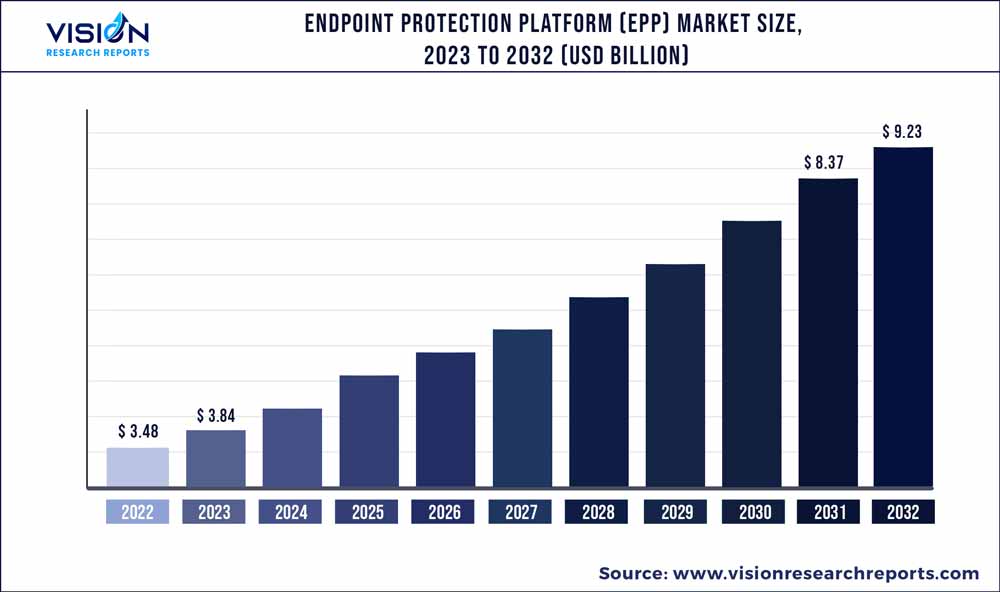
The global endpoint protection platform (EPP) market was estimated at USD 3.48 billion in 2022 and it is expected to surpass around USD 9.23 billion by 2032, poised to grow at a CAGR of 10.24% from 2023 to 2032. The endpoint protection platform (EPP) market in the United States was accounted for USD 883.7 million in 2022.

Key Pointers
Report Scope of the Endpoint Protection Platform (EPP) Market
| Report Coverage | Details |
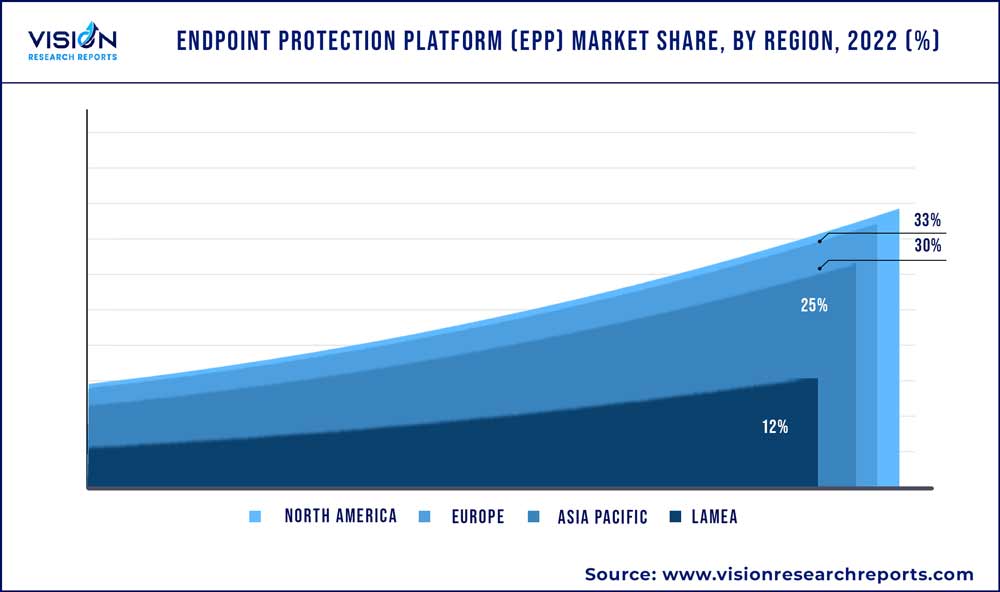
| Revenue Share of North America in 2022 | 33% |
| CAGR of Asia Pacific from 2023 to 2032 | 12.13% |
| Revenue Forecast by 2032 | USD 9.23 billion |
| Growth Rate from 2023 to 2032 | CAGR of 10.24% |
| Base Year | 2022 |
| Forecast Period | 2023 to 2032 |
| Market Analysis (Terms Used) | Value (US$ Million/Billion) or (Volume/Units) |
| Companies Covered | Bitdefender; Broadcom, Inc.; Cisco Systems; CrowdStrike; ESET; Fortinet; Kaspersky; McAfee; Microsoft Corporation; Palo Alto Networks; SentinelOne; Sophos; Trellix; Trend Micro; VMware Carbon Black |
The growing demand among end-users to protect their endpoint devices from traditional threats such as ransomware, fileless attacks, and zero-day vulnerabilities is anticipated to fuel the growth of the EPP market. The COVID-19 pandemic has significantly affected the market, as it has boosted the adoption of endpoint devices to execute official tasks due to the remote work structure. Rising concerns among various verticals to protect devices and enhance data security due to the remote working model is a major driving factor. EPP detects malicious threats using different techniques, such as sandboxing, static analysis, allowlisting and denylisting, signature matching, and behavioral analysis. The growing need for passive threat prevention among the verticals has surged the demand for the EPP market. The platform benefits in mitigating the risk of data breaches occurring at early stages. It enables the client to reduce the risk of malware infection, data loss, and other cyber threats.
Moreover, the Bring Your Own Device (BYOD) trend is propelling the growth of the endpoint protection platformmarket. Employees working across different industries have started using their personal devices for performing work-related tasks, which has increased the probability of hindering endpoint security. This has accelerated the need among vendors operating across different verticals to cater to data security issues and cybersecurity breaches by adopting EPP solutions and achieving greater visibility over every connected device.
However, one of the main market inhibitors for endpoint protection platforms is complexity. EPP solutions can be difficult to manage and implement, necessitating a high level of IT knowledge. The management of these solutions can be difficult for smaller organizations because they may require additional resources or knowledge.
Additionally, the complexity of EPP systems may rise as the number of apps and devices that must be controlled soars. This may result in higher costs, protracted implementation times, and a higher likelihood of mistakes. Many EPP manufacturers are concentrating on creating user-friendly and intuitive interfaces that make it simpler for organizations to manage their devices and apps in order to overcome such complexities.
Solution Insights
The software segment accounted for the largest market share of 65% in 2022. EPP software provides the highest level of protection features, such as data loss protection (DLP); protection from email threats, exploits, and malicious web downloads; behavioral monitoring; and rapid detection techniques. IT teams must set up security policies and protocols to certify that all devices comply with security standards.
Moreover, this solution also helps organizations ensure compliance with various regulatory standards, such as General Data Protection Regulation (GDPR), Health Insurance Portability and Accountability Act (HIPAA), and Payment Card Industry (PCI) Data Security Standard (DSS), by enforcing security policies and providing audit trails. This helps enterprises avoid consequences and reputational damage resulting from non-compliance.
The service segment is anticipated to advance at a CAGR of 10.92% during the forecast period. EPP services are very comprehensive and offer expert and personalized guidance, helping clients to identify risks, implement solutions, and secure endpoint devices against any future threats with assurance. The professional services segment is expected to be the fastest-growing segment, owing to the rising demand among organizations to recover vulnerabilities, reduce additional data loss, and conduct preemptive measures to overcome threats.
Deployment Insights
The cloud-based segment accounted for a market share of 56% in 2022. Cloud-based endpoint protection platforms refer to solutions that are managed and hosted in the cloud. Rather than installing and running an EPP solution on-premise, organizations can access EPP functionality over the Internet via a web-based interface.
This cloud-based platform enables the clients to monitor the endpoint devices from anywhere, thereby allowing the working staff to increase their efficiency across the office. The system's operator can alter its settings, install patches, approve devices, audit users, and carry out other functions with cloud-based endpoint protection from any location with an internet connection.
On the other hand, the on-premise segment is anticipated to expand at a CAGR of 8.83% during the forecast period in the endpoint protection platform (EPP) market. Organizations can fully customize on-premise EPP solutions to meet their unique demands and requirements since they have complete control over their endpoint protection architecture. On-premise EPP systems can provide a higher level of security, compliance, and data privacy than cloud-based solutions, even if they need more initial investment and IT personnel to establish and maintain the system.
Enterprise Size Insights
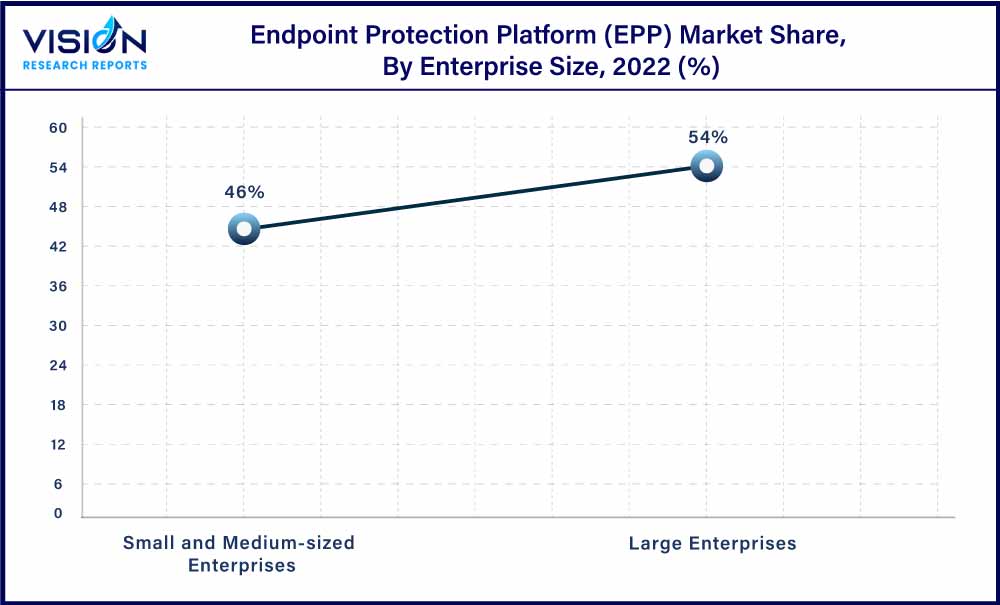
The large enterprise segment accounted for the largest market share of 54% in 2022. EPP solutions are being used more frequently by large businesses to protect devices from online threats. Large-scale businesses can leverage their many advantages, including higher production, better security, and cost savings. They offer complete transparency into the operations carried out on numerous servers, workstations, and laptops. To manage and secure their devices effectively while guaranteeing compliance with industry standards & data protection requirements, large companies are turning to EPP solutions.

The SMEs segment is expected to expand at the highest CAGR of 10.83% during the forecast period. SMEs require substantial IT budgets and resources, which makes it challenging to fully secure and provide real-time threat detection capabilities to their devices. EPP solutions can assist in detecting threats and securing the devices at an early stage, lessening the requirement for the IT team to monitor different devices, and extending the life of the devices by ensuring they are updated and well-maintained.
Vertical Insights
The BFSI segment accounted for the largest market share of 20% in 2022. The segment is highly susceptible to cyber threats due to the high volume of sensitive data they handle, making it crucial to have reliable security in one location. By identifying dangers that conventional antivirus software cannot, the EPP solution adds an additional layer of security. The technology also provides information on endpoint activity, allowing the BFSI industry to identify potential security loopholes and take proactive measures to solve cyber threats.
The retail & e-commerce segment is anticipated to expand at a CAGR of 12.95% during the forecast period. EPP systems have been used by retail and e-commerce industries to provide real-time visibility into endpoint activity and to enable the identification and protection of devices from sophisticated threats, including ransomware, malware, and cyber threats. Retailers can gain a competitive edge by utilizing EPP solutions, since they improve threat detection and reaction times, decrease the risk of data breaches, and provide real-time data visibility.
Regional Insights
North America held the major revenue share of 33% of the target market in 2022. The increasing adoption of endpoint devices, the rise in the Bring Your Own Device (BYOD) trend, and the requirement for data security are driving factors in the North American EPP market. Due to the widespread use of these devices and the concentration of major EPP vendors in the country, the U.S. is anticipated to hold the biggest market share through the forecast period.
North America is characterized by the presence of several key players in the industry, including Palo Alto Networks, SentinelOne, and Broadcom, Inc. These companies offer various EPP solutions that help organizations in conducting effective security measures to secure their data, network, and systems from cyber threats.

Asia Pacific is anticipated to emerge as the fastest-developing regional market at a CAGR of 12.13% during the projected period. Bring Your Own Device (BYOD) usage has rapidly increased in Asia Pacific, and rising government activities to assist cybersecurity compliances to safeguard data from threats have led to an increasing need for EPP solutions.
Additionally, as businesses hunt for scalable and affordable solutions, the need for cloud-based EPP is anticipated to support the growth of the Asia Pacific endpoint protection platform market. Due to the increased need among vendors to secure their endpoints from cyberattacks, the government, BFSI, and retail sectors are anticipated to be the region's key end consumers for EPP solutions.
Endpoint Protection Platform (EPP) Market Segmentations:
By Solution
By Deployment
By Enterprise Size
By Vertical
By Regional
Chapter 1. Introduction
1.1. Research Objective
1.2. Scope of the Study
1.3. Definition
Chapter 2. Research Methodology
2.1. Research Approach
2.2. Data Sources
2.3. Assumptions & Limitations
Chapter 3. Executive Summary
3.1. Market Snapshot
Chapter 4. Market Variables and Scope
4.1. Introduction
4.2. Market Classification and Scope
4.3. Industry Value Chain Analysis
4.3.1. Raw Material Procurement Analysis
4.3.2. Sales and Distribution Channel Analysis
4.3.3. Downstream Buyer Analysis
Chapter 5. COVID 19 Impact on Endpoint Protection Platform (EPP) Market
5.1. COVID-19 Landscape: Endpoint Protection Platform (EPP) Industry Impact
5.2. COVID 19 - Impact Assessment for the Industry
5.3. COVID 19 Impact: Global Major Government Policy
5.4. Market Trends and Opportunities in the COVID-19 Landscape
Chapter 6. Market Dynamics Analysis and Trends
6.1. Market Dynamics
6.1.1. Market Drivers
6.1.2. Market Restraints
6.1.3. Market Opportunities
6.2. Porter’s Five Forces Analysis
6.2.1. Bargaining power of suppliers
6.2.2. Bargaining power of buyers
6.2.3. Threat of substitute
6.2.4. Threat of new entrants
6.2.5. Degree of competition
Chapter 7. Competitive Landscape
7.1.1. Company Market Share/Positioning Analysis
7.1.2. Key Strategies Adopted by Players
7.1.3. Vendor Landscape
7.1.3.1. List of Suppliers
7.1.3.2. List of Buyers
Chapter 8. Global Endpoint Protection Platform (EPP) Market, By Solution
8.1. Endpoint Protection Platform (EPP) Market, by Solution, 2023-2032
8.1.1. Software
8.1.1.1. Market Revenue and Forecast (2020-2032)
8.1.2. Service
8.1.2.1. Market Revenue and Forecast (2020-2032)
Chapter 9. Global Endpoint Protection Platform (EPP) Market, By Deployment
9.1. Endpoint Protection Platform (EPP) Market, by Deployment, 2023-2032
9.1.1. Cloud
9.1.1.1. Market Revenue and Forecast (2020-2032)
9.1.2. On-premise
9.1.2.1. Market Revenue and Forecast (2020-2032)
Chapter 10. Global Endpoint Protection Platform (EPP) Market, By Enterprise Size
10.1. Endpoint Protection Platform (EPP) Market, by Enterprise Size, 2023-2032
10.1.1. Small and Medium-sized Enterprises
10.1.1.1. Market Revenue and Forecast (2020-2032)
10.1.2. Large Enterprises
10.1.2.1. Market Revenue and Forecast (2020-2032)
Chapter 11. Global Endpoint Protection Platform (EPP) Market, By Vertical
11.1. Endpoint Protection Platform (EPP) Market, by Vertical, 2023-2032
11.1.1. Banking, Financial Services, and Insurance (BFSI)
11.1.1.1. Market Revenue and Forecast (2020-2032)
11.1.2. Healthcare and Life Sciences
11.1.2.1. Market Revenue and Forecast (2020-2032)
11.1.3. Government and Defense
11.1.3.1. Market Revenue and Forecast (2020-2032)
11.1.4. Retail and eCommerce
11.1.4.1. Market Revenue and Forecast (2020-2032)
11.1.5. IT and Telecom
11.1.5.1. Market Revenue and Forecast (2020-2032)
11.1.6. Energy and Utilities
11.1.6.1. Market Revenue and Forecast (2020-2032)
11.1.7. Manufacturing
11.1.7.1. Market Revenue and Forecast (2020-2032)
11.1.8. Others
11.1.8.1. Market Revenue and Forecast (2020-2032)
Chapter 12. Global Endpoint Protection Platform (EPP) Market, Regional Estimates and Trend Forecast
12.1. North America
12.1.1. Market Revenue and Forecast, by Solution (2020-2032)
12.1.2. Market Revenue and Forecast, by Deployment (2020-2032)
12.1.3. Market Revenue and Forecast, by Enterprise Size (2020-2032)
12.1.4. Market Revenue and Forecast, by Vertical (2020-2032)
12.1.5. U.S.
12.1.5.1. Market Revenue and Forecast, by Solution (2020-2032)
12.1.5.2. Market Revenue and Forecast, by Deployment (2020-2032)
12.1.5.3. Market Revenue and Forecast, by Enterprise Size (2020-2032)
12.1.5.4. Market Revenue and Forecast, by Vertical (2020-2032)
12.1.6. Rest of North America
12.1.6.1. Market Revenue and Forecast, by Solution (2020-2032)
12.1.6.2. Market Revenue and Forecast, by Deployment (2020-2032)
12.1.6.3. Market Revenue and Forecast, by Enterprise Size (2020-2032)
12.1.6.4. Market Revenue and Forecast, by Vertical (2020-2032)
12.2. Europe
12.2.1. Market Revenue and Forecast, by Solution (2020-2032)
12.2.2. Market Revenue and Forecast, by Deployment (2020-2032)
12.2.3. Market Revenue and Forecast, by Enterprise Size (2020-2032)
12.2.4. Market Revenue and Forecast, by Vertical (2020-2032)
12.2.5. UK
12.2.5.1. Market Revenue and Forecast, by Solution (2020-2032)
12.2.5.2. Market Revenue and Forecast, by Deployment (2020-2032)
12.2.5.3. Market Revenue and Forecast, by Enterprise Size (2020-2032)
12.2.5.4. Market Revenue and Forecast, by Vertical (2020-2032)
12.2.6. Germany
12.2.6.1. Market Revenue and Forecast, by Solution (2020-2032)
12.2.6.2. Market Revenue and Forecast, by Deployment (2020-2032)
12.2.6.3. Market Revenue and Forecast, by Enterprise Size (2020-2032)
12.2.6.4. Market Revenue and Forecast, by Vertical (2020-2032)
12.2.7. France
12.2.7.1. Market Revenue and Forecast, by Solution (2020-2032)
12.2.7.2. Market Revenue and Forecast, by Deployment (2020-2032)
12.2.7.3. Market Revenue and Forecast, by Enterprise Size (2020-2032)
12.2.7.4. Market Revenue and Forecast, by Vertical (2020-2032)
12.2.8. Rest of Europe
12.2.8.1. Market Revenue and Forecast, by Solution (2020-2032)
12.2.8.2. Market Revenue and Forecast, by Deployment (2020-2032)
12.2.8.3. Market Revenue and Forecast, by Enterprise Size (2020-2032)
12.2.8.4. Market Revenue and Forecast, by Vertical (2020-2032)
12.3. APAC
12.3.1. Market Revenue and Forecast, by Solution (2020-2032)
12.3.2. Market Revenue and Forecast, by Deployment (2020-2032)
12.3.3. Market Revenue and Forecast, by Enterprise Size (2020-2032)
12.3.4. Market Revenue and Forecast, by Vertical (2020-2032)
12.3.5. India
12.3.5.1. Market Revenue and Forecast, by Solution (2020-2032)
12.3.5.2. Market Revenue and Forecast, by Deployment (2020-2032)
12.3.5.3. Market Revenue and Forecast, by Enterprise Size (2020-2032)
12.3.5.4. Market Revenue and Forecast, by Vertical (2020-2032)
12.3.6. China
12.3.6.1. Market Revenue and Forecast, by Solution (2020-2032)
12.3.6.2. Market Revenue and Forecast, by Deployment (2020-2032)
12.3.6.3. Market Revenue and Forecast, by Enterprise Size (2020-2032)
12.3.6.4. Market Revenue and Forecast, by Vertical (2020-2032)
12.3.7. Japan
12.3.7.1. Market Revenue and Forecast, by Solution (2020-2032)
12.3.7.2. Market Revenue and Forecast, by Deployment (2020-2032)
12.3.7.3. Market Revenue and Forecast, by Enterprise Size (2020-2032)
12.3.7.4. Market Revenue and Forecast, by Vertical (2020-2032)
12.3.8. Rest of APAC
12.3.8.1. Market Revenue and Forecast, by Solution (2020-2032)
12.3.8.2. Market Revenue and Forecast, by Deployment (2020-2032)
12.3.8.3. Market Revenue and Forecast, by Enterprise Size (2020-2032)
12.3.8.4. Market Revenue and Forecast, by Vertical (2020-2032)
12.4. MEA
12.4.1. Market Revenue and Forecast, by Solution (2020-2032)
12.4.2. Market Revenue and Forecast, by Deployment (2020-2032)
12.4.3. Market Revenue and Forecast, by Enterprise Size (2020-2032)
12.4.4. Market Revenue and Forecast, by Vertical (2020-2032)
12.4.5. GCC
12.4.5.1. Market Revenue and Forecast, by Solution (2020-2032)
12.4.5.2. Market Revenue and Forecast, by Deployment (2020-2032)
12.4.5.3. Market Revenue and Forecast, by Enterprise Size (2020-2032)
12.4.5.4. Market Revenue and Forecast, by Vertical (2020-2032)
12.4.6. North Africa
12.4.6.1. Market Revenue and Forecast, by Solution (2020-2032)
12.4.6.2. Market Revenue and Forecast, by Deployment (2020-2032)
12.4.6.3. Market Revenue and Forecast, by Enterprise Size (2020-2032)
12.4.6.4. Market Revenue and Forecast, by Vertical (2020-2032)
12.4.7. South Africa
12.4.7.1. Market Revenue and Forecast, by Solution (2020-2032)
12.4.7.2. Market Revenue and Forecast, by Deployment (2020-2032)
12.4.7.3. Market Revenue and Forecast, by Enterprise Size (2020-2032)
12.4.7.4. Market Revenue and Forecast, by Vertical (2020-2032)
12.4.8. Rest of MEA
12.4.8.1. Market Revenue and Forecast, by Solution (2020-2032)
12.4.8.2. Market Revenue and Forecast, by Deployment (2020-2032)
12.4.8.3. Market Revenue and Forecast, by Enterprise Size (2020-2032)
12.4.8.4. Market Revenue and Forecast, by Vertical (2020-2032)
12.5. Latin America
12.5.1. Market Revenue and Forecast, by Solution (2020-2032)
12.5.2. Market Revenue and Forecast, by Deployment (2020-2032)
12.5.3. Market Revenue and Forecast, by Enterprise Size (2020-2032)
12.5.4. Market Revenue and Forecast, by Vertical (2020-2032)
12.5.5. Brazil
12.5.5.1. Market Revenue and Forecast, by Solution (2020-2032)
12.5.5.2. Market Revenue and Forecast, by Deployment (2020-2032)
12.5.5.3. Market Revenue and Forecast, by Enterprise Size (2020-2032)
12.5.5.4. Market Revenue and Forecast, by Vertical (2020-2032)
12.5.6. Rest of LATAM
12.5.6.1. Market Revenue and Forecast, by Solution (2020-2032)
12.5.6.2. Market Revenue and Forecast, by Deployment (2020-2032)
12.5.6.3. Market Revenue and Forecast, by Enterprise Size (2020-2032)
12.5.6.4. Market Revenue and Forecast, by Vertical (2020-2032)
Chapter 13. Company Profiles
13.1. Bitdefender
13.1.1. Company Overview
13.1.2. Product Offerings
13.1.3. Financial Performance
13.1.4. Recent Initiatives
13.2. Broadcom, Inc
13.2.1. Company Overview
13.2.2. Product Offerings
13.2.3. Financial Performance
13.2.4. Recent Initiatives
13.3. Cisco Systems
13.3.1. Company Overview
13.3.2. Product Offerings
13.3.3. Financial Performance
13.3.4. Recent Initiatives
13.4. CrowdStrike
13.4.1. Company Overview
13.4.2. Product Offerings
13.4.3. Financial Performance
13.4.4. Recent Initiatives
13.5. ESET
13.5.1. Company Overview
13.5.2. Product Offerings
13.5.3. Financial Performance
13.5.4. Recent Initiatives
13.6. Fortinet
13.6.1. Company Overview
13.6.2. Product Offerings
13.6.3. Financial Performance
13.6.4. Recent Initiatives
13.7. Kaspersky
13.7.1. Company Overview
13.7.2. Product Offerings
13.7.3. Financial Performance
13.7.4. Recent Initiatives
13.8. McAfee
13.8.1. Company Overview
13.8.2. Product Offerings
13.8.3. Financial Performance
13.8.4. Recent Initiatives
13.9. Microsoft Corporation
13.9.1. Company Overview
13.9.2. Product Offerings
13.9.3. Financial Performance
13.9.4. Recent Initiatives
13.10. Palo Alto Networks
13.10.1. Company Overview
13.10.2. Product Offerings
13.10.3. Financial Performance
13.10.4. Recent Initiatives
Chapter 14. Research Methodology
14.1. Primary Research
14.2. Secondary Research
14.3. Assumptions
Chapter 15. Appendix
15.1. About Us
15.2. Glossary of Terms
 Cross-segment Market Size and Analysis for
Mentioned Segments
 Additional Company Profiles (Upto 5 With No Cost)
 Additional Countries (Apart From Mentioned Countries)
 Country/Region-specific Report
 Go To Market Strategy
 Region Specific Market Dynamics
 Region Level Market Share
 Import Export Analysis
 Production Analysis
 Others