Energy Management Systems Market Size, Growth, Trends | Report 2023-2032
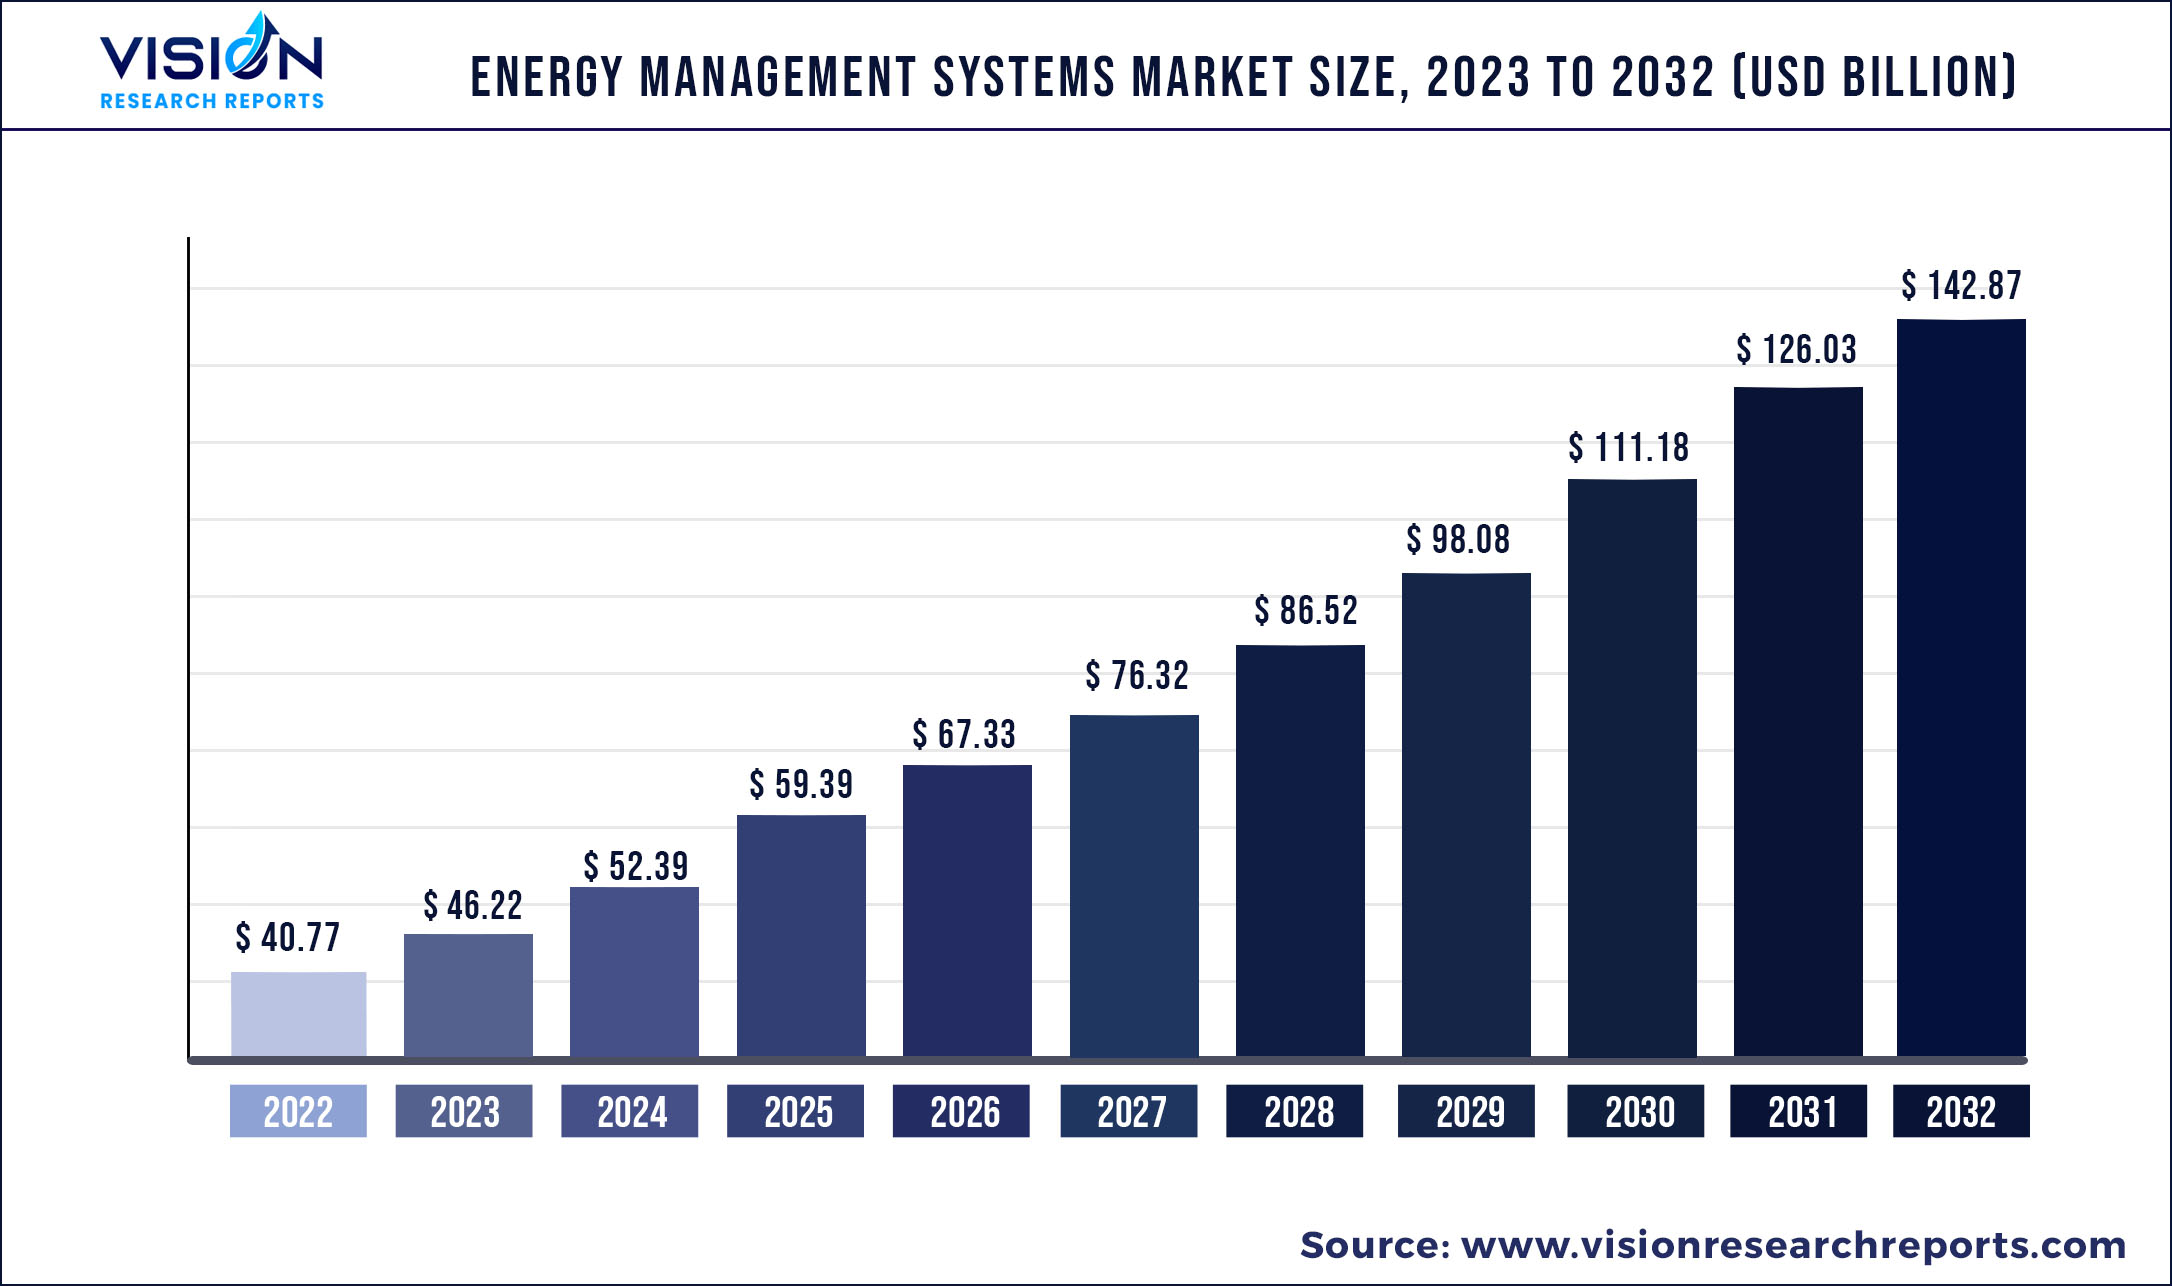
The global energy management systems market was estimated at USD 40.77 billion in 2022 and it is expected to surpass around USD 142.87 billion by 2032, poised to grow at a CAGR of 13.36% from 2023 to 2032.
Key Pointers
| Report Coverage | Details |
| Market Size in 2022 | USD 40.77 billion |
| Revenue Forecast by 2032 | USD 142.87 billion |
| Growth rate from 2023 to 2032 | CAGR of 13.36% |
| Base Year | 2022 |
| Forecast Period | 2023 to 2032 |
| Regions Covered | North America, Europe, Asia Pacific, Latin America, Middle East & Africa |
| Companies Covered | Schneider Electric SE; Honeywell International Inc.; Siemens AG; Johnson Controls, Inc.; C3.ai; Inc.; GridPoint; General Electric; ABB; International Business Machines Corporation; Cisco Systems, Inc. |
An uptick in the management of energy use across commercial, industrial, and public sector organizations has fueled the demand for energy management systems (EMS). Implementing advanced energy-efficient technologies and reducing energy waste will gain ground to contain greenhouse gas emissions, minimize the potential exposure to fluctuating energy prices and bolster productivity. In February 2020, the World Resources Institute cited data suggesting that energy consumption was the biggest source of human-caused greenhouse gas emissions. Amidst the prevailing trend, industry players could seek IoT-based solutions to optimize energy consumption and control the energy flow.
The competitive landscape alludes to strategic planning, such as technological advancements, collaborations, product offerings, mergers & acquisitions, and geographical expansion to gain momentum globally. For instance, in July 2022, Eaton collaborated with the EU-backed Flow Consortium (24 external partners and six leading universities across Europe) to develop and demonstrate an integrated electric vehicle charging infrastructure. The USD 10.4 million project, under the aegis of EU’s Horizon Europe Research and Innovation program, could span till March 2026.
The robust pace of digitization in the energy landscape, along with the paradigm shift witnessed in electrification, has fostered the demand for energy management system software. EMS plays an invaluable role in helping companies identify opportunities to enhance and adopt energy-saving technologies. EMS is likely to receive impetus to provide stability in energy provision, flexibility in power generation and boost energy efficiency. Furthermore, the environmentally friendly energy consumer framework will emphasize quality and occupancy sensors to regulate energy consumption. Technologies to minimize energy consumption may lead to the decarbonization trend to avoid using fossil fuels.
State-of-the-art technologies, such as edge AI have gained considerable traction across advanced and emerging economies, mainly due to the onslaught of the COVID-19 pandemic. The prevalence of hybrid work culture and rotating class schedules furthered the trend for smart building management. Additionally, edge AI has underscored building management system (BMS) to bolster safety, minimize energy consumption, better utilize building assets and offer increased occupant comfort. The outbreak prompted building managers to prioritize AI-leveraged BMS and optimize and automate energy usage. The post-COVID outlook suggests an emphasis on EMS could pave the way for low-carbon economic growth.
Energy Management Systems Market Segmentations:
| By System Type | By Component | By Deployment | By Vertical |
|
Industrial energy management systems (IEMS) Building energy management systems (BEMS) Home energy management systems (HEMS) |
Hardware Software Services |
On-Premises Cloud |
Residential Energy & Power Telecom & IT Manufacturing Retail Healthcare Others |
Chapter 1. Introduction
1.1. Research Objective
1.2. Scope of the Study
1.3. Definition
Chapter 2. Research Methodology
2.1. Research Approach
2.2. Data Sources
2.3. Assumptions & Limitations
Chapter 3. Executive Summary
3.1. Market Snapshot
Chapter 4. Market Variables and Scope
4.1. Introduction
4.2. Market Classification and Scope
4.3. Industry Value Chain Analysis
4.3.1. Raw Material Procurement Analysis
4.3.2. Sales and Distribution Channel Analysis
4.3.3. Downstream Buyer Analysis
Chapter 5. COVID 19 Impact on Energy Management Systems Market
5.1. COVID-19 Landscape: Energy Management Systems Industry Impact
5.2. COVID 19 - Impact Assessment for the Industry
5.3. COVID 19 Impact: Global Major Government Policy
5.4. Market Trends and Opportunities in the COVID-19 Landscape
Chapter 6. Market Dynamics Analysis and Trends
6.1. Market Dynamics
6.1.1. Market Drivers
6.1.2. Market Restraints
6.1.3. Market Opportunities
6.2. Porter’s Five Forces Analysis
6.2.1. Bargaining power of suppliers
6.2.2. Bargaining power of buyers
6.2.3. Threat of substitute
6.2.4. Threat of new entrants
6.2.5. Degree of competition
Chapter 7. Competitive Landscape
7.1.1. Company Market Share/Positioning Analysis
7.1.2. Key Strategies Adopted by Players
7.1.3. Vendor Landscape
7.1.3.1. List of Suppliers
7.1.3.2. List of Buyers
Chapter 8. Global Energy Management Systems Market, By System Type
8.1. Energy Management Systems Market, by System Type, 2023-2032
8.1.1. Industrial energy management systems (IEMS)
8.1.1.1. Market Revenue and Forecast (2020-2032)
8.1.2. Building energy management systems (BEMS)
8.1.2.1. Market Revenue and Forecast (2020-2032)
8.1.3. Home energy management systems (HEMS)
8.1.3.1. Market Revenue and Forecast (2020-2032)
Chapter 9. Global Energy Management Systems Market, By Component
9.1. Energy Management Systems Market, by Component, 2023-2032
9.1.1. Hardware
9.1.1.1. Market Revenue and Forecast (2020-2032)
9.1.2. Software
9.1.2.1. Market Revenue and Forecast (2020-2032)
9.1.3. Services
9.1.3.1. Market Revenue and Forecast (2020-2032)
Chapter 10. Global Energy Management Systems Market, By Deployment
10.1. Energy Management Systems Market, by Deployment, 2023-2032
10.1.1. On-Premises
10.1.1.1. Market Revenue and Forecast (2020-2032)
10.1.2. Cloud
10.1.2.1. Market Revenue and Forecast (2020-2032)
Chapter 11. Global Energy Management Systems Market, By Vertical
11.1. Energy Management Systems Market, by Vertical, 2023-2032
11.1.1. Residential
11.1.1.1. Market Revenue and Forecast (2020-2032)
11.1.2. Energy & Power
11.1.2.1. Market Revenue and Forecast (2020-2032)
11.1.3. Telecom & IT
11.1.3.1. Market Revenue and Forecast (2020-2032)
11.1.4. Manufacturing
11.1.4.1. Market Revenue and Forecast (2020-2032)
11.1.5. Retail
11.1.5.1. Market Revenue and Forecast (2020-2032)
11.1.6. Healthcare
11.1.6.1. Market Revenue and Forecast (2020-2032)
11.1.7. Others
11.1.7.1. Market Revenue and Forecast (2020-2032)
Chapter 12. Global Energy Management Systems Market, Regional Estimates and Trend Forecast
12.1. North America
12.1.1. Market Revenue and Forecast, by System Type (2020-2032)
12.1.2. Market Revenue and Forecast, by Component (2020-2032)
12.1.3. Market Revenue and Forecast, by Deployment (2020-2032)
12.1.4. Market Revenue and Forecast, by Vertical (2020-2032)
12.1.5. U.S.
12.1.5.1. Market Revenue and Forecast, by System Type (2020-2032)
12.1.5.2. Market Revenue and Forecast, by Component (2020-2032)
12.1.5.3. Market Revenue and Forecast, by Deployment (2020-2032)
12.1.5.4. Market Revenue and Forecast, by Vertical (2020-2032)
12.1.6. Rest of North America
12.1.6.1. Market Revenue and Forecast, by System Type (2020-2032)
12.1.6.2. Market Revenue and Forecast, by Component (2020-2032)
12.1.6.3. Market Revenue and Forecast, by Deployment (2020-2032)
12.1.6.4. Market Revenue and Forecast, by Vertical (2020-2032)
12.2. Europe
12.2.1. Market Revenue and Forecast, by System Type (2020-2032)
12.2.2. Market Revenue and Forecast, by Component (2020-2032)
12.2.3. Market Revenue and Forecast, by Deployment (2020-2032)
12.2.4. Market Revenue and Forecast, by Vertical (2020-2032)
12.2.5. UK
12.2.5.1. Market Revenue and Forecast, by System Type (2020-2032)
12.2.5.2. Market Revenue and Forecast, by Component (2020-2032)
12.2.5.3. Market Revenue and Forecast, by Deployment (2020-2032)
12.2.5.4. Market Revenue and Forecast, by Vertical (2020-2032)
12.2.6. Germany
12.2.6.1. Market Revenue and Forecast, by System Type (2020-2032)
12.2.6.2. Market Revenue and Forecast, by Component (2020-2032)
12.2.6.3. Market Revenue and Forecast, by Deployment (2020-2032)
12.2.6.4. Market Revenue and Forecast, by Vertical (2020-2032)
12.2.7. France
12.2.7.1. Market Revenue and Forecast, by System Type (2020-2032)
12.2.7.2. Market Revenue and Forecast, by Component (2020-2032)
12.2.7.3. Market Revenue and Forecast, by Deployment (2020-2032)
12.2.7.4. Market Revenue and Forecast, by Vertical (2020-2032)
12.2.8. Rest of Europe
12.2.8.1. Market Revenue and Forecast, by System Type (2020-2032)
12.2.8.2. Market Revenue and Forecast, by Component (2020-2032)
12.2.8.3. Market Revenue and Forecast, by Deployment (2020-2032)
12.2.8.4. Market Revenue and Forecast, by Vertical (2020-2032)
12.3. APAC
12.3.1. Market Revenue and Forecast, by System Type (2020-2032)
12.3.2. Market Revenue and Forecast, by Component (2020-2032)
12.3.3. Market Revenue and Forecast, by Deployment (2020-2032)
12.3.4. Market Revenue and Forecast, by Vertical (2020-2032)
12.3.5. India
12.3.5.1. Market Revenue and Forecast, by System Type (2020-2032)
12.3.5.2. Market Revenue and Forecast, by Component (2020-2032)
12.3.5.3. Market Revenue and Forecast, by Deployment (2020-2032)
12.3.5.4. Market Revenue and Forecast, by Vertical (2020-2032)
12.3.6. China
12.3.6.1. Market Revenue and Forecast, by System Type (2020-2032)
12.3.6.2. Market Revenue and Forecast, by Component (2020-2032)
12.3.6.3. Market Revenue and Forecast, by Deployment (2020-2032)
12.3.6.4. Market Revenue and Forecast, by Vertical (2020-2032)
12.3.7. Japan
12.3.7.1. Market Revenue and Forecast, by System Type (2020-2032)
12.3.7.2. Market Revenue and Forecast, by Component (2020-2032)
12.3.7.3. Market Revenue and Forecast, by Deployment (2020-2032)
12.3.7.4. Market Revenue and Forecast, by Vertical (2020-2032)
12.3.8. Rest of APAC
12.3.8.1. Market Revenue and Forecast, by System Type (2020-2032)
12.3.8.2. Market Revenue and Forecast, by Component (2020-2032)
12.3.8.3. Market Revenue and Forecast, by Deployment (2020-2032)
12.3.8.4. Market Revenue and Forecast, by Vertical (2020-2032)
12.4. MEA
12.4.1. Market Revenue and Forecast, by System Type (2020-2032)
12.4.2. Market Revenue and Forecast, by Component (2020-2032)
12.4.3. Market Revenue and Forecast, by Deployment (2020-2032)
12.4.4. Market Revenue and Forecast, by Vertical (2020-2032)
12.4.5. GCC
12.4.5.1. Market Revenue and Forecast, by System Type (2020-2032)
12.4.5.2. Market Revenue and Forecast, by Component (2020-2032)
12.4.5.3. Market Revenue and Forecast, by Deployment (2020-2032)
12.4.5.4. Market Revenue and Forecast, by Vertical (2020-2032)
12.4.6. North Africa
12.4.6.1. Market Revenue and Forecast, by System Type (2020-2032)
12.4.6.2. Market Revenue and Forecast, by Component (2020-2032)
12.4.6.3. Market Revenue and Forecast, by Deployment (2020-2032)
12.4.6.4. Market Revenue and Forecast, by Vertical (2020-2032)
12.4.7. South Africa
12.4.7.1. Market Revenue and Forecast, by System Type (2020-2032)
12.4.7.2. Market Revenue and Forecast, by Component (2020-2032)
12.4.7.3. Market Revenue and Forecast, by Deployment (2020-2032)
12.4.7.4. Market Revenue and Forecast, by Vertical (2020-2032)
12.4.8. Rest of MEA
12.4.8.1. Market Revenue and Forecast, by System Type (2020-2032)
12.4.8.2. Market Revenue and Forecast, by Component (2020-2032)
12.4.8.3. Market Revenue and Forecast, by Deployment (2020-2032)
12.4.8.4. Market Revenue and Forecast, by Vertical (2020-2032)
12.5. Latin America
12.5.1. Market Revenue and Forecast, by System Type (2020-2032)
12.5.2. Market Revenue and Forecast, by Component (2020-2032)
12.5.3. Market Revenue and Forecast, by Deployment (2020-2032)
12.5.4. Market Revenue and Forecast, by Vertical (2020-2032)
12.5.5. Brazil
12.5.5.1. Market Revenue and Forecast, by System Type (2020-2032)
12.5.5.2. Market Revenue and Forecast, by Component (2020-2032)
12.5.5.3. Market Revenue and Forecast, by Deployment (2020-2032)
12.5.5.4. Market Revenue and Forecast, by Vertical (2020-2032)
12.5.6. Rest of LATAM
12.5.6.1. Market Revenue and Forecast, by System Type (2020-2032)
12.5.6.2. Market Revenue and Forecast, by Component (2020-2032)
12.5.6.3. Market Revenue and Forecast, by Deployment (2020-2032)
12.5.6.4. Market Revenue and Forecast, by Vertical (2020-2032)
Chapter 13. Company Profiles
13.1. Schneider Electric SE
13.1.1. Company Overview
13.1.2. Product Offerings
13.1.3. Financial Performance
13.1.4. Recent Initiatives
13.2. Honeywell International Inc.
13.2.1. Company Overview
13.2.2. Product Offerings
13.2.3. Financial Performance
13.2.4. Recent Initiatives
13.3. Siemens AG
13.3.1. Company Overview
13.3.2. Product Offerings
13.3.3. Financial Performance
13.3.4. Recent Initiatives
13.4. Johnson Controls, Inc.
13.4.1. Company Overview
13.4.2. Product Offerings
13.4.3. Financial Performance
13.4.4. Recent Initiatives
13.5. C3.ai; Inc.
13.5.1. Company Overview
13.5.2. Product Offerings
13.5.3. Financial Performance
13.5.4. Recent Initiatives
13.6. GridPoint
13.6.1. Company Overview
13.6.2. Product Offerings
13.6.3. Financial Performance
13.6.4. Recent Initiatives
13.7. General Electric
13.7.1. Company Overview
13.7.2. Product Offerings
13.7.3. Financial Performance
13.7.4. Recent Initiatives
13.8. ABB
13.8.1. Company Overview
13.8.2. Product Offerings
13.8.3. Financial Performance
13.8.4. Recent Initiatives
13.9. International Business Machines Corporation
13.9.1. Company Overview
13.9.2. Product Offerings
13.9.3. Financial Performance
13.9.4. Recent Initiatives
13.10. Cisco Systems, Inc.
13.10.1. Company Overview
13.10.2. Product Offerings
13.10.3. Financial Performance
13.10.4. Recent Initiatives
Chapter 14. Research Methodology
14.1. Primary Research
14.2. Secondary Research
14.3. Assumptions
Chapter 15. Appendix
15.1. About Us
15.2. Glossary of Terms
 Cross-segment Market Size and Analysis for
Mentioned Segments
Additional Company Profiles (Upto 5 With No Cost)
Additional Countries (Apart From Mentioned Countries)
Country/Region-specific Report
Go To Market Strategy
Region Specific Market DynamicsRegion Level Market Share Import Export AnalysisProduction AnalysisOthers
Cross-segment Market Size and Analysis for
Mentioned Segments
Additional Company Profiles (Upto 5 With No Cost)
Additional Countries (Apart From Mentioned Countries)
Country/Region-specific Report
Go To Market Strategy
Region Specific Market DynamicsRegion Level Market Share Import Export AnalysisProduction AnalysisOthers