Enterprise Data Management Market Size, Share | Report 2023-2032
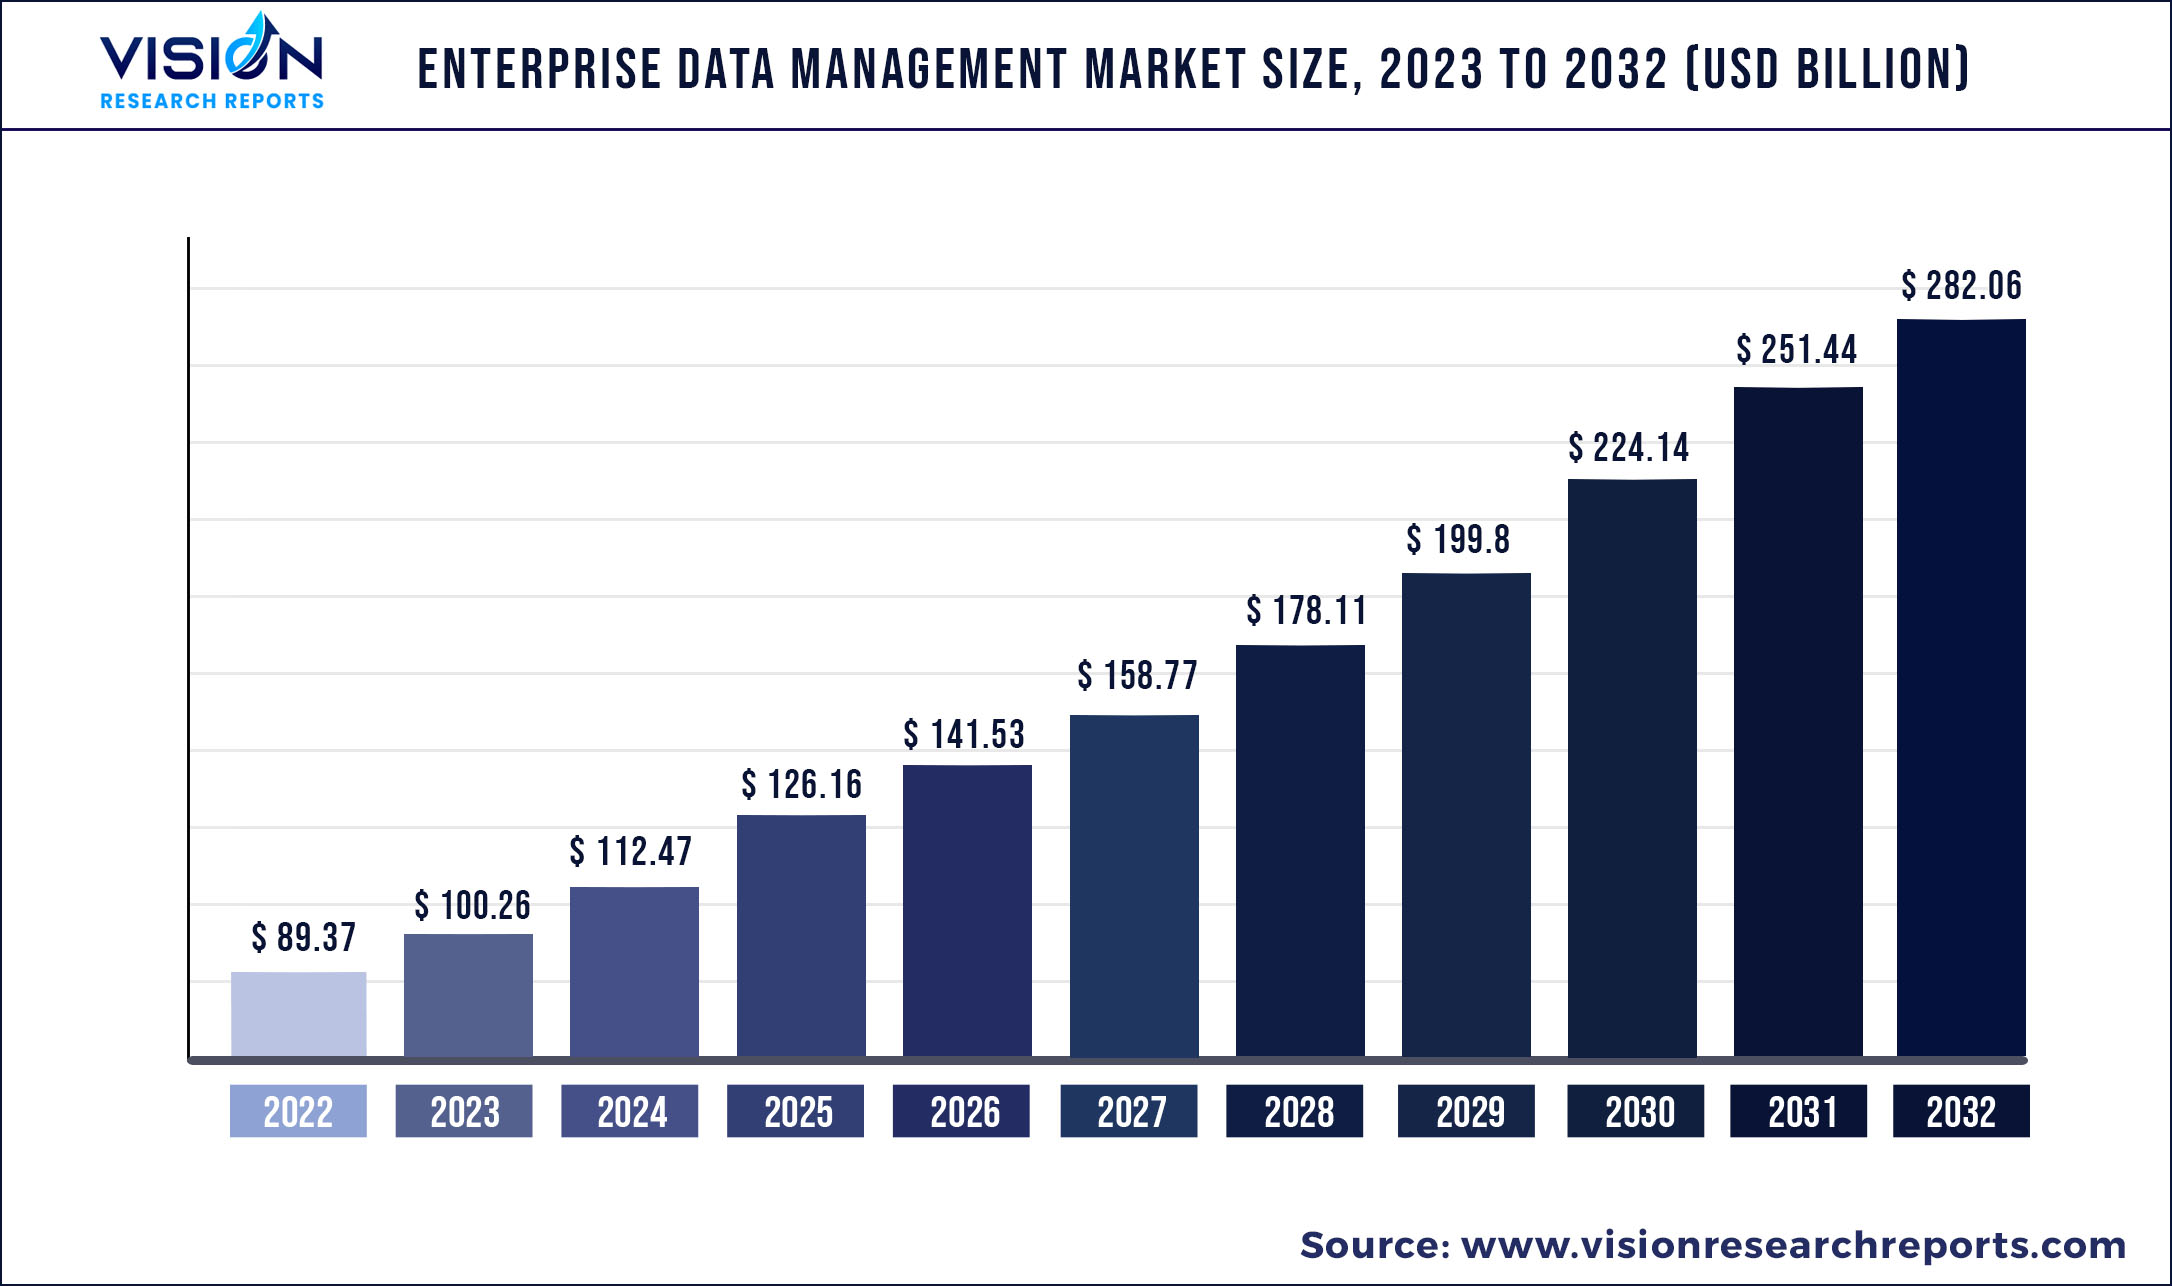
The global enterprise data management market was valued at USD 89.37 billion in 2022 and it is predicted to surpass around USD 282.06 billion by 2032 with a CAGR of 12.18% from 2023 to 2032.
Key Pointers
| Report Coverage | Details |
| Market Size in 2022 | USD 89.37 billion |
| Revenue Forecast by 2032 | USD 282.06 billion |
| Growth rate from 2023 to 2032 | CAGR of 12.18% |
| Base Year | 2022 |
| Forecast Period | 2023 to 2032 |
| Regions Covered | North America, Europe, Asia Pacific, Latin America, Middle East & Africa |
| Companies Covered | International Business Machines Corp.; Oracle Corp.; SAP SE.; Cloudera Inc.; Amazon Web Services, Inc.; Teradata; MindTree Ltd.; Broadcom (Symantec); Informatica, Inc.; Micro Focus |
The growing adoption of parallel processing architecture and the need for risk management, the increasing shift from manual to an automated system to carry out business operations, the rising volume of data, and the growing security concerns are the major factors contributing to the growth of this industry. The global industry has benefited from the COVID-19 pandemic. Organizations worldwide have turned to enterprise data management providers for a variety of services and solutions. The trend is expected to continue in the near future.
It benefits businesses and enterprises by providing unified integration with consuming applications, data control, enhanced transparency, and support for ongoing regulations and compliances. The rising demand for data integration and visual analytics has aided in the industry’s expansion. By facilitating real-time analysis, the use of Artificial Intelligence (AI) in cognitive media solutions (whiteboard videos and whiteboard animations) enables real-time data synthesizing for effective decision-making. In addition, vendors are introducing AI-powered products to enhance analytics’ AI capabilities. As a result, many businesses are integrating business analytics software into their operations for dynamic data representation.
These factors will have a positive impact on industry growth during the forecast period. Enterprise data protection and security protocols play a vital role in any modern business. Enterprise data protection refers to the protection of data shared by all the users within the organization, generally across the department or across any particular geographical region. Data can be categorized into external and internal categories according to the organizational resources. As the company grows, the data it generates and the data it has to store, managed, and protect also continue to grow. For instance, a typical business may secure highly confidential data using multi-factor authentication, encryption procedures, and limited access.
These factors are driving the adoption of EDM solutions. The growing demand for EDM is also expected to rise as this model helps in creating a process for delivering relevant insights from unstructured or duplicated data. It helps in the management of data between departments within an organization. Enterprise data management solutions are projected to grow in demand as businesses place a greater emphasis on securing timely and accurate information. Several businesses and companies benefit from it because it provides seamless integration with consuming apps, data control, increased transparency, and support for ongoing rules and compliance.
These factors have fueled industry growth during the forecast period. Organizations have to abide by certain rules and regulations depending on the region they are operating in, and the industry or industry vertical they belong to. Rules and regulations can typically change from region to region and country to country, which means ensuring regulatory compliance can be a challenging task for organizations. As such, the growing need to ensure full compliance with regulations, such as the General Data Protection Regulation (GDPR) and the Act on the Protection of Personal Information (APPI), is expected to drive the adoption of EDM solutions.
Enterprise Data Management Market Segmentations:
| By Component | By Service | By Deployment | By Enterprise Size | By End-use |
|
Software Services |
Managed Services Professional Services |
Cloud On-premise |
Small & Medium Enterprise (SME) Large Enterprise |
IT & Telecom BFSI Retail & Consumer Goods Healthcare Manufacturing Others (Government, Transportation, Education, Real Estate, and Media & Entertainment) |
Chapter 1. Introduction
1.1. Research Objective
1.2. Scope of the Study
1.3. Definition
Chapter 2. Research Methodology
2.1. Research Approach
2.2. Data Sources
2.3. Assumptions & Limitations
Chapter 3. Executive Summary
3.1. Market Snapshot
Chapter 4. Market Variables and Scope
4.1. Introduction
4.2. Market Classification and Scope
4.3. Industry Value Chain Analysis
4.3.1. Raw Material Procurement Analysis
4.3.2. Sales and Distribution Channel Analysis
4.3.3. Downstream Buyer Analysis
Chapter 5. COVID 19 Impact on Enterprise Data Management Market
5.1. COVID-19 Landscape: Enterprise Data Management Industry Impact
5.2. COVID 19 - Impact Assessment for the Industry
5.3. COVID 19 Impact: Global Major Government Policy
5.4. Market Trends and Opportunities in the COVID-19 Landscape
Chapter 6. Market Dynamics Analysis and Trends
6.1. Market Dynamics
6.1.1. Market Drivers
6.1.2. Market Restraints
6.1.3. Market Opportunities
6.2. Porter’s Five Forces Analysis
6.2.1. Bargaining power of suppliers
6.2.2. Bargaining power of buyers
6.2.3. Threat of substitute
6.2.4. Threat of new entrants
6.2.5. Degree of competition
Chapter 7. Competitive Landscape
7.1.1. Company Market Share/Positioning Analysis
7.1.2. Key Strategies Adopted by Players
7.1.3. Vendor Landscape
7.1.3.1. List of Suppliers
7.1.3.2. List of Buyers
Chapter 8. Global Enterprise Data Management Market, By Component
8.1. Enterprise Data Management Market, by Component, 2023-2032
8.1.1. Software
8.1.1.1. Market Revenue and Forecast (2020-2032)
8.1.2. Services
8.1.2.1. Market Revenue and Forecast (2020-2032)
Chapter 9. Global Enterprise Data Management Market, By Service
9.1. Enterprise Data Management Market, by Service, 2023-2032
9.1.1. Managed Services
9.1.1.1. Market Revenue and Forecast (2020-2032)
9.1.2. Professional Services
9.1.2.1. Market Revenue and Forecast (2020-2032)
Chapter 10. Global Enterprise Data Management Market, By Deployment
10.1. Enterprise Data Management Market, by Deployment, 2023-2032
10.1.1. Cloud
10.1.1.1. Market Revenue and Forecast (2020-2032)
10.1.2. On-premise
10.1.2.1. Market Revenue and Forecast (2020-2032)
Chapter 11. Global Enterprise Data Management Market, By Enterprise Size
11.1. Enterprise Data Management Market, by Enterprise Size, 2023-2032
11.1.1. Small & Medium Enterprise (SME)
11.1.1.1. Market Revenue and Forecast (2020-2032)
11.1.2. Large Enterprise
11.1.2.1. Market Revenue and Forecast (2020-2032)
Chapter 12. Global Enterprise Data Management Market, By End-use
12.1. Enterprise Data Management Market, by End-use, 2023-2032
12.1.1. IT & Telecom
12.1.1.1. Market Revenue and Forecast (2020-2032)
12.1.2. BFSI
12.1.2.1. Market Revenue and Forecast (2020-2032)
12.1.3. Retail & Consumer Goods
12.1.3.1. Market Revenue and Forecast (2020-2032)
12.1.4. Healthcare
12.1.4.1. Market Revenue and Forecast (2020-2032)
12.1.5. Manufacturing
12.1.5.1. Market Revenue and Forecast (2020-2032)
12.1.6. Others (Government, Transportation, Education, Real Estate, and Media & Entertainment)
12.1.6.1. Market Revenue and Forecast (2020-2032)
Chapter 13. Global Enterprise Data Management Market, Regional Estimates and Trend Forecast
13.1. North America
13.1.1. Market Revenue and Forecast, by Component (2020-2032)
13.1.2. Market Revenue and Forecast, by Service (2020-2032)
13.1.3. Market Revenue and Forecast, by Deployment (2020-2032)
13.1.4. Market Revenue and Forecast, by Enterprise Size (2020-2032)
13.1.5. Market Revenue and Forecast, by End-use (2020-2032)
13.1.6. U.S.
13.1.6.1. Market Revenue and Forecast, by Component (2020-2032)
13.1.6.2. Market Revenue and Forecast, by Service (2020-2032)
13.1.6.3. Market Revenue and Forecast, by Deployment (2020-2032)
13.1.6.4. Market Revenue and Forecast, by Enterprise Size (2020-2032)
13.1.7. Market Revenue and Forecast, by End-use (2020-2032)
13.1.8. Rest of North America
13.1.8.1. Market Revenue and Forecast, by Component (2020-2032)
13.1.8.2. Market Revenue and Forecast, by Service (2020-2032)
13.1.8.3. Market Revenue and Forecast, by Deployment (2020-2032)
13.1.8.4. Market Revenue and Forecast, by Enterprise Size (2020-2032)
13.1.8.5. Market Revenue and Forecast, by End-use (2020-2032)
13.2. Europe
13.2.1. Market Revenue and Forecast, by Component (2020-2032)
13.2.2. Market Revenue and Forecast, by Service (2020-2032)
13.2.3. Market Revenue and Forecast, by Deployment (2020-2032)
13.2.4. Market Revenue and Forecast, by Enterprise Size (2020-2032)
13.2.5. Market Revenue and Forecast, by End-use (2020-2032)
13.2.6. UK
13.2.6.1. Market Revenue and Forecast, by Component (2020-2032)
13.2.6.2. Market Revenue and Forecast, by Service (2020-2032)
13.2.6.3. Market Revenue and Forecast, by Deployment (2020-2032)
13.2.7. Market Revenue and Forecast, by Enterprise Size (2020-2032)
13.2.8. Market Revenue and Forecast, by End-use (2020-2032)
13.2.9. Germany
13.2.9.1. Market Revenue and Forecast, by Component (2020-2032)
13.2.9.2. Market Revenue and Forecast, by Service (2020-2032)
13.2.9.3. Market Revenue and Forecast, by Deployment (2020-2032)
13.2.10. Market Revenue and Forecast, by Enterprise Size (2020-2032)
13.2.11. Market Revenue and Forecast, by End-use (2020-2032)
13.2.12. France
13.2.12.1. Market Revenue and Forecast, by Component (2020-2032)
13.2.12.2. Market Revenue and Forecast, by Service (2020-2032)
13.2.12.3. Market Revenue and Forecast, by Deployment (2020-2032)
13.2.12.4. Market Revenue and Forecast, by Enterprise Size (2020-2032)
13.2.13. Market Revenue and Forecast, by End-use (2020-2032)
13.2.14. Rest of Europe
13.2.14.1. Market Revenue and Forecast, by Component (2020-2032)
13.2.14.2. Market Revenue and Forecast, by Service (2020-2032)
13.2.14.3. Market Revenue and Forecast, by Deployment (2020-2032)
13.2.14.4. Market Revenue and Forecast, by Enterprise Size (2020-2032)
13.2.15. Market Revenue and Forecast, by End-use (2020-2032)
13.3. APAC
13.3.1. Market Revenue and Forecast, by Component (2020-2032)
13.3.2. Market Revenue and Forecast, by Service (2020-2032)
13.3.3. Market Revenue and Forecast, by Deployment (2020-2032)
13.3.4. Market Revenue and Forecast, by Enterprise Size (2020-2032)
13.3.5. Market Revenue and Forecast, by End-use (2020-2032)
13.3.6. India
13.3.6.1. Market Revenue and Forecast, by Component (2020-2032)
13.3.6.2. Market Revenue and Forecast, by Service (2020-2032)
13.3.6.3. Market Revenue and Forecast, by Deployment (2020-2032)
13.3.6.4. Market Revenue and Forecast, by Enterprise Size (2020-2032)
13.3.7. Market Revenue and Forecast, by End-use (2020-2032)
13.3.8. China
13.3.8.1. Market Revenue and Forecast, by Component (2020-2032)
13.3.8.2. Market Revenue and Forecast, by Service (2020-2032)
13.3.8.3. Market Revenue and Forecast, by Deployment (2020-2032)
13.3.8.4. Market Revenue and Forecast, by Enterprise Size (2020-2032)
13.3.9. Market Revenue and Forecast, by End-use (2020-2032)
13.3.10. Japan
13.3.10.1. Market Revenue and Forecast, by Component (2020-2032)
13.3.10.2. Market Revenue and Forecast, by Service (2020-2032)
13.3.10.3. Market Revenue and Forecast, by Deployment (2020-2032)
13.3.10.4. Market Revenue and Forecast, by Enterprise Size (2020-2032)
13.3.10.5. Market Revenue and Forecast, by End-use (2020-2032)
13.3.11. Rest of APAC
13.3.11.1. Market Revenue and Forecast, by Component (2020-2032)
13.3.11.2. Market Revenue and Forecast, by Service (2020-2032)
13.3.11.3. Market Revenue and Forecast, by Deployment (2020-2032)
13.3.11.4. Market Revenue and Forecast, by Enterprise Size (2020-2032)
13.3.11.5. Market Revenue and Forecast, by End-use (2020-2032)
13.4. MEA
13.4.1. Market Revenue and Forecast, by Component (2020-2032)
13.4.2. Market Revenue and Forecast, by Service (2020-2032)
13.4.3. Market Revenue and Forecast, by Deployment (2020-2032)
13.4.4. Market Revenue and Forecast, by Enterprise Size (2020-2032)
13.4.5. Market Revenue and Forecast, by End-use (2020-2032)
13.4.6. GCC
13.4.6.1. Market Revenue and Forecast, by Component (2020-2032)
13.4.6.2. Market Revenue and Forecast, by Service (2020-2032)
13.4.6.3. Market Revenue and Forecast, by Deployment (2020-2032)
13.4.6.4. Market Revenue and Forecast, by Enterprise Size (2020-2032)
13.4.7. Market Revenue and Forecast, by End-use (2020-2032)
13.4.8. North Africa
13.4.8.1. Market Revenue and Forecast, by Component (2020-2032)
13.4.8.2. Market Revenue and Forecast, by Service (2020-2032)
13.4.8.3. Market Revenue and Forecast, by Deployment (2020-2032)
13.4.8.4. Market Revenue and Forecast, by Enterprise Size (2020-2032)
13.4.9. Market Revenue and Forecast, by End-use (2020-2032)
13.4.10. South Africa
13.4.10.1. Market Revenue and Forecast, by Component (2020-2032)
13.4.10.2. Market Revenue and Forecast, by Service (2020-2032)
13.4.10.3. Market Revenue and Forecast, by Deployment (2020-2032)
13.4.10.4. Market Revenue and Forecast, by Enterprise Size (2020-2032)
13.4.10.5. Market Revenue and Forecast, by End-use (2020-2032)
13.4.11. Rest of MEA
13.4.11.1. Market Revenue and Forecast, by Component (2020-2032)
13.4.11.2. Market Revenue and Forecast, by Service (2020-2032)
13.4.11.3. Market Revenue and Forecast, by Deployment (2020-2032)
13.4.11.4. Market Revenue and Forecast, by Enterprise Size (2020-2032)
13.4.11.5. Market Revenue and Forecast, by End-use (2020-2032)
13.5. Latin America
13.5.1. Market Revenue and Forecast, by Component (2020-2032)
13.5.2. Market Revenue and Forecast, by Service (2020-2032)
13.5.3. Market Revenue and Forecast, by Deployment (2020-2032)
13.5.4. Market Revenue and Forecast, by Enterprise Size (2020-2032)
13.5.5. Market Revenue and Forecast, by End-use (2020-2032)
13.5.6. Brazil
13.5.6.1. Market Revenue and Forecast, by Component (2020-2032)
13.5.6.2. Market Revenue and Forecast, by Service (2020-2032)
13.5.6.3. Market Revenue and Forecast, by Deployment (2020-2032)
13.5.6.4. Market Revenue and Forecast, by Enterprise Size (2020-2032)
13.5.7. Market Revenue and Forecast, by End-use (2020-2032)
13.5.8. Rest of LATAM
13.5.8.1. Market Revenue and Forecast, by Component (2020-2032)
13.5.8.2. Market Revenue and Forecast, by Service (2020-2032)
13.5.8.3. Market Revenue and Forecast, by Deployment (2020-2032)
13.5.8.4. Market Revenue and Forecast, by Enterprise Size (2020-2032)
13.5.8.5. Market Revenue and Forecast, by End-use (2020-2032)
Chapter 14. Company Profiles
14.1. International Business Machines Corp.
14.1.1. Company Overview
14.1.2. Product Offerings
14.1.3. Financial Performance
14.1.4. Recent Initiatives
14.2. Oracle Corp.
14.2.1. Company Overview
14.2.2. Product Offerings
14.2.3. Financial Performance
14.2.4. Recent Initiatives
14.3. SAP SE.
14.3.1. Company Overview
14.3.2. Product Offerings
14.3.3. Financial Performance
14.3.4. Recent Initiatives
14.4. Cloudera Inc.
14.4.1. Company Overview
14.4.2. Product Offerings
14.4.3. Financial Performance
14.4.4. Recent Initiatives
14.5. Amazon Web Services, Inc.
14.5.1. Company Overview
14.5.2. Product Offerings
14.5.3. Financial Performance
14.5.4. Recent Initiatives
14.6. Teradata
14.6.1. Company Overview
14.6.2. Product Offerings
14.6.3. Financial Performance
14.6.4. Recent Initiatives
14.7. MindTree Ltd.
14.7.1. Company Overview
14.7.2. Product Offerings
14.7.3. Financial Performance
14.7.4. Recent Initiatives
14.8. Broadcom (Symantec)
14.8.1. Company Overview
14.8.2. Product Offerings
14.8.3. Financial Performance
14.8.4. Recent Initiatives
14.9. Informatica, Inc.
14.9.1. Company Overview
14.9.2. Product Offerings
14.9.3. Financial Performance
14.9.4. Recent Initiatives
14.10. Micro Focus
14.10.1. Company Overview
14.10.2. Product Offerings
14.10.3. Financial Performance
14.10.4. Recent Initiatives
Chapter 15. Research Methodology
15.1. Primary Research
15.2. Secondary Research
15.3. Assumptions
Chapter 16. Appendix
16.1. About Us
16.2. Glossary of Terms
 Cross-segment Market Size and Analysis for
Mentioned Segments
Additional Company Profiles (Upto 5 With No Cost)
Additional Countries (Apart From Mentioned Countries)
Country/Region-specific Report
Go To Market Strategy
Region Specific Market DynamicsRegion Level Market Share Import Export AnalysisProduction AnalysisOthers
Cross-segment Market Size and Analysis for
Mentioned Segments
Additional Company Profiles (Upto 5 With No Cost)
Additional Countries (Apart From Mentioned Countries)
Country/Region-specific Report
Go To Market Strategy
Region Specific Market DynamicsRegion Level Market Share Import Export AnalysisProduction AnalysisOthers