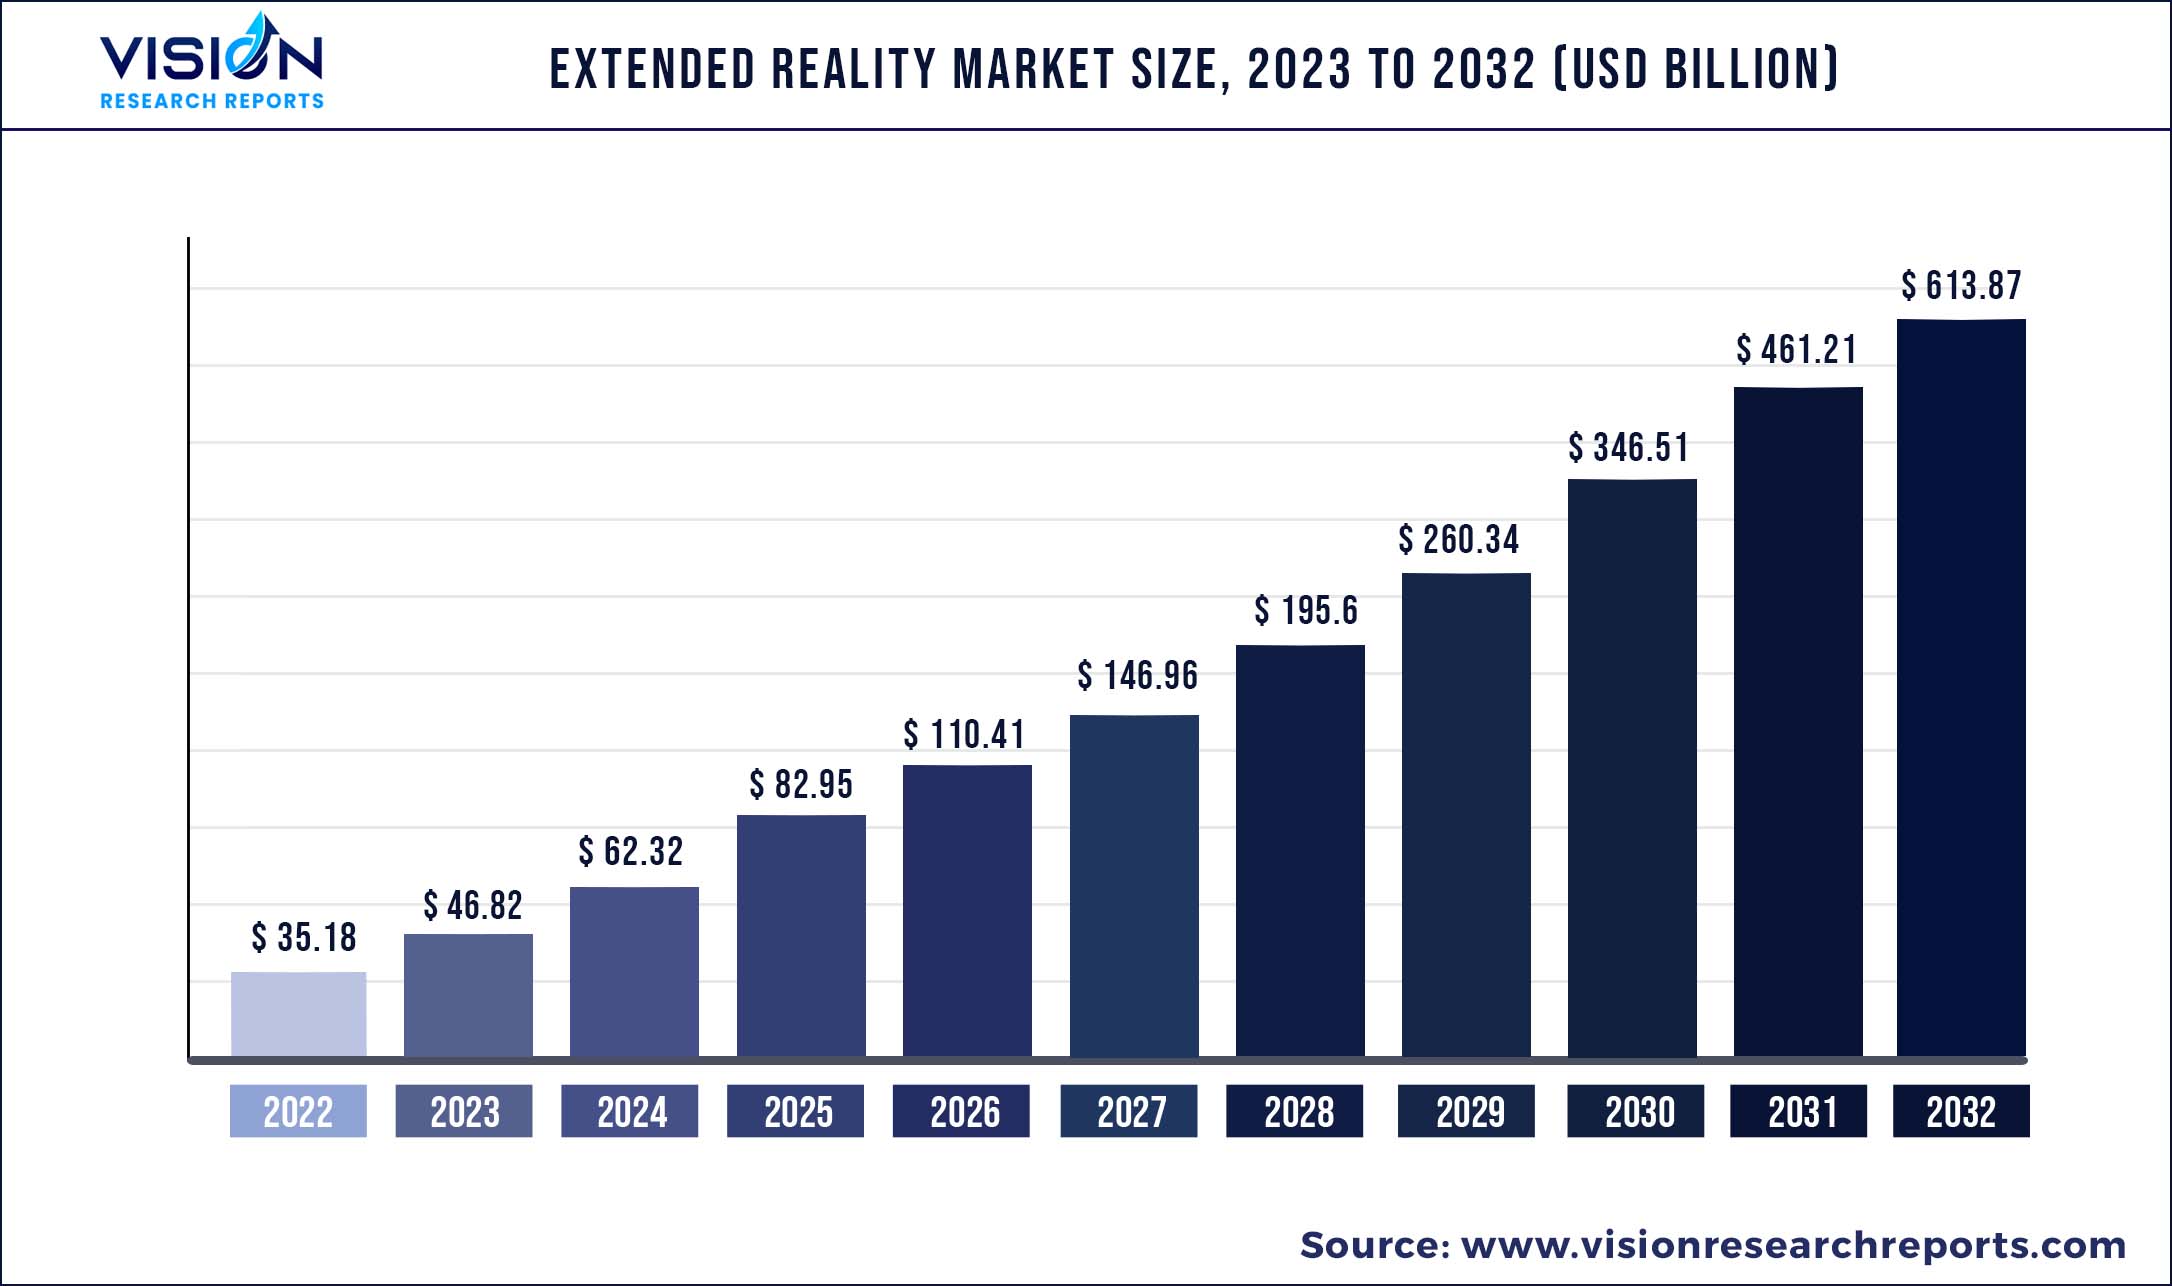
The global extended reality market was surpassed at USD 35.18 billion in 2022 and is expected to hit around USD 613.87 billion by 2032, growing at a CAGR of 33.1% from 2023 to 2032.
Key Pointers
Report Scope of the Extended Reality Market
| Report Coverage | Details |
| Market Size in 2022 | USD 35.18 billion |
| Revenue Forecast by 2032 | USD 613.87 billion |
| Growth rate from 2023 to 2032 | CAGR of 33.1% |
| Base Year | 2022 |
| Forecast Period | 2023 to 2032 |
| Regions Covered | North America, Europe, Asia Pacific, Latin America, Middle East & Africa |
| Companies Covered | Accenture plc, Qualcomm Incorporated, Unity Technologies, Adobe Inc., Alphabet Inc., SoftServe Inc., Northern Digital Inc., Sony Corporation, Facebook Inc., Microsoft Corporation, Tata Elxsi, Semcon, HTC Corporation |
Extended Reality (XR) is a collective term for various immersive technologies such as augmented reality (AR), virtual reality (VR), and mixed reality (MR). All these technologies offer an experience by either combining virtual and physical worlds or by creating a fully immersive experience. In augmented reality, virtual information and objects are overlaid in the real world. This experience enhances the real world with digital additions such as images, text, and various animations.
A user can experience the augmented reality experience through AR glasses or via screens, tablets, and smartphones. Mixed reality (MR) combines both real and virtual elements to create a new world where the user can interact with the new elements thus created. MR inculcates the best use of both AR and VR technologies.
There has been an increase in the adoption of various smart devices which have the feature to provide an Extended Reality experience to the user. As a result, the rise in the usage of smart devices is one of the driving factors of this market. Media entertainment enterprises and retailers are beginning to realize the benefits of AR and VR in motion pictures and promotional campaigns. This rising awareness is expected to boost the market demand for the Extended Reality Market during the forecasted period. Users can also try out various outfits and accessories with the help of AR which is anticipated to fuel the demand for the Extended Reality Market.
Expansion of the gaming industry is one of the major driving forces of this market as VR headsets are gaining popularity day by day which promises to improve the market demand for the overall Extended Reality Market during the forecasted period. AR and VR technologies can also be used for collaborative seminars, client meetings, public lectures, military training, and various other applications. However, the slow growth rate in underdeveloped economies and the absence of effective user base design hinder the market growth of the Extended Reality Market.
COVID-19 Impact
Because of the COVID-19 pandemic, the major players of manufacturing units are facing serious obstacles due to the worldwide lockdown and the limited availability of labor and raw materials. So much specific industry work is done by XR technology.
Pandemic has given rise to tools such as AR, VR, and MR to shop virtually and support remote work. AR technology had the highest market share in 2020 during COVID-19. It gives people to talk, shop, and socialize using these immersive platforms.
From enabling online learning to initiating access to cultural events and experiences, AR and VR applications can help end-users break the isolation of COVID-19 lockdown.
Extended Reality Market Segmentations:
| By Type | By Components | By End-Use |
|
Virtual Reality (VR) Augmented Reality (AR) Mixed Reality (MR) |
Hardware Software Services |
Education Automotive Retail Manufacturing Aerospace Healthcare Media and Entertainment |
Chapter 1. Introduction
1.1. Research Objective
1.2. Scope of the Study
1.3. Definition
Chapter 2. Research Methodology
2.1. Research Approach
2.2. Data Sources
2.3. Assumptions & Limitations
Chapter 3. Executive Summary
3.1. Market Snapshot
Chapter 4. Market Variables and Scope
4.1. Introduction
4.2. Market Classification and Scope
4.3. Industry Value Chain Analysis
4.3.1. Raw Material Procurement Analysis
4.3.2. Sales and Distribution Type Analysis
4.3.3. Downstream Buyer Analysis
Chapter 5. COVID 19 Impact on Extended Reality Market
5.1. COVID-19 Landscape: Extended Reality Industry Impact
5.2. COVID 19 - Impact Assessment for the Industry
5.3. COVID 19 Impact: Global Major Government Policy
5.4. Market Trends and Opportunities in the COVID-19 Landscape
Chapter 6. Market Dynamics Analysis and Trends
6.1. Market Dynamics
6.1.1. Market Drivers
6.1.2. Market Restraints
6.1.3. Market Opportunities
6.2. Porter’s Five Forces Analysis
6.2.1. Bargaining power of suppliers
6.2.2. Bargaining power of buyers
6.2.3. Threat of substitute
6.2.4. Threat of new entrants
6.2.5. Degree of competition
Chapter 7. Competitive Landscape
7.1.1. Company Market Share/Positioning Analysis
7.1.2. Key Strategies Adopted by Players
7.1.3. Vendor Landscape
7.1.3.1. List of Suppliers
7.1.3.2. List of Buyers
Chapter 8. Global Extended Reality Market, By Type
8.1. Extended Reality Market, by Type, 2023-2032
8.1.1 Virtual Reality (VR)
8.1.1.1. Market Revenue and Forecast (2020-2032)
8.1.2. Augmented Reality (AR)
8.1.2.1. Market Revenue and Forecast (2020-2032)
8.1.3. Mixed Reality (MR)
8.1.3.1. Market Revenue and Forecast (2020-2032)
Chapter 9. Global Extended Reality Market, By Components
9.1. Extended Reality Market, by Components, 2023-2032
9.1.1. Hardware
9.1.1.1. Market Revenue and Forecast (2020-2032)
9.1.2. Software
9.1.2.1. Market Revenue and Forecast (2020-2032)
9.1.3. Services
9.1.3.1. Market Revenue and Forecast (2020-2032)
Chapter 10. Global Extended Reality Market, By End-Use
10.1. Extended Reality Market, by End-Use, 2023-2032
10.1.1. Education
10.1.1.1. Market Revenue and Forecast (2020-2032)
10.1.2. Automotive
10.1.2.1. Market Revenue and Forecast (2020-2032)
10.1.3. Retail
10.1.3.1. Market Revenue and Forecast (2020-2032)
10.1.4. Manufacturing
10.1.4.1. Market Revenue and Forecast (2020-2032)
10.1.5. Aerospace
10.1.5.1. Market Revenue and Forecast (2020-2032)
10.1.6. Healthcare
10.1.6.1. Market Revenue and Forecast (2020-2032)
10.1.7. Media and Entertainment
10.1.7.1. Market Revenue and Forecast (2020-2032)
Chapter 11. Global Extended Reality Market, Regional Estimates and Trend Forecast
11.1. North America
11.1.1. Market Revenue and Forecast, by Type (2020-2032)
11.1.2. Market Revenue and Forecast, by Components (2020-2032)
11.1.3. Market Revenue and Forecast, by End-Use (2020-2032)
11.1.4. U.S.
11.1.4.1. Market Revenue and Forecast, by Type (2020-2032)
11.1.4.2. Market Revenue and Forecast, by Components (2020-2032)
11.1.4.3. Market Revenue and Forecast, by End-Use (2020-2032)
11.1.5. Rest of North America
11.1.5.1. Market Revenue and Forecast, by Type (2020-2032)
11.1.5.2. Market Revenue and Forecast, by Components (2020-2032)
11.1.5.3. Market Revenue and Forecast, by End-Use (2020-2032)
11.2. Europe
11.2.1. Market Revenue and Forecast, by Type (2020-2032)
11.2.2. Market Revenue and Forecast, by Components (2020-2032)
11.2.3. Market Revenue and Forecast, by End-Use (2020-2032)
11.2.4. UK
11.2.4.1. Market Revenue and Forecast, by Type (2020-2032)
11.2.4.2. Market Revenue and Forecast, by Components (2020-2032)
11.2.4.3. Market Revenue and Forecast, by End-Use (2020-2032)
11.2.5. Germany
11.2.5.1. Market Revenue and Forecast, by Type (2020-2032)
11.2.5.2. Market Revenue and Forecast, by Components (2020-2032)
11.2.5.3. Market Revenue and Forecast, by End-Use (2020-2032)
11.2.6. France
11.2.6.1. Market Revenue and Forecast, by Type (2020-2032)
11.2.6.2. Market Revenue and Forecast, by Components (2020-2032)
11.2.6.3. Market Revenue and Forecast, by End-Use (2020-2032)
11.2.7. Rest of Europe
11.2.7.1. Market Revenue and Forecast, by Type (2020-2032)
11.2.7.2. Market Revenue and Forecast, by Components (2020-2032)
11.2.7.3. Market Revenue and Forecast, by End-Use (2020-2032)
11.3. APAC
11.3.1. Market Revenue and Forecast, by Type (2020-2032)
11.3.2. Market Revenue and Forecast, by Components (2020-2032)
11.3.3. Market Revenue and Forecast, by End-Use (2020-2032)
11.3.4. India
11.3.4.1. Market Revenue and Forecast, by Type (2020-2032)
11.3.4.2. Market Revenue and Forecast, by Components (2020-2032)
11.3.4.3. Market Revenue and Forecast, by End-Use (2020-2032)
11.3.5. China
11.3.5.1. Market Revenue and Forecast, by Type (2020-2032)
11.3.5.2. Market Revenue and Forecast, by Components (2020-2032)
11.3.5.3. Market Revenue and Forecast, by End-Use (2020-2032)
11.3.6. Japan
11.3.6.1. Market Revenue and Forecast, by Type (2020-2032)
11.3.6.2. Market Revenue and Forecast, by Components (2020-2032)
11.3.6.3. Market Revenue and Forecast, by End-Use (2020-2032)
11.3.7. Rest of APAC
11.3.7.1. Market Revenue and Forecast, by Type (2020-2032)
11.3.7.2. Market Revenue and Forecast, by Components (2020-2032)
11.3.7.3. Market Revenue and Forecast, by End-Use (2020-2032)
11.4. MEA
11.4.1. Market Revenue and Forecast, by Type (2020-2032)
11.4.2. Market Revenue and Forecast, by Components (2020-2032)
11.4.3. Market Revenue and Forecast, by End-Use (2020-2032)
11.4.4. GCC
11.4.4.1. Market Revenue and Forecast, by Type (2020-2032)
11.4.4.2. Market Revenue and Forecast, by Components (2020-2032)
11.4.4.3. Market Revenue and Forecast, by End-Use (2020-2032)
11.4.5. North Africa
11.4.5.1. Market Revenue and Forecast, by Type (2020-2032)
11.4.5.2. Market Revenue and Forecast, by Components (2020-2032)
11.4.5.3. Market Revenue and Forecast, by End-Use (2020-2032)
11.4.6. South Africa
11.4.6.1. Market Revenue and Forecast, by Type (2020-2032)
11.4.6.2. Market Revenue and Forecast, by Components (2020-2032)
11.4.6.3. Market Revenue and Forecast, by End-Use (2020-2032)
11.4.7. Rest of MEA
11.4.7.1. Market Revenue and Forecast, by Type (2020-2032)
11.4.7.2. Market Revenue and Forecast, by Components (2020-2032)
11.4.7.3. Market Revenue and Forecast, by End-Use (2020-2032)
11.5. Latin America
11.5.1. Market Revenue and Forecast, by Type (2020-2032)
11.5.2. Market Revenue and Forecast, by Components (2020-2032)
11.5.3. Market Revenue and Forecast, by End-Use (2020-2032)
11.5.4. Brazil
11.5.4.1. Market Revenue and Forecast, by Type (2020-2032)
11.5.4.2. Market Revenue and Forecast, by Components (2020-2032)
11.5.4.3. Market Revenue and Forecast, by End-Use (2020-2032)
11.5.5. Rest of LATAM
11.5.5.1. Market Revenue and Forecast, by Type (2020-2032)
11.5.5.2. Market Revenue and Forecast, by Components (2020-2032)
11.5.5.3. Market Revenue and Forecast, by End-Use (2020-2032)
Chapter 12. Company Profiles
12.1. Accenture plc
12.1.1. Company Overview
12.1.2. Product Offerings
12.1.3. Financial Performance
12.1.4. Recent Initiatives
12.2. Qualcomm Incorporated
12.2.1. Company Overview
12.2.2. Product Offerings
12.2.3. Financial Performance
12.2.4. Recent Initiatives
12.3. Unity Technologies
12.3.1. Company Overview
12.3.2. Product Offerings
12.3.3. Financial Performance
12.3.4. Recent Initiatives
12.4. Adobe Inc.
12.4.1. Company Overview
12.4.2. Product Offerings
12.4.3. Financial Performance
12.4.4. Recent Initiatives
12.5. Alphabet Inc.
12.5.1. Company Overview
12.5.2. Product Offerings
12.5.3. Financial Performance
12.5.4. Recent Initiatives
12.6. SoftServe Inc.
12.6.1. Company Overview
12.6.2. Product Offerings
12.6.3. Financial Performance
12.6.4. Recent Initiatives
12.7. Northern Digital Inc.
12.7.1. Company Overview
12.7.2. Product Offerings
12.7.3. Financial Performance
12.7.4. Recent Initiatives
12.8. Sony Corporation
12.8.1. Company Overview
12.8.2. Product Offerings
12.8.3. Financial Performance
12.8.4. Recent Initiatives
12.9. Facebook Inc.
12.9.1. Company Overview
12.9.2. Product Offerings
12.9.3. Financial Performance
12.9.4. Recent Initiatives
12.10. Microsoft Corporation
12.10.1. Company Overview
12.10.2. Product Offerings
12.10.3. Financial Performance
12.10.4. Recent Initiatives
Chapter 13. Research Methodology
13.1. Primary Research
13.2. Secondary Research
13.3. Assumptions
Chapter 14. Appendix
14.1. About Us
14.2. Glossary of Terms
 Cross-segment Market Size and Analysis for
Mentioned Segments
Additional Company Profiles (Upto 5 With No Cost)
Additional Countries (Apart From Mentioned Countries)
Country/Region-specific Report
Go To Market Strategy
Region Specific Market DynamicsRegion Level Market Share Import Export AnalysisProduction AnalysisOthers
Cross-segment Market Size and Analysis for
Mentioned Segments
Additional Company Profiles (Upto 5 With No Cost)
Additional Countries (Apart From Mentioned Countries)
Country/Region-specific Report
Go To Market Strategy
Region Specific Market DynamicsRegion Level Market Share Import Export AnalysisProduction AnalysisOthers