Farming As A Service Market Size, Share | Report 2023-2032
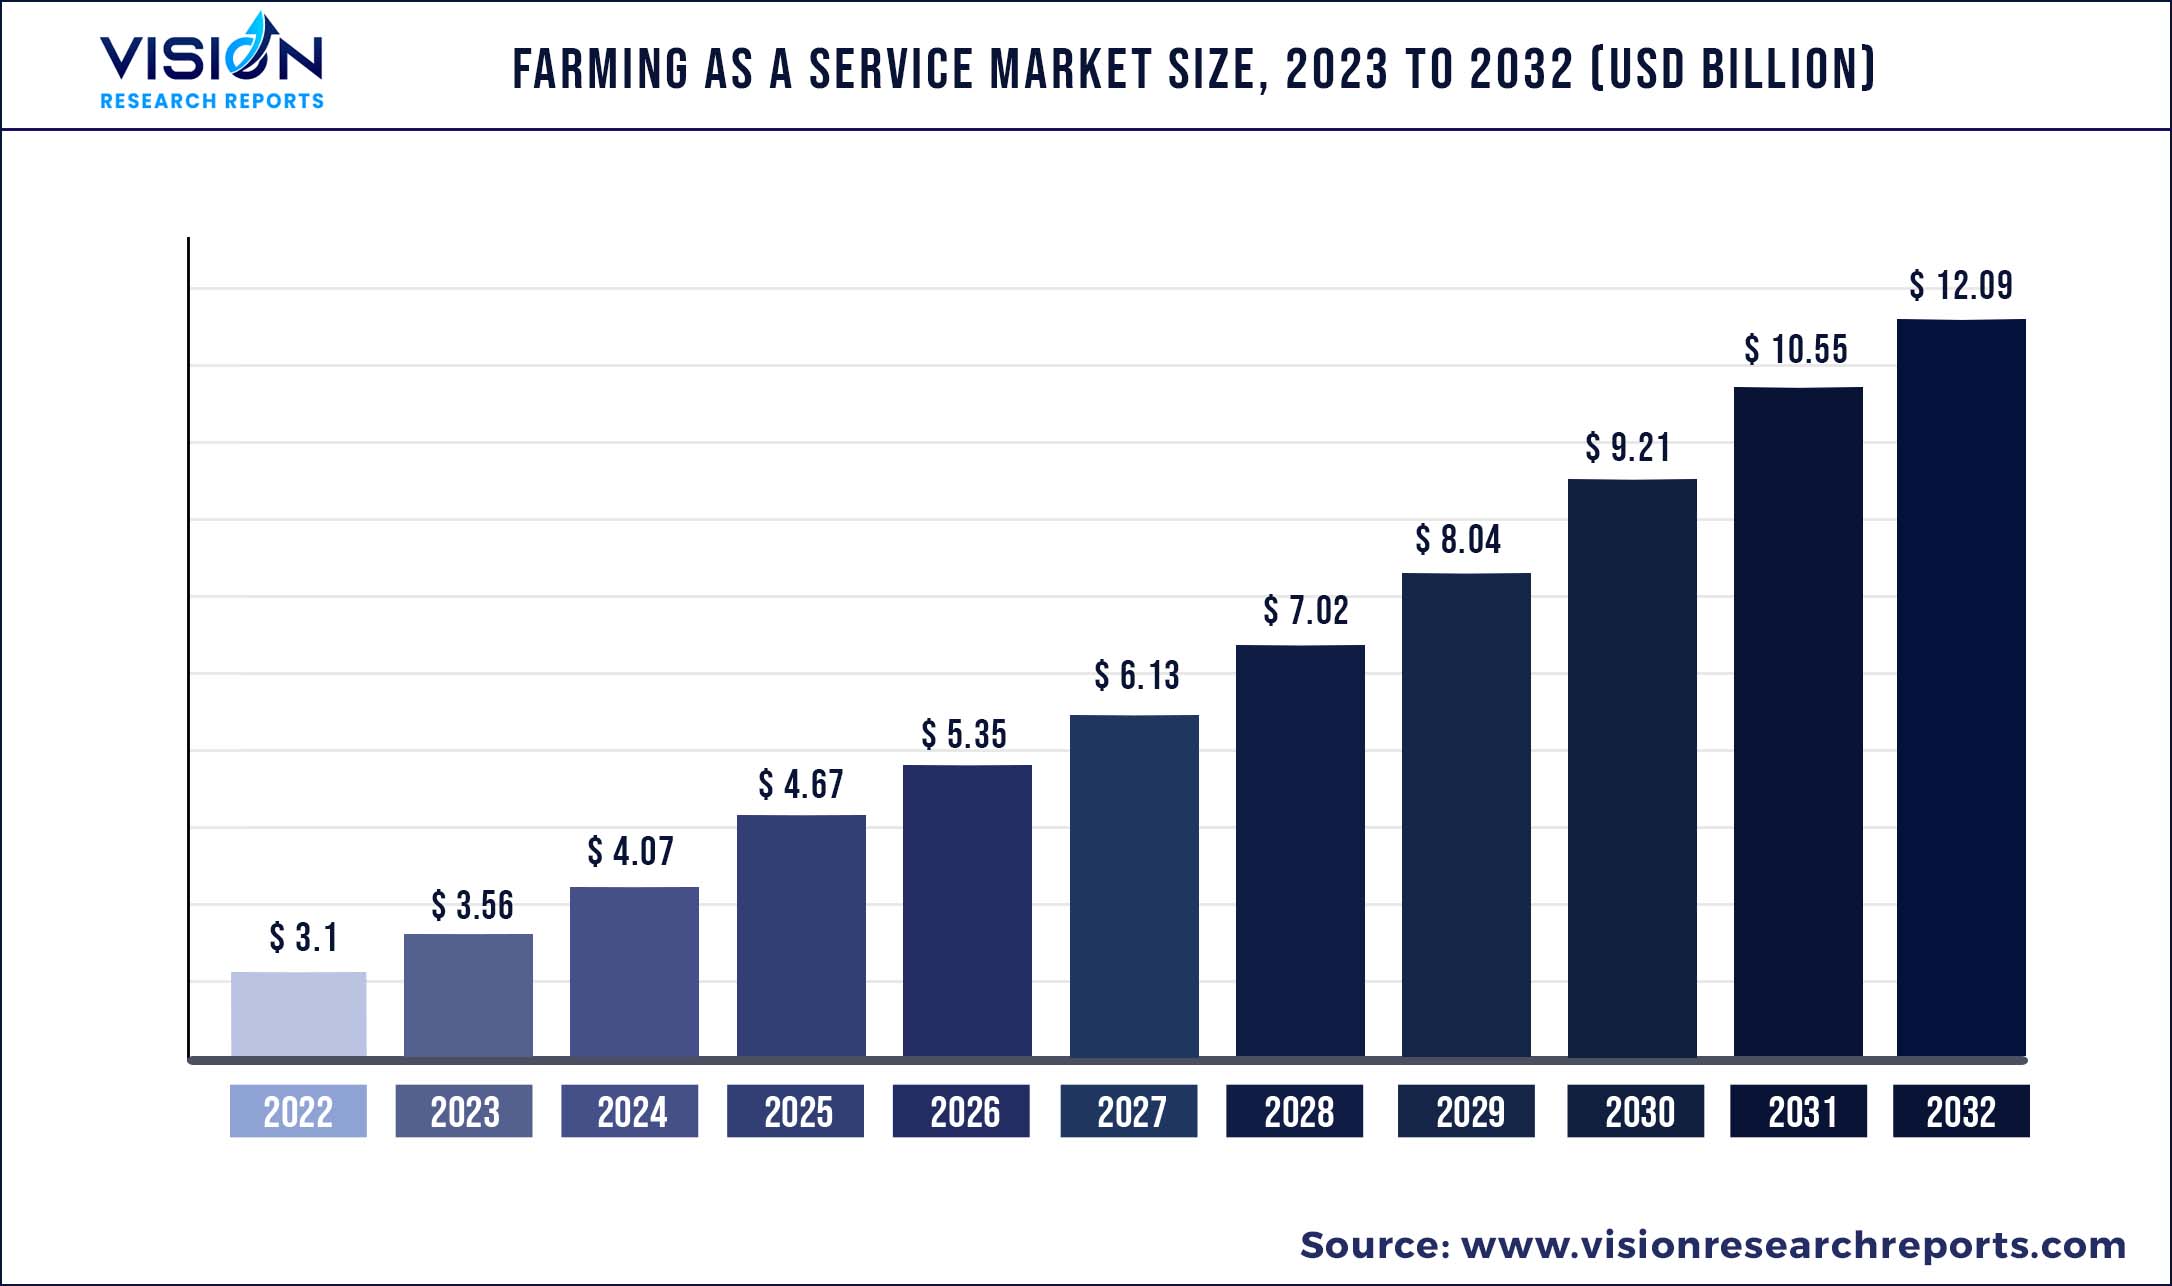
The global farming as a service market was valued at USD 3.1 billion in 2022 and it is predicted to surpass around USD 12.09 billion by 2032 with a CAGR of 14.56% from 2023 to 2032.
Key Pointers
Report Scope of the Farming As A Service Market
| Report Coverage | Details |
| Market Size in 2022 | USD 3.1 billion |
| Revenue Forecast by 2032 | USD 12.09 billion |
| Growth rate from 2023 to 2032 | CAGR of 14.56% |
| Base Year | 2022 |
| Forecast Period | 2023 to 2032 |
| Regions Covered | North America, Europe, Asia Pacific, Latin America, Middle East & Africa |
| Companies Covered | Mahindra & Mahindra; John Deere; ITC; Trimble; EM3; Apollo; Accenture; Taranis; BigHaat; Precision Hawk; IBM; NinjaKart |
FaaS, generally abbreviated as FaaS, is a framework of professional services that offer a suite of agrarian management solutions. It gives farmers access to various services such as precision farming tools, analytics, utility & labor services, equipment rentals, and entrance to a broader audience & markets, among others. The factors such as increasing adoption of modern agricultural methods, reducing labor costs, and rising demand for food due to the growing population are the significant drivers attributing to the industry’s growth.
The FaaS market is segmented as service type, delivery model, and end-user. The service segment is further segmented into three sub-segments: farm management solutions, production assistance, and market access. Analytics services are concerned with metrics like yield monitoring, weather data, germination data, soil quality data, etc. are dealt with in farm management. Access to markets deals with cutting out intermediaries and linking farmers directly to suppliers and marketplaces using technologies like IoT and mobile applications.
Production support deals with outsourcing or leasing of both equipment and human resources. The delivery model is further bifurcated into two types: subscription and pay-per-use. In the subscription model, the farmer rents out equipment for a certain period. In the pay-per-use type, the farmer pays for the equipment each time he uses it. FaaS prevents resource misuse and encourages increased crop productivity. Due to the increased use of FaaS, farmers are becoming more proficient in smart livestock monitoring, farm management, information sharing, and precision farming, among others.
In July 2020, DeHaat, an end-to-end farming solutions & service provider, adopted a franchise-based approach. DeHaat center in Jaipur is a franchise that provides services such as farm inputs to produce offloading. Farmers can obtain advisory services at the center, over the phone, and through the DeHaat mobile app. Jaipur’s DeHaat center serves 300-400 farmers. More than 650,000 farmers in Bihar, Jharkhand, Odisha, West Bengal, and Uttar Pradesh are supported by approximately 1,890 franchises.
According to a study published by International Labor Organization (ILO), “Improving market access for smallholder farmers,” conducted by the farmers who used FaaS techniques on their farms noticed a significant improvement in both the quality and quantity of their produce. According to the findings of the report, the farmers who sold their products through the ‘Out Grower’ scheme saw an increase in their income by USD 274 per farm in a year as opposed to the farmers who struck to traditional methods, which saw a rise of only USD 31 per farm in a year.
The farmers enrolled in the scheme were also able to meet the order demand consistently. The model was mapped into a simple value chain that included farmers, retailers, distributors, and consumers. Farmers who participated in the intervention improved their horticulture production methods over those who did not. When participating in the ‘Out Grower’ program, producers should practice effective farm management, which includes rain, seedling nurseries, and garden beds protective tunnels) the average increase in productivity went up by 17%, from 44% in a year to 61% in a year after enrolling in the program.
Farming As A Service Market Segmentations:
By Type
By Delivery Model
By End-user
Chapter 1. Introduction
1.1. Research Objective
1.2. Scope of the Study
1.3. Definition
Chapter 2. Research Methodology
2.1. Research Approach
2.2. Data Sources
2.3. Assumptions & Limitations
Chapter 3. Executive Summary
3.1. Market Snapshot
Chapter 4. Market Variables and Scope
4.1. Introduction
4.2. Market Classification and Scope
4.3. Industry Value Chain Analysis
4.3.1. Raw Material Procurement Analysis
4.3.2. Sales and Distribution Type Analysis
4.3.3. Downstream Buyer Analysis
Chapter 5. COVID 19 Impact on Farming As A Service Market
5.1. COVID-19 Landscape: Farming As A Service Industry Impact
5.2. COVID 19 - Impact Assessment for the Industry
5.3. COVID 19 Impact: Global Major Government Policy
5.4. Market Trends and Opportunities in the COVID-19 Landscape
Chapter 6. Market Dynamics Analysis and Trends
6.1. Market Dynamics
6.1.1. Market Drivers
6.1.2. Market Restraints
6.1.3. Market Opportunities
6.2. Porter’s Five Forces Analysis
6.2.1. Bargaining power of suppliers
6.2.2. Bargaining power of buyers
6.2.3. Threat of substitute
6.2.4. Threat of new entrants
6.2.5. Degree of competition
Chapter 7. Competitive Landscape
7.1.1. Company Market Share/Positioning Analysis
7.1.2. Key Strategies Adopted by Players
7.1.3. Vendor Landscape
7.1.3.1. List of Suppliers
7.1.3.2. List of Buyers
Chapter 8. Global Farming As A Service Market, By Type
8.1. Farming As A Service Market, by Type, 2023-2032
8.1.1 Farm Management Solutions
8.1.1.1. Market Revenue and Forecast (2020-2032)
8.1.2. Production Assistance
8.1.2.1. Market Revenue and Forecast (2020-2032)
8.1.3. Access to Markets
8.1.3.1. Market Revenue and Forecast (2020-2032)
Chapter 9. Global Farming As A Service Market, By Delivery Model
9.1. Farming As A Service Market, by Delivery Model, 2023-2032
9.1.1. Subscription
9.1.1.1. Market Revenue and Forecast (2020-2032)
9.1.2. Pay-per-use
9.1.2.1. Market Revenue and Forecast (2020-2032)
Chapter 10. Global Farming As A Service Market, By End-user
10.1. Farming As A Service Market, by End-user, 2023-2032
10.1.1. Farmers
10.1.1.1. Market Revenue and Forecast (2020-2032)
10.1.2. Government
10.1.2.1. Market Revenue and Forecast (2020-2032)
10.1.3. Corporate
10.1.3.1. Market Revenue and Forecast (2020-2032)
10.1.4. Financial Institutions
10.1.4.1. Market Revenue and Forecast (2020-2032)
10.1.5. Advisory Bodies
10.1.5.1. Market Revenue and Forecast (2020-2032)
Chapter 11. Global Farming As A Service Market, Regional Estimates and Trend Forecast
11.1. North America
11.1.1. Market Revenue and Forecast, by Type (2020-2032)
11.1.2. Market Revenue and Forecast, by Delivery Model (2020-2032)
11.1.3. Market Revenue and Forecast, by End-user (2020-2032)
11.1.4. U.S.
11.1.4.1. Market Revenue and Forecast, by Type (2020-2032)
11.1.4.2. Market Revenue and Forecast, by Delivery Model (2020-2032)
11.1.4.3. Market Revenue and Forecast, by End-user (2020-2032)
11.1.5. Rest of North America
11.1.5.1. Market Revenue and Forecast, by Type (2020-2032)
11.1.5.2. Market Revenue and Forecast, by Delivery Model (2020-2032)
11.1.5.3. Market Revenue and Forecast, by End-user (2020-2032)
11.2. Europe
11.2.1. Market Revenue and Forecast, by Type (2020-2032)
11.2.2. Market Revenue and Forecast, by Delivery Model (2020-2032)
11.2.3. Market Revenue and Forecast, by End-user (2020-2032)
11.2.4. UK
11.2.4.1. Market Revenue and Forecast, by Type (2020-2032)
11.2.4.2. Market Revenue and Forecast, by Delivery Model (2020-2032)
11.2.4.3. Market Revenue and Forecast, by End-user (2020-2032)
11.2.5. Germany
11.2.5.1. Market Revenue and Forecast, by Type (2020-2032)
11.2.5.2. Market Revenue and Forecast, by Delivery Model (2020-2032)
11.2.5.3. Market Revenue and Forecast, by End-user (2020-2032)
11.2.6. France
11.2.6.1. Market Revenue and Forecast, by Type (2020-2032)
11.2.6.2. Market Revenue and Forecast, by Delivery Model (2020-2032)
11.2.6.3. Market Revenue and Forecast, by End-user (2020-2032)
11.2.7. Rest of Europe
11.2.7.1. Market Revenue and Forecast, by Type (2020-2032)
11.2.7.2. Market Revenue and Forecast, by Delivery Model (2020-2032)
11.2.7.3. Market Revenue and Forecast, by End-user (2020-2032)
11.3. APAC
11.3.1. Market Revenue and Forecast, by Type (2020-2032)
11.3.2. Market Revenue and Forecast, by Delivery Model (2020-2032)
11.3.3. Market Revenue and Forecast, by End-user (2020-2032)
11.3.4. India
11.3.4.1. Market Revenue and Forecast, by Type (2020-2032)
11.3.4.2. Market Revenue and Forecast, by Delivery Model (2020-2032)
11.3.4.3. Market Revenue and Forecast, by End-user (2020-2032)
11.3.5. China
11.3.5.1. Market Revenue and Forecast, by Type (2020-2032)
11.3.5.2. Market Revenue and Forecast, by Delivery Model (2020-2032)
11.3.5.3. Market Revenue and Forecast, by End-user (2020-2032)
11.3.6. Japan
11.3.6.1. Market Revenue and Forecast, by Type (2020-2032)
11.3.6.2. Market Revenue and Forecast, by Delivery Model (2020-2032)
11.3.6.3. Market Revenue and Forecast, by End-user (2020-2032)
11.3.7. Rest of APAC
11.3.7.1. Market Revenue and Forecast, by Type (2020-2032)
11.3.7.2. Market Revenue and Forecast, by Delivery Model (2020-2032)
11.3.7.3. Market Revenue and Forecast, by End-user (2020-2032)
11.4. MEA
11.4.1. Market Revenue and Forecast, by Type (2020-2032)
11.4.2. Market Revenue and Forecast, by Delivery Model (2020-2032)
11.4.3. Market Revenue and Forecast, by End-user (2020-2032)
11.4.4. GCC
11.4.4.1. Market Revenue and Forecast, by Type (2020-2032)
11.4.4.2. Market Revenue and Forecast, by Delivery Model (2020-2032)
11.4.4.3. Market Revenue and Forecast, by End-user (2020-2032)
11.4.5. North Africa
11.4.5.1. Market Revenue and Forecast, by Type (2020-2032)
11.4.5.2. Market Revenue and Forecast, by Delivery Model (2020-2032)
11.4.5.3. Market Revenue and Forecast, by End-user (2020-2032)
11.4.6. South Africa
11.4.6.1. Market Revenue and Forecast, by Type (2020-2032)
11.4.6.2. Market Revenue and Forecast, by Delivery Model (2020-2032)
11.4.6.3. Market Revenue and Forecast, by End-user (2020-2032)
11.4.7. Rest of MEA
11.4.7.1. Market Revenue and Forecast, by Type (2020-2032)
11.4.7.2. Market Revenue and Forecast, by Delivery Model (2020-2032)
11.4.7.3. Market Revenue and Forecast, by End-user (2020-2032)
11.5. Latin America
11.5.1. Market Revenue and Forecast, by Type (2020-2032)
11.5.2. Market Revenue and Forecast, by Delivery Model (2020-2032)
11.5.3. Market Revenue and Forecast, by End-user (2020-2032)
11.5.4. Brazil
11.5.4.1. Market Revenue and Forecast, by Type (2020-2032)
11.5.4.2. Market Revenue and Forecast, by Delivery Model (2020-2032)
11.5.4.3. Market Revenue and Forecast, by End-user (2020-2032)
11.5.5. Rest of LATAM
11.5.5.1. Market Revenue and Forecast, by Type (2020-2032)
11.5.5.2. Market Revenue and Forecast, by Delivery Model (2020-2032)
11.5.5.3. Market Revenue and Forecast, by End-user (2020-2032)
Chapter 12. Company Profiles
12.1. Mahindra and Mahindra
12.1.1. Company Overview
12.1.2. Product Offerings
12.1.3. Financial Performance
12.1.4. Recent Initiatives
12.2. John Deere
12.2.1. Company Overview
12.2.2. Product Offerings
12.2.3. Financial Performance
12.2.4. Recent Initiatives
12.3. ITC
12.3.1. Company Overview
12.3.2. Product Offerings
12.3.3. Financial Performance
12.3.4. Recent Initiatives
12.4. Trimble
12.4.1. Company Overview
12.4.2. Product Offerings
12.4.3. Financial Performance
12.4.4. Recent Initiatives
12.5. EM3
12.5.1. Company Overview
12.5.2. Product Offerings
12.5.3. Financial Performance
12.5.4. Recent Initiatives
12.6. Apollo Agriculture
12.6.1. Company Overview
12.6.2. Product Offerings
12.6.3. Financial Performance
12.6.4. Recent Initiatives
12.7. Accenture
12.7.1. Company Overview
12.7.2. Product Offerings
12.7.3. Financial Performance
12.7.4. Recent Initiatives
12.8. Taranis
12.8.1. Company Overview
12.8.2. Product Offerings
12.8.3. Financial Performance
12.8.4. Recent Initiatives
12.9. Precision Hawk
12.9.1. Company Overview
12.9.2. Product Offerings
12.9.3. Financial Performance
12.9.4. Recent Initiatives
12.10. IBM
12.10.1. Company Overview
12.10.2. Product Offerings
12.10.3. Financial Performance
12.10.4. Recent Initiatives
Chapter 13. Research Methodology
13.1. Primary Research
13.2. Secondary Research
13.3. Assumptions
Chapter 14. Appendix
14.1. About Us
14.2. Glossary of Terms
 Cross-segment Market Size and Analysis for
Mentioned Segments
Additional Company Profiles (Upto 5 With No Cost)
Additional Countries (Apart From Mentioned Countries)
Country/Region-specific Report
Go To Market Strategy
Region Specific Market DynamicsRegion Level Market Share Import Export AnalysisProduction AnalysisOthers
Cross-segment Market Size and Analysis for
Mentioned Segments
Additional Company Profiles (Upto 5 With No Cost)
Additional Countries (Apart From Mentioned Countries)
Country/Region-specific Report
Go To Market Strategy
Region Specific Market DynamicsRegion Level Market Share Import Export AnalysisProduction AnalysisOthers