Firewall As A Service Market Size, Share | Report 2023-2032
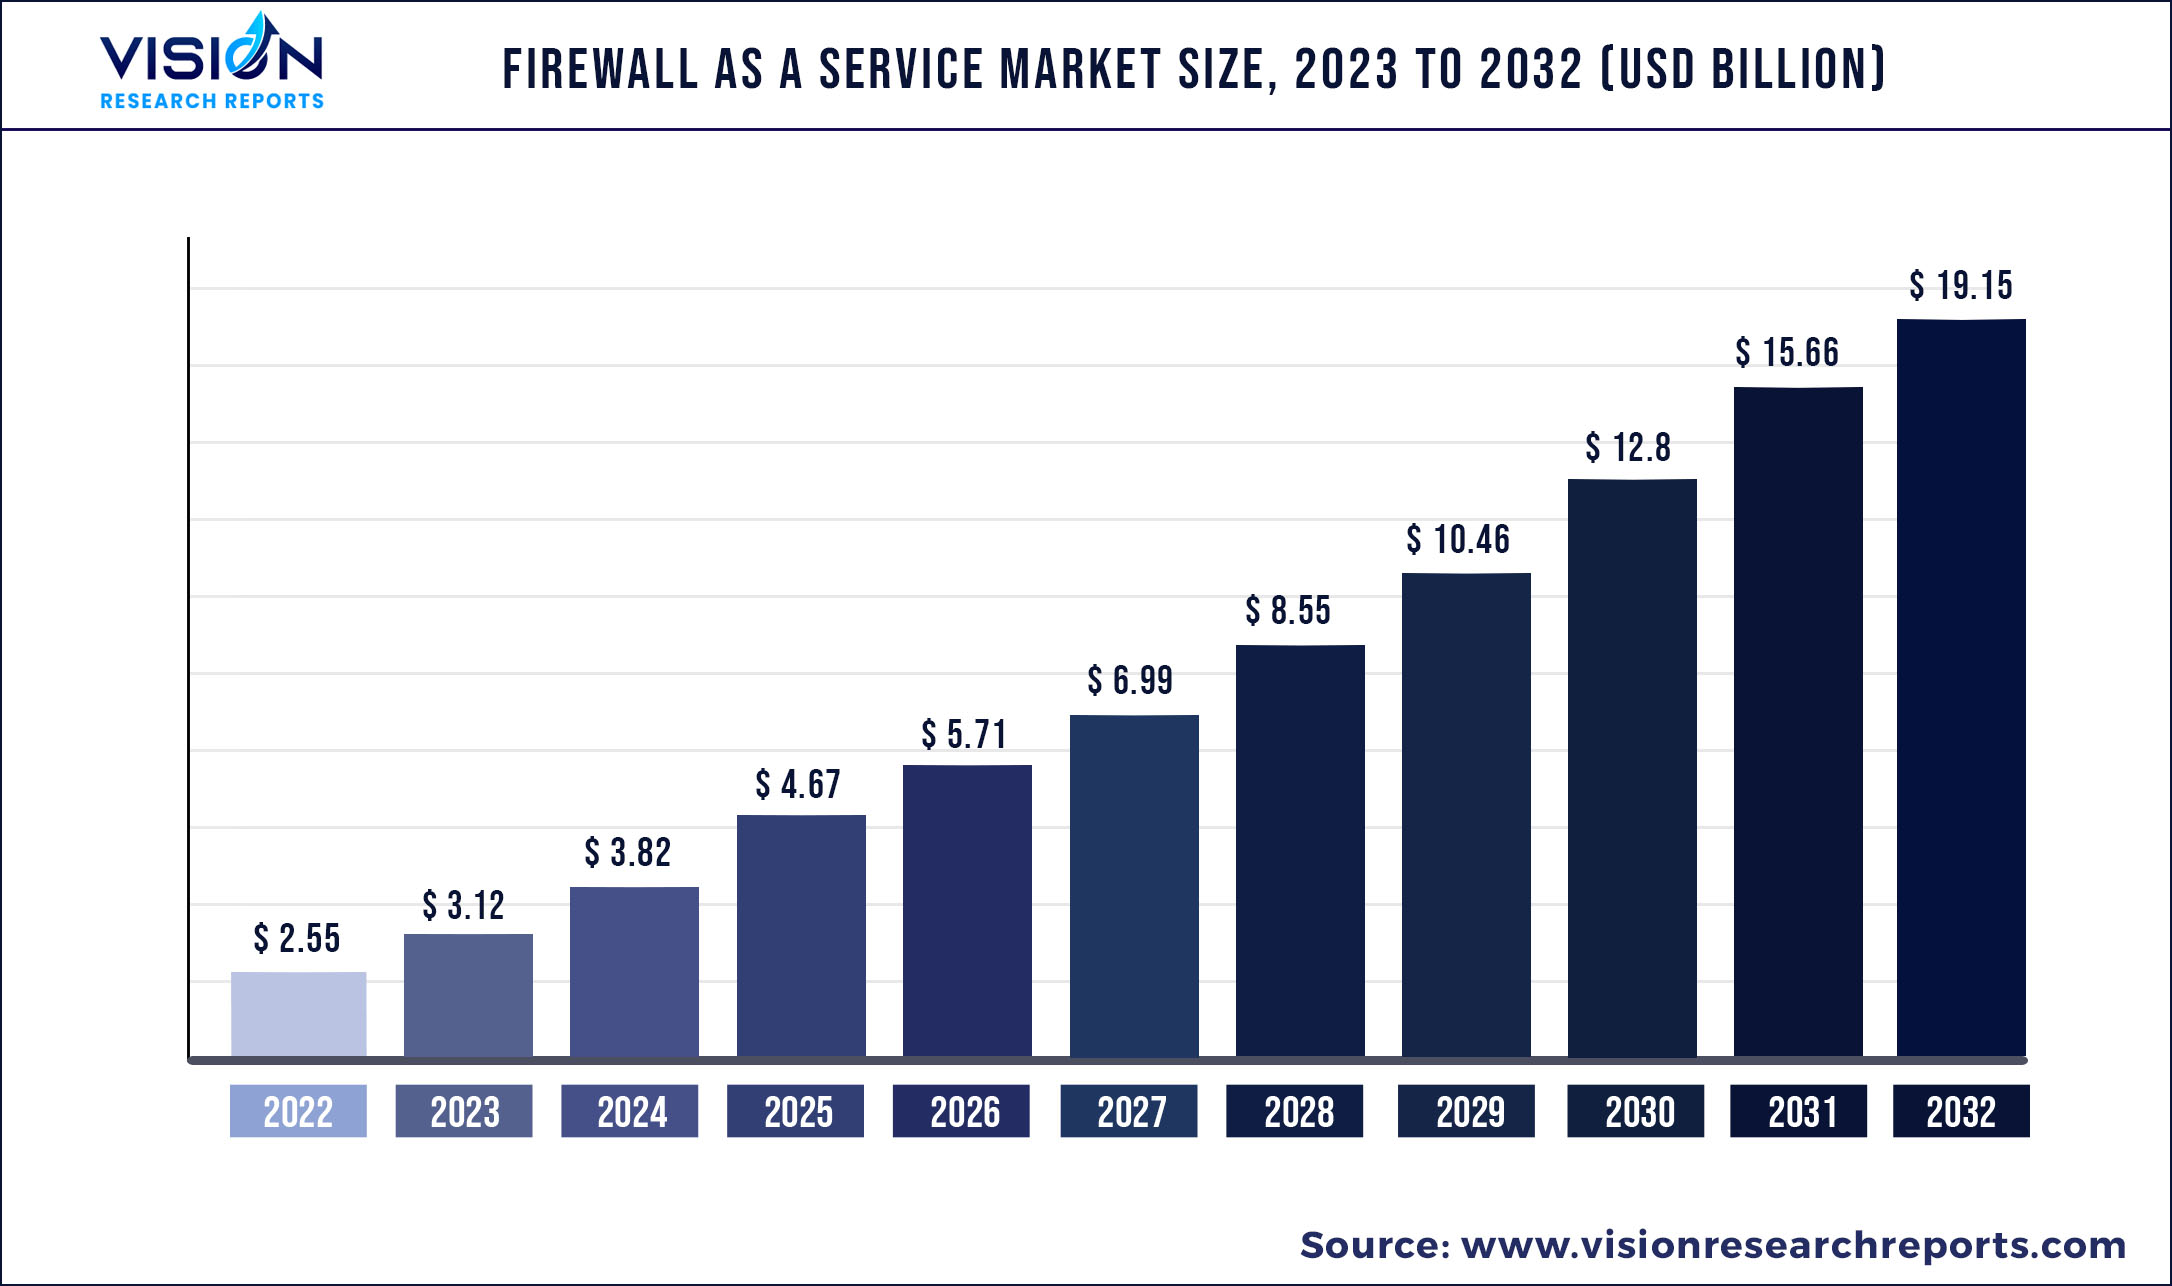
The global firewall as a service market size was estimated at around USD 2.55 billion in 2022 and it is projected to hit around USD 19.15 billion by 2032, growing at a CAGR of 22.34% from 2023 to 2032.
Key Pointers
Report Scope of the Firewall As A Service Market
| Report Coverage | Details |
| Market Size in 2022 | USD 2.55 billion |
| Revenue Forecast by 2032 | USD 19.15 billion |
| Growth rate from 2023 to 2032 | CAGR of 22.34% |
| Base Year | 2022 |
| Forecast Period | 2023 to 2032 |
| Market Analysis (Terms Used) | Value (US$ Million/Billion) or (Volume/Units) |
| Regions Covered | North America, Europe, Asia Pacific, Latin America, Middle East & Africa |
| Companies Covered | Cisco Systems Inc.; Barracuda Networks, Inc.; Check Point Solution Technologies Ltd.; Juniper Networks, Inc.; Cato Networks Ltd.; Palo Alto Networks.; Fortinet, Inc.; Force point LLC; Sophos Ltd.; Zscaler, Inc.; Watch Guard Technologies, Inc.; Sonic Wall |
Firewall as a service is a type of cloud-based security service where a third-party provider manages and maintains firewall protection for an organization. This service offers centralized control, ease of use, and flexibility for enterprises to protect their network against security threats.
It eliminates the need for enterprises to invest in and manage physical firewalls, allowing them to focus on their core business. Factors such as a surge in data breaches in the cloud environment and the proliferation of NGFW across devices are driving the demand for firewall as a service solutions and services.
The COVID-19 outbreak had a positive impact on the firewall as a service market since the lockdown led to a rise in the usage of IoT devices and internet access, resulting in an increased number of cyber-attacks. Due to the widespread shift to remote working models, demand for secure and reliable network protection has increased, driving growth in the firewall as a service market.
Many organizations have opted for firewall as a service as a cost-effective and scalable solution to secure their remote workforces. Additionally, the increase in cyber-attacks targeting remote workers has further increased the need for effective network security. Moreover, COVID-19 has accelerated the trend towards cloud-based security services, including firewall as a service, and is expected to drive continued growth in the market in the coming years.
Regional Insights
North America dominated the market with a share of 34.46% in 2022 and is estimated to expand at a CAGR of 21.83% during the forecast period, owing to factors such as rising cyber-attack cases and increasing banking fraud. Moreover, the presence of prominent market players such as Palo Alto Networks., Cisco Systems Inc., Barracuda Networks, Inc., Juniper Networks, Inc., Fortinet, Inc., and others, is likely to drive the growth for the firewall as a service market in the region.
The market within Asia Pacific is anticipated to expand at the fastest CAGR of 23.71% during the forecast period. Increasing government initiatives in adopting IoT devices and hybrid platforms, along with the increasing regulations regarding cyber security, are factors driving the growth of the firewall as a service industry in the region. For instance, the Government of India launched the Cyber Surakshit Bharat initiative in 2018 with the mission to spread awareness regarding cyber-attacks in the country. It was set up with the purpose of evaluating malware or cyber threats, providing information, and facilitating malware removal.
Firewall As A Service Market Segmentations:
| By Service Type | By Deployment Model | By Enterprise Size | By Industry Vertical |
|
Traffic Monitoring & Control Compliance & Audit Management Reporting & Log Management Automation & Orchestration Security Management Managed Services Professional Services Others |
Public Private Hybrid |
Large Size Enterprises Small and Medium Sized Enterprises (SMEs) |
BFSI Retail IT & Telecommunication Healthcare Energy & Utilities Government Manufacturing Education Others |
Chapter 1. Introduction
1.1. Research Objective
1.2. Scope of the Study
1.3. Definition
Chapter 2. Research Methodology
2.1. Research Approach
2.2. Data Sources
2.3. Assumptions & Limitations
Chapter 3. Executive Summary
3.1. Market Snapshot
Chapter 4. Market Variables and Scope
4.1. Introduction
4.2. Market Classification and Scope
4.3. Industry Value Chain Analysis
4.3.1. Raw Material Procurement Analysis
4.3.2. Sales and Distribution Channel Analysis
4.3.3. Downstream Buyer Analysis
Chapter 5. COVID 19 Impact on Firewall As A Service Market
5.1. COVID-19 Landscape: Firewall As A Service Industry Impact
5.2. COVID 19 - Impact Assessment for the Industry
5.3. COVID 19 Impact: Global Major Government Policy
5.4. Market Trends and Opportunities in the COVID-19 Landscape
Chapter 6. Market Dynamics Analysis and Trends
6.1. Market Dynamics
6.1.1. Market Drivers
6.1.2. Market Restraints
6.1.3. Market Opportunities
6.2. Porter’s Five Forces Analysis
6.2.1. Bargaining power of suppliers
6.2.2. Bargaining power of buyers
6.2.3. Threat of substitute
6.2.4. Threat of new entrants
6.2.5. Degree of competition
Chapter 7. Competitive Landscape
7.1.1. Company Market Share/Positioning Analysis
7.1.2. Key Strategies Adopted by Players
7.1.3. Vendor Landscape
7.1.3.1. List of Suppliers
7.1.3.2. List of Buyers
Chapter 8. Global Firewall As A Service Market, By Service Type
8.1. Firewall As A Service Market, by Service Type, 2023-2032
8.1.1. Traffic Monitoring & Control
8.1.1.1. Market Revenue and Forecast (2020-2032)
8.1.2. Compliance & Audit Management
8.1.2.1. Market Revenue and Forecast (2020-2032)
8.1.3. Reporting & Log Management
8.1.3.1. Market Revenue and Forecast (2020-2032)
8.1.4. Automation & Orchestration
8.1.4.1. Market Revenue and Forecast (2020-2032)
8.1.5. Security Management
8.1.5.1. Market Revenue and Forecast (2020-2032)
8.1.6. Managed Services
8.1.6.1. Market Revenue and Forecast (2020-2032)
8.1.7. Professional Services
8.1.7.1. Market Revenue and Forecast (2020-2032)
8.1.8. Others
8.1..1. Market Revenue and Forecast (2020-2032)
Chapter 9. Global Firewall As A Service Market, By Deployment Model
9.1. Firewall As A Service Market, by Deployment Model, 2023-2032
9.1.1. Public
9.1.1.1. Market Revenue and Forecast (2020-2032)
9.1.2. Private
9.1.2.1. Market Revenue and Forecast (2020-2032)
9.1.3. Hybrid
9.1.3.1. Market Revenue and Forecast (2020-2032)
Chapter 10. Global Firewall As A Service Market, By Enterprise Size
10.1. Firewall As A Service Market, by Enterprise Size, 2023-2032
10.1.1. Large Size Enterprises
10.1.1.1. Market Revenue and Forecast (2020-2032)
10.1.2. Small and Medium Sized Enterprises (SMEs)
10.1.2.1. Market Revenue and Forecast (2020-2032)
Chapter 11. Global Firewall As A Service Market, By Industry Vertical
11.1. Firewall As A Service Market, by Industry Vertical, 2023-2032
11.1.1. BFSI
11.1.1.1. Market Revenue and Forecast (2020-2032)
11.1.2. Retail
11.1.2.1. Market Revenue and Forecast (2020-2032)
11.1.3. IT & Telecommunication
11.1.3.1. Market Revenue and Forecast (2020-2032)
11.1.4. Healthcare
11.1.4.1. Market Revenue and Forecast (2020-2032)
11.1.5. Energy & Utilities
11.1.5.1. Market Revenue and Forecast (2020-2032)
11.1.6. Government
11.1.6.1. Market Revenue and Forecast (2020-2032)
11.1.7. Manufacturing
11.1.7.1. Market Revenue and Forecast (2020-2032)
11.1.8. Education
11.1.8.1. Market Revenue and Forecast (2020-2032)
11.1.9. Others
11.1.9.1. Market Revenue and Forecast (2020-2032)
Chapter 12. Global Firewall As A Service Market, Regional Estimates and Trend Forecast
12.1. North America
12.1.1. Market Revenue and Forecast, by Service Type (2020-2032)
12.1.2. Market Revenue and Forecast, by Deployment Model (2020-2032)
12.1.3. Market Revenue and Forecast, by Enterprise Size (2020-2032)
12.1.4. Market Revenue and Forecast, by Industry Vertical (2020-2032)
12.1.5. U.S.
12.1.5.1. Market Revenue and Forecast, by Service Type (2020-2032)
12.1.5.2. Market Revenue and Forecast, by Deployment Model (2020-2032)
12.1.5.3. Market Revenue and Forecast, by Enterprise Size (2020-2032)
12.1.5.4. Market Revenue and Forecast, by Industry Vertical (2020-2032)
12.1.6. Rest of North America
12.1.6.1. Market Revenue and Forecast, by Service Type (2020-2032)
12.1.6.2. Market Revenue and Forecast, by Deployment Model (2020-2032)
12.1.6.3. Market Revenue and Forecast, by Enterprise Size (2020-2032)
12.1.6.4. Market Revenue and Forecast, by Industry Vertical (2020-2032)
12.2. Europe
12.2.1. Market Revenue and Forecast, by Service Type (2020-2032)
12.2.2. Market Revenue and Forecast, by Deployment Model (2020-2032)
12.2.3. Market Revenue and Forecast, by Enterprise Size (2020-2032)
12.2.4. Market Revenue and Forecast, by Industry Vertical (2020-2032)
12.2.5. UK
12.2.5.1. Market Revenue and Forecast, by Service Type (2020-2032)
12.2.5.2. Market Revenue and Forecast, by Deployment Model (2020-2032)
12.2.5.3. Market Revenue and Forecast, by Enterprise Size (2020-2032)
12.2.5.4. Market Revenue and Forecast, by Industry Vertical (2020-2032)
12.2.6. Germany
12.2.6.1. Market Revenue and Forecast, by Service Type (2020-2032)
12.2.6.2. Market Revenue and Forecast, by Deployment Model (2020-2032)
12.2.6.3. Market Revenue and Forecast, by Enterprise Size (2020-2032)
12.2.6.4. Market Revenue and Forecast, by Industry Vertical (2020-2032)
12.2.7. France
12.2.7.1. Market Revenue and Forecast, by Service Type (2020-2032)
12.2.7.2. Market Revenue and Forecast, by Deployment Model (2020-2032)
12.2.7.3. Market Revenue and Forecast, by Enterprise Size (2020-2032)
12.2.7.4. Market Revenue and Forecast, by Industry Vertical (2020-2032)
12.2.8. Rest of Europe
12.2.8.1. Market Revenue and Forecast, by Service Type (2020-2032)
12.2.8.2. Market Revenue and Forecast, by Deployment Model (2020-2032)
12.2.8.3. Market Revenue and Forecast, by Enterprise Size (2020-2032)
12.2.8.4. Market Revenue and Forecast, by Industry Vertical (2020-2032)
12.3. APAC
12.3.1. Market Revenue and Forecast, by Service Type (2020-2032)
12.3.2. Market Revenue and Forecast, by Deployment Model (2020-2032)
12.3.3. Market Revenue and Forecast, by Enterprise Size (2020-2032)
12.3.4. Market Revenue and Forecast, by Industry Vertical (2020-2032)
12.3.5. India
12.3.5.1. Market Revenue and Forecast, by Service Type (2020-2032)
12.3.5.2. Market Revenue and Forecast, by Deployment Model (2020-2032)
12.3.5.3. Market Revenue and Forecast, by Enterprise Size (2020-2032)
12.3.5.4. Market Revenue and Forecast, by Industry Vertical (2020-2032)
12.3.6. China
12.3.6.1. Market Revenue and Forecast, by Service Type (2020-2032)
12.3.6.2. Market Revenue and Forecast, by Deployment Model (2020-2032)
12.3.6.3. Market Revenue and Forecast, by Enterprise Size (2020-2032)
12.3.6.4. Market Revenue and Forecast, by Industry Vertical (2020-2032)
12.3.7. Japan
12.3.7.1. Market Revenue and Forecast, by Service Type (2020-2032)
12.3.7.2. Market Revenue and Forecast, by Deployment Model (2020-2032)
12.3.7.3. Market Revenue and Forecast, by Enterprise Size (2020-2032)
12.3.7.4. Market Revenue and Forecast, by Industry Vertical (2020-2032)
12.3.8. Rest of APAC
12.3.8.1. Market Revenue and Forecast, by Service Type (2020-2032)
12.3.8.2. Market Revenue and Forecast, by Deployment Model (2020-2032)
12.3.8.3. Market Revenue and Forecast, by Enterprise Size (2020-2032)
12.3.8.4. Market Revenue and Forecast, by Industry Vertical (2020-2032)
12.4. MEA
12.4.1. Market Revenue and Forecast, by Service Type (2020-2032)
12.4.2. Market Revenue and Forecast, by Deployment Model (2020-2032)
12.4.3. Market Revenue and Forecast, by Enterprise Size (2020-2032)
12.4.4. Market Revenue and Forecast, by Industry Vertical (2020-2032)
12.4.5. GCC
12.4.5.1. Market Revenue and Forecast, by Service Type (2020-2032)
12.4.5.2. Market Revenue and Forecast, by Deployment Model (2020-2032)
12.4.5.3. Market Revenue and Forecast, by Enterprise Size (2020-2032)
12.4.5.4. Market Revenue and Forecast, by Industry Vertical (2020-2032)
12.4.6. North Africa
12.4.6.1. Market Revenue and Forecast, by Service Type (2020-2032)
12.4.6.2. Market Revenue and Forecast, by Deployment Model (2020-2032)
12.4.6.3. Market Revenue and Forecast, by Enterprise Size (2020-2032)
12.4.6.4. Market Revenue and Forecast, by Industry Vertical (2020-2032)
12.4.7. South Africa
12.4.7.1. Market Revenue and Forecast, by Service Type (2020-2032)
12.4.7.2. Market Revenue and Forecast, by Deployment Model (2020-2032)
12.4.7.3. Market Revenue and Forecast, by Enterprise Size (2020-2032)
12.4.7.4. Market Revenue and Forecast, by Industry Vertical (2020-2032)
12.4.8. Rest of MEA
12.4.8.1. Market Revenue and Forecast, by Service Type (2020-2032)
12.4.8.2. Market Revenue and Forecast, by Deployment Model (2020-2032)
12.4.8.3. Market Revenue and Forecast, by Enterprise Size (2020-2032)
12.4.8.4. Market Revenue and Forecast, by Industry Vertical (2020-2032)
12.5. Latin America
12.5.1. Market Revenue and Forecast, by Service Type (2020-2032)
12.5.2. Market Revenue and Forecast, by Deployment Model (2020-2032)
12.5.3. Market Revenue and Forecast, by Enterprise Size (2020-2032)
12.5.4. Market Revenue and Forecast, by Industry Vertical (2020-2032)
12.5.5. Brazil
12.5.5.1. Market Revenue and Forecast, by Service Type (2020-2032)
12.5.5.2. Market Revenue and Forecast, by Deployment Model (2020-2032)
12.5.5.3. Market Revenue and Forecast, by Enterprise Size (2020-2032)
12.5.5.4. Market Revenue and Forecast, by Industry Vertical (2020-2032)
12.5.6. Rest of LATAM
12.5.6.1. Market Revenue and Forecast, by Service Type (2020-2032)
12.5.6.2. Market Revenue and Forecast, by Deployment Model (2020-2032)
12.5.6.3. Market Revenue and Forecast, by Enterprise Size (2020-2032)
12.5.6.4. Market Revenue and Forecast, by Industry Vertical (2020-2032)
Chapter 13. Company Profiles
13.1. Cisco Systems Inc.
13.1.1. Company Overview
13.1.2. Product Offerings
13.1.3. Financial Performance
13.1.4. Recent Initiatives
13.2. Barracuda Networks, Inc.
13.2.1. Company Overview
13.2.2. Product Offerings
13.2.3. Financial Performance
13.2.4. Recent Initiatives
13.3. Check Point Solution Technologies Ltd.
13.3.1. Company Overview
13.3.2. Product Offerings
13.3.3. Financial Performance
13.3.4. Recent Initiatives
13.4. Juniper Networks, Inc.
13.4.1. Company Overview
13.4.2. Product Offerings
13.4.3. Financial Performance
13.4.4. Recent Initiatives
13.5. Cato Networks Ltd.
13.5.1. Company Overview
13.5.2. Product Offerings
13.5.3. Financial Performance
13.5.4. Recent Initiatives
13.6. Palo Alto Networks.
13.6.1. Company Overview
13.6.2. Product Offerings
13.6.3. Financial Performance
13.6.4. Recent Initiatives
13.7. Fortinet, Inc.
13.7.1. Company Overview
13.7.2. Product Offerings
13.7.3. Financial Performance
13.7.4. Recent Initiatives
13.8. Force point LLC
13.8.1. Company Overview
13.8.2. Product Offerings
13.8.3. Financial Performance
13.8.4. Recent Initiatives
13.9. Sophos Ltd.
13.9.1. Company Overview
13.9.2. Product Offerings
13.9.3. Financial Performance
13.9.4. Recent Initiatives
13.10. Zscaler, Inc.
13.10.1. Company Overview
13.10.2. Product Offerings
13.10.3. Financial Performance
13.10.4. Recent Initiatives
Chapter 14. Research Methodology
14.1. Primary Research
14.2. Secondary Research
14.3. Assumptions
Chapter 15. Appendix
15.1. About Us
15.2. Glossary of Terms
 Cross-segment Market Size and Analysis for
Mentioned Segments
Additional Company Profiles (Upto 5 With No Cost)
Additional Countries (Apart From Mentioned Countries)
Country/Region-specific Report
Go To Market Strategy
Region Specific Market DynamicsRegion Level Market Share Import Export AnalysisProduction AnalysisOthers
Cross-segment Market Size and Analysis for
Mentioned Segments
Additional Company Profiles (Upto 5 With No Cost)
Additional Countries (Apart From Mentioned Countries)
Country/Region-specific Report
Go To Market Strategy
Region Specific Market DynamicsRegion Level Market Share Import Export AnalysisProduction AnalysisOthers