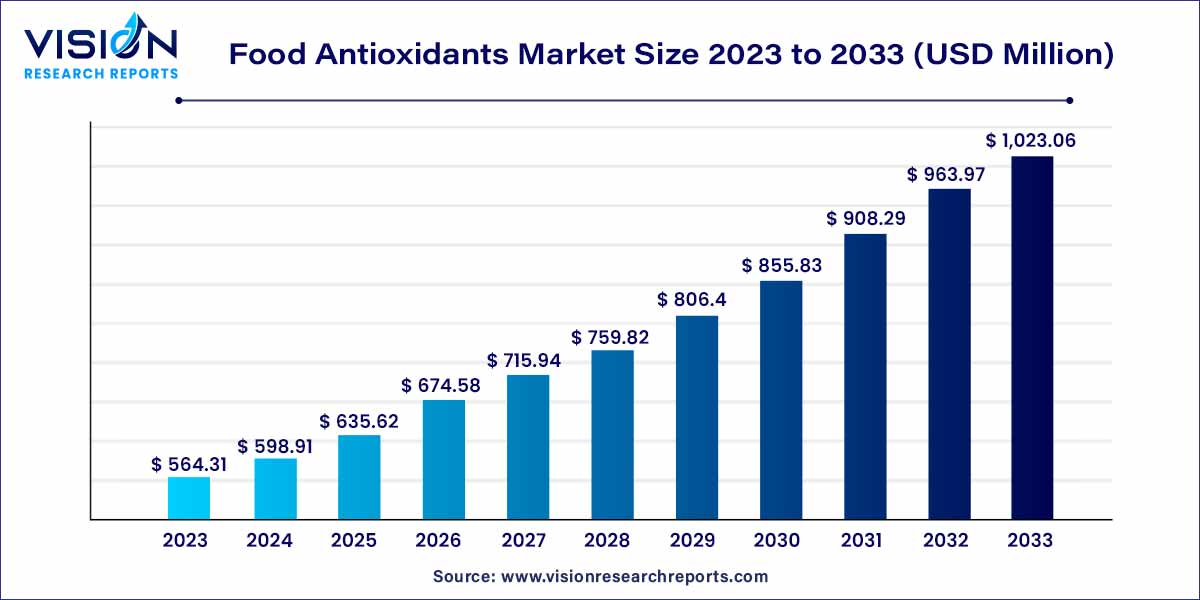
The global food antioxidants market was estimated at USD 564.31 million in 2023 and it is expected to surpass around USD 1,023.06 million by 2033, poised to grow at a CAGR of 6.13% from 2024 to 2033. The food antioxidants market is driven by the growing application of food antioxidants in a wide variety of prepared meals and packaged food has been the key driver for the growth of the market.

In the vast expanse of the global food industry, the food antioxidants market stands as a critical player, influencing the quality, longevity, and nutritional value of a diverse range of food products. This overview aims to provide a concise yet comprehensive understanding of the market dynamics, key players, driving forces, and emerging trends that collectively shape this dynamic sector.
The food antioxidants Market is experiencing robust growth driven by several key factors. Heightened consumer awareness regarding health and wellness, coupled with an increasing preference for clean-label and minimally processed foods, has fueled the demand for products fortified with antioxidants. The market's expansion is further propelled by the rising incidence of food spoilage and the need to extend the shelf life of perishable items. Additionally, a growing emphasis on incorporating natural and sustainable ingredients in food formulations aligns with the market's trajectory, as consumers seek healthier alternatives. The integration of antioxidants into a diverse range of food and beverage offerings, including functional foods and dietary supplements, serves as a catalyst for market growth. As industry players continue to innovate and leverage novel sources of antioxidants, such as plant-derived polyphenols, the market is poised to capitalize on these growth factors and shape the future of the global food industry.
| Report Coverage | Details |
| Market Revenue by 2033 | USD 1,023.06 million |
| Growth Rate from 2024 to 2033 | CAGR of 6.13% |
| Revenue Share of Asia Pacific in 2023 | 35% |
| Base Year | 2023 |
| Forecast Period | 2024 to 2033 |
| Market Analysis (Terms Used) | Value (US$ Million/Billion) or (Volume/Units) |
Food Antioxidants Market Drivers
Food Antioxidants Market Restraints
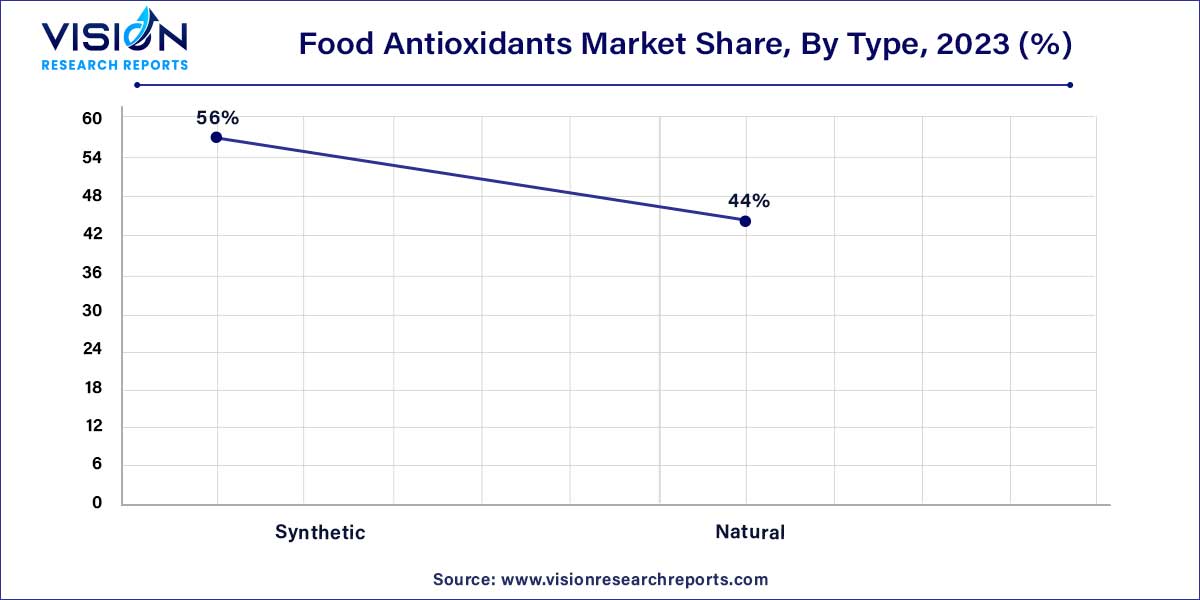
The market was predominantly led by the synthetic type segment, commanding a revenue share exceeding 56% in 2023. This dominance can be attributed to the increasing use of synthetic antioxidants like butylated hydroxyanisole (BHA), butylated hydroxytoluene (BHT), Tert-butylhydroquinone (TBHQ), and Propyl Gallate (PG) across a diverse array of food products. The formulation of synthetic antioxidants involves a combination of various chemicals and follows an industrial process. Consequently, many countries have implemented stringent regulations on their use as additives due to their synthetic nature. Synthetic antioxidants play a crucial role in enhancing the shelf life of food products while imparting improved texture, color, and fragrance.

In contrast, natural antioxidants are derived from sources such as plants, animals, fruits, herbs, and spices, avoiding typical chemical processes. Carotenoids, rosemary extracts, vitamin C, vitamin E, ascorbic acid, alpha-tocopherol, and other naturally occurring compounds fall under the category of natural antioxidants. The escalating inclination toward adopting a healthy lifestyle has driven the increased consumption of naturally derived antioxidants. As awareness of health benefits grows and concerns about the potential side effects of chemical additives mount, the demand for natural antioxidants is anticipated to surge in the years ahead.
The dry form segment emerged as the market leader, commanding a substantial revenue share of over 73% in 2023. This dominance is primarily attributed to the escalating consumption of powder-based antioxidants in various food products. Technical grade powders, in particular, are widely utilized across a diverse range of food items, offering a highly consumable option. The effectiveness of powder in mitigating the impact of free radicals and reducing associated damage further contributes to its prevalence. A significant proportion of food antioxidants, including powder, tablets, flakes, and granular forms, are in dry format. The preference for dry antioxidants prevails among consumers due to the convenience of transport, storage, and usage. The expanding market for prepared foods is anticipated to be a key driver propelling the global demand for dry antioxidants in the coming years.
While liquid antioxidants find application in an array of food products such as fats, oils, and mayonnaise, their market share is comparatively restricted. The complexity associated with transporting, storing, and using liquid antioxidants, coupled with challenges in their compatibility with all types of food products, results in a limited demand for liquid antioxidants in the foreseeable future.
The Meat & Poultry application held the largest revenue share of 33% in 2023. This growth is fueled by the global surge in meat and related food product consumption. Recognized as rich sources of essential proteins crucial for a balanced diet, meat and poultry products have become integral components of human nutrition. The meat segment, encompassing red meat from sources like pork, lamb, and beef, plays a pivotal role. Notably, the growing preference for poultry meat, driven by its cost-effectiveness, is a key driver propelling the poultry market's expansion. The packaged form of meat and poultry products, stored for extended periods, relies on food antioxidants to prevent bacterial and fungal contamination, ensuring an extended shelf life. With the increasing acknowledgment of the health benefits associated with meat and poultry consumption, the demand for food antioxidants is expected to witness substantial growth in the coming years.
Bakery and confectionery products enjoy widespread consumption across all age groups. This category includes staples like bread, toast, cookies, biscuits, and more, constituting essential elements of daily diets. The bakery and confectionery market is experiencing rapid innovation to align with evolving consumer habits and preferences. Additionally, the tradition of gifting chocolates, sweets, and other confectionery items, especially during festivals, contributes significantly to the market's growth. The anticipated rise in consumption of bakery and confectionery products is poised to drive the demand for food antioxidants throughout the forecast period.
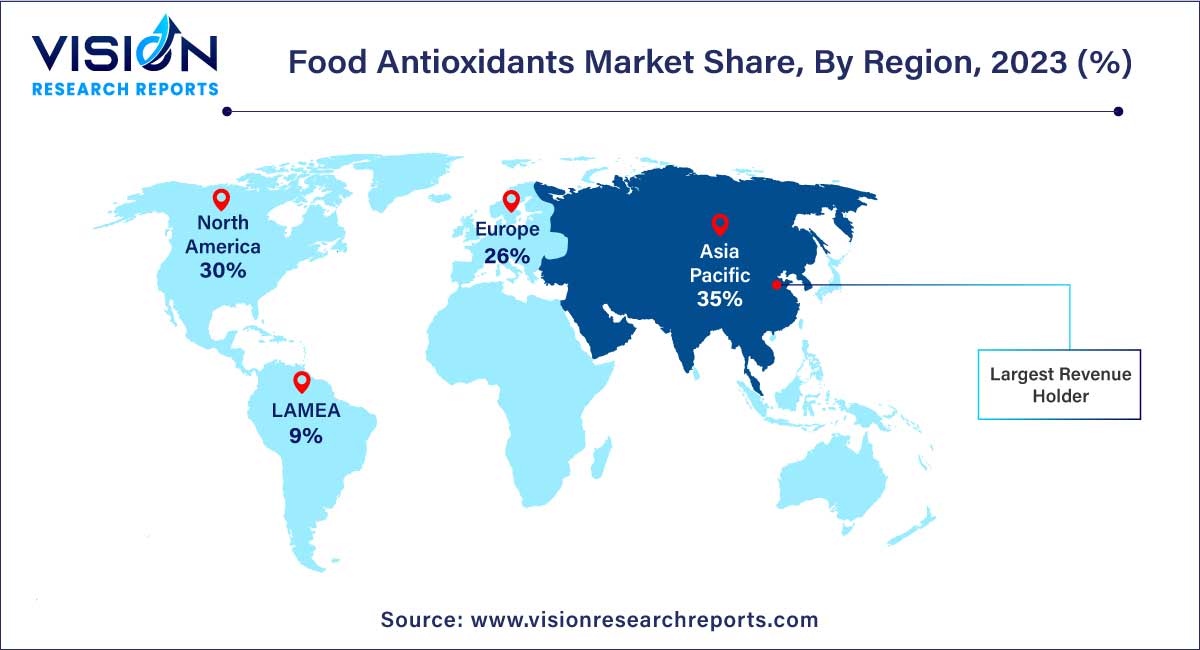
Asia Pacific dominated the market with the largest market share of 35% in 2023. This notable share can be attributed to the burgeoning populations in key countries such as China, India, and Japan. According to the Food and Agriculture Organization (FAO), China stands as the largest food producer globally, boasting an impressive output value of USD 1.56 trillion. The driving force behind China's robust food market is its steadily growing population. India, as the second most populous country in Asia, significantly contributes to the escalating consumption of food. Despite being one of the regions most impacted by the COVID-19 pandemic, the health crisis has spurred awareness about consuming healthy food products across Asia Pacific. The combination of a rising population and increased food consumption is poised to drive substantial demand for food antioxidants in the years to come.

North America holds the second-largest revenue share, accounting for over 30% in 2023. This substantial share is influenced by the lifestyles of consumers in countries such as the U.S. and Canada. With a significant portion of the population in North America being working professionals, there is a heavy reliance on prepared foods. Moreover, the challenging COVID-19 situation in the U.S. has prompted its population to adopt healthier diets to bolster their immunity against the virus. Recognizing the role of food antioxidants in preserving food for extended periods and preventing the formation of free radicals in the human body, the demand for food antioxidants in North America is expected to witness a significant surge in the coming years.
By Type
By Form
By Application
By Region
Chapter 1. Introduction
1.1. Research Objective
1.2. Scope of the Study
1.3. Definition
Chapter 2. Research Methodology
2.1. Research Approach
2.2. Data Sources
2.3. Assumptions & Limitations
Chapter 3. Executive Summary
3.1. Market Snapshot
Chapter 4. Market Variables and Scope
4.1. Introduction
4.2. Market Classification and Scope
4.3. Industry Value Chain Analysis
4.3.1. Raw Material Procurement Analysis
4.3.2. Sales and Distribution Type Analysis
4.3.3. Downstream Buyer Analysis
Chapter 5. COVID 19 Impact on Food Antioxidants Market
5.1. COVID-19 Landscape: Food Antioxidants Industry Impact
5.2. COVID 19 - Impact Assessment for the Industry
5.3. COVID 19 Impact: Global Major Government Policy
5.4. Market Trends and Opportunities in the COVID-19 Landscape
Chapter 6. Market Dynamics Analysis and Trends
6.1. Market Dynamics
6.1.1. Market Drivers
6.1.2. Market Restraints
6.1.3. Market Opportunities
6.2. Porter’s Five Forces Analysis
6.2.1. Bargaining power of suppliers
6.2.2. Bargaining power of buyers
6.2.3. Threat of substitute
6.2.4. Threat of new entrants
6.2.5. Degree of competition
Chapter 7. Competitive Landscape
7.1.1. Company Market Share/Positioning Analysis
7.1.2. Key Strategies Adopted by Players
7.1.3. Vendor Landscape
7.1.3.1. List of Suppliers
7.1.3.2. List of Buyers
Chapter 8. Global Food Antioxidants Market, By Type
8.1. Food Antioxidants Market, by Type, 2024-2033
8.1.1 Synthetic
8.1.1.1. Market Revenue and Forecast (2021-2033)
8.1.2. Natural
8.1.2.1. Market Revenue and Forecast (2021-2033)
Chapter 9. Global Food Antioxidants Market, By Form
9.1. Food Antioxidants Market, by Form, 2024-2033
9.1.1. Dry
9.1.1.1. Market Revenue and Forecast (2021-2033)
9.1.2. Liquid
9.1.2.1. Market Revenue and Forecast (2021-2033)
Chapter 10. Global Food Antioxidants Market, By Application
10.1. Food Antioxidants Market, by Application, 2024-2033
10.1.1. Meat & Poultry
10.1.1.1. Market Revenue and Forecast (2021-2033)
10.1.2. Bakery & Confectionery
10.1.2.1. Market Revenue and Forecast (2021-2033)
10.1.3. Fats & oil
10.1.3.1. Market Revenue and Forecast (2021-2033)
10.1.4. Fish
10.1.4.1. Market Revenue and Forecast (2021-2033)
10.1.5. Pet Food
10.1.5.1. Market Revenue and Forecast (2021-2033)
10.1.6. Others
10.1.6.1. Market Revenue and Forecast (2021-2033)
Chapter 11. Global Food Antioxidants Market, Regional Estimates and Trend Forecast
11.1. North America
11.1.1. Market Revenue and Forecast, by Type (2021-2033)
11.1.2. Market Revenue and Forecast, by Form (2021-2033)
11.1.3. Market Revenue and Forecast, by Application (2021-2033)
11.1.4. U.S.
11.1.4.1. Market Revenue and Forecast, by Type (2021-2033)
11.1.4.2. Market Revenue and Forecast, by Form (2021-2033)
11.1.4.3. Market Revenue and Forecast, by Application (2021-2033)
11.1.5. Rest of North America
11.1.5.1. Market Revenue and Forecast, by Type (2021-2033)
11.1.5.2. Market Revenue and Forecast, by Form (2021-2033)
11.1.5.3. Market Revenue and Forecast, by Application (2021-2033)
11.2. Europe
11.2.1. Market Revenue and Forecast, by Type (2021-2033)
11.2.2. Market Revenue and Forecast, by Form (2021-2033)
11.2.3. Market Revenue and Forecast, by Application (2021-2033)
11.2.4. UK
11.2.4.1. Market Revenue and Forecast, by Type (2021-2033)
11.2.4.2. Market Revenue and Forecast, by Form (2021-2033)
11.2.4.3. Market Revenue and Forecast, by Application (2021-2033)
11.2.5. Germany
11.2.5.1. Market Revenue and Forecast, by Type (2021-2033)
11.2.5.2. Market Revenue and Forecast, by Form (2021-2033)
11.2.5.3. Market Revenue and Forecast, by Application (2021-2033)
11.2.6. France
11.2.6.1. Market Revenue and Forecast, by Type (2021-2033)
11.2.6.2. Market Revenue and Forecast, by Form (2021-2033)
11.2.6.3. Market Revenue and Forecast, by Application (2021-2033)
11.2.7. Rest of Europe
11.2.7.1. Market Revenue and Forecast, by Type (2021-2033)
11.2.7.2. Market Revenue and Forecast, by Form (2021-2033)
11.2.7.3. Market Revenue and Forecast, by Application (2021-2033)
11.3. APAC
11.3.1. Market Revenue and Forecast, by Type (2021-2033)
11.3.2. Market Revenue and Forecast, by Form (2021-2033)
11.3.3. Market Revenue and Forecast, by Application (2021-2033)
11.3.4. India
11.3.4.1. Market Revenue and Forecast, by Type (2021-2033)
11.3.4.2. Market Revenue and Forecast, by Form (2021-2033)
11.3.4.3. Market Revenue and Forecast, by Application (2021-2033)
11.3.5. China
11.3.5.1. Market Revenue and Forecast, by Type (2021-2033)
11.3.5.2. Market Revenue and Forecast, by Form (2021-2033)
11.3.5.3. Market Revenue and Forecast, by Application (2021-2033)
11.3.6. Japan
11.3.6.1. Market Revenue and Forecast, by Type (2021-2033)
11.3.6.2. Market Revenue and Forecast, by Form (2021-2033)
11.3.6.3. Market Revenue and Forecast, by Application (2021-2033)
11.3.7. Rest of APAC
11.3.7.1. Market Revenue and Forecast, by Type (2021-2033)
11.3.7.2. Market Revenue and Forecast, by Form (2021-2033)
11.3.7.3. Market Revenue and Forecast, by Application (2021-2033)
11.4. MEA
11.4.1. Market Revenue and Forecast, by Type (2021-2033)
11.4.2. Market Revenue and Forecast, by Form (2021-2033)
11.4.3. Market Revenue and Forecast, by Application (2021-2033)
11.4.4. GCC
11.4.4.1. Market Revenue and Forecast, by Type (2021-2033)
11.4.4.2. Market Revenue and Forecast, by Form (2021-2033)
11.4.4.3. Market Revenue and Forecast, by Application (2021-2033)
11.4.5. North Africa
11.4.5.1. Market Revenue and Forecast, by Type (2021-2033)
11.4.5.2. Market Revenue and Forecast, by Form (2021-2033)
11.4.5.3. Market Revenue and Forecast, by Application (2021-2033)
11.4.6. South Africa
11.4.6.1. Market Revenue and Forecast, by Type (2021-2033)
11.4.6.2. Market Revenue and Forecast, by Form (2021-2033)
11.4.6.3. Market Revenue and Forecast, by Application (2021-2033)
11.4.7. Rest of MEA
11.4.7.1. Market Revenue and Forecast, by Type (2021-2033)
11.4.7.2. Market Revenue and Forecast, by Form (2021-2033)
11.4.7.3. Market Revenue and Forecast, by Application (2021-2033)
11.5. Latin America
11.5.1. Market Revenue and Forecast, by Type (2021-2033)
11.5.2. Market Revenue and Forecast, by Form (2021-2033)
11.5.3. Market Revenue and Forecast, by Application (2021-2033)
11.5.4. Brazil
11.5.4.1. Market Revenue and Forecast, by Type (2021-2033)
11.5.4.2. Market Revenue and Forecast, by Form (2021-2033)
11.5.4.3. Market Revenue and Forecast, by Application (2021-2033)
11.5.5. Rest of LATAM
11.5.5.1. Market Revenue and Forecast, by Type (2021-2033)
11.5.5.2. Market Revenue and Forecast, by Form (2021-2033)
11.5.5.3. Market Revenue and Forecast, by Application (2021-2033)
Chapter 12. Company Profiles
12.1. BASF SE
12.1.1. Company Overview
12.1.2. Product Offerings
12.1.3. Financial Performance
12.1.4. Recent Initiatives
12.2. Archer Daniels Midland Company (ADM)
12.2.1. Company Overview
12.2.2. Product Offerings
12.2.3. Financial Performance
12.2.4. Recent Initiatives
12.3. DuPont
12.3.1. Company Overview
12.3.2. Product Offerings
12.3.3. Financial Performance
12.3.4. Recent Initiatives
12.4. Kalsec Inc.
12.4.1. Company Overview
12.4.2. Product Offerings
12.4.3. Financial Performance
12.4.4. Recent Initiatives
12.5. Kemin Industries.
12.5.1. Company Overview
12.5.2. Product Offerings
12.5.3. Financial Performance
12.5.4. Recent Initiatives
12.6. Camlin Fine Sciences
12.6.1. Company Overview
12.6.2. Product Offerings
12.6.3. Financial Performance
12.6.4. Recent Initiatives
12.7. 3A Antioixidants.
12.7.1. Company Overview
12.7.2. Product Offerings
12.7.3. Financial Performance
12.7.4. Recent Initiatives
12.8. Eastman Chemical Company
12.8.1. Company Overview
12.8.2. Product Offerings
12.8.3. Financial Performance
12.8.4. Recent Initiatives
12.9. Frutarom Ltd.
12.9.1. Company Overview
12.9.2. Product Offerings
12.9.3. Financial Performance
12.9.4. Recent Initiatives
12.10. Barentz Group
12.10.1. Company Overview
12.10.2. Product Offerings
12.10.3. Financial Performance
12.10.4. Recent Initiatives
Chapter 13. Research Methodology
13.1. Primary Research
13.2. Secondary Research
13.3. Assumptions
Chapter 14. Appendix
14.1. About Us
14.2. Glossary of Terms
 Cross-segment Market Size and Analysis for
Mentioned Segments
 Additional Company Profiles (Upto 5 With No Cost)
 Additional Countries (Apart From Mentioned Countries)
 Country/Region-specific Report
 Go To Market Strategy
 Region Specific Market Dynamics
 Region Level Market Share
 Import Export Analysis
 Production Analysis
 Others