Forklift Market Size, Trends, Share, Growth | Report 2023-2032
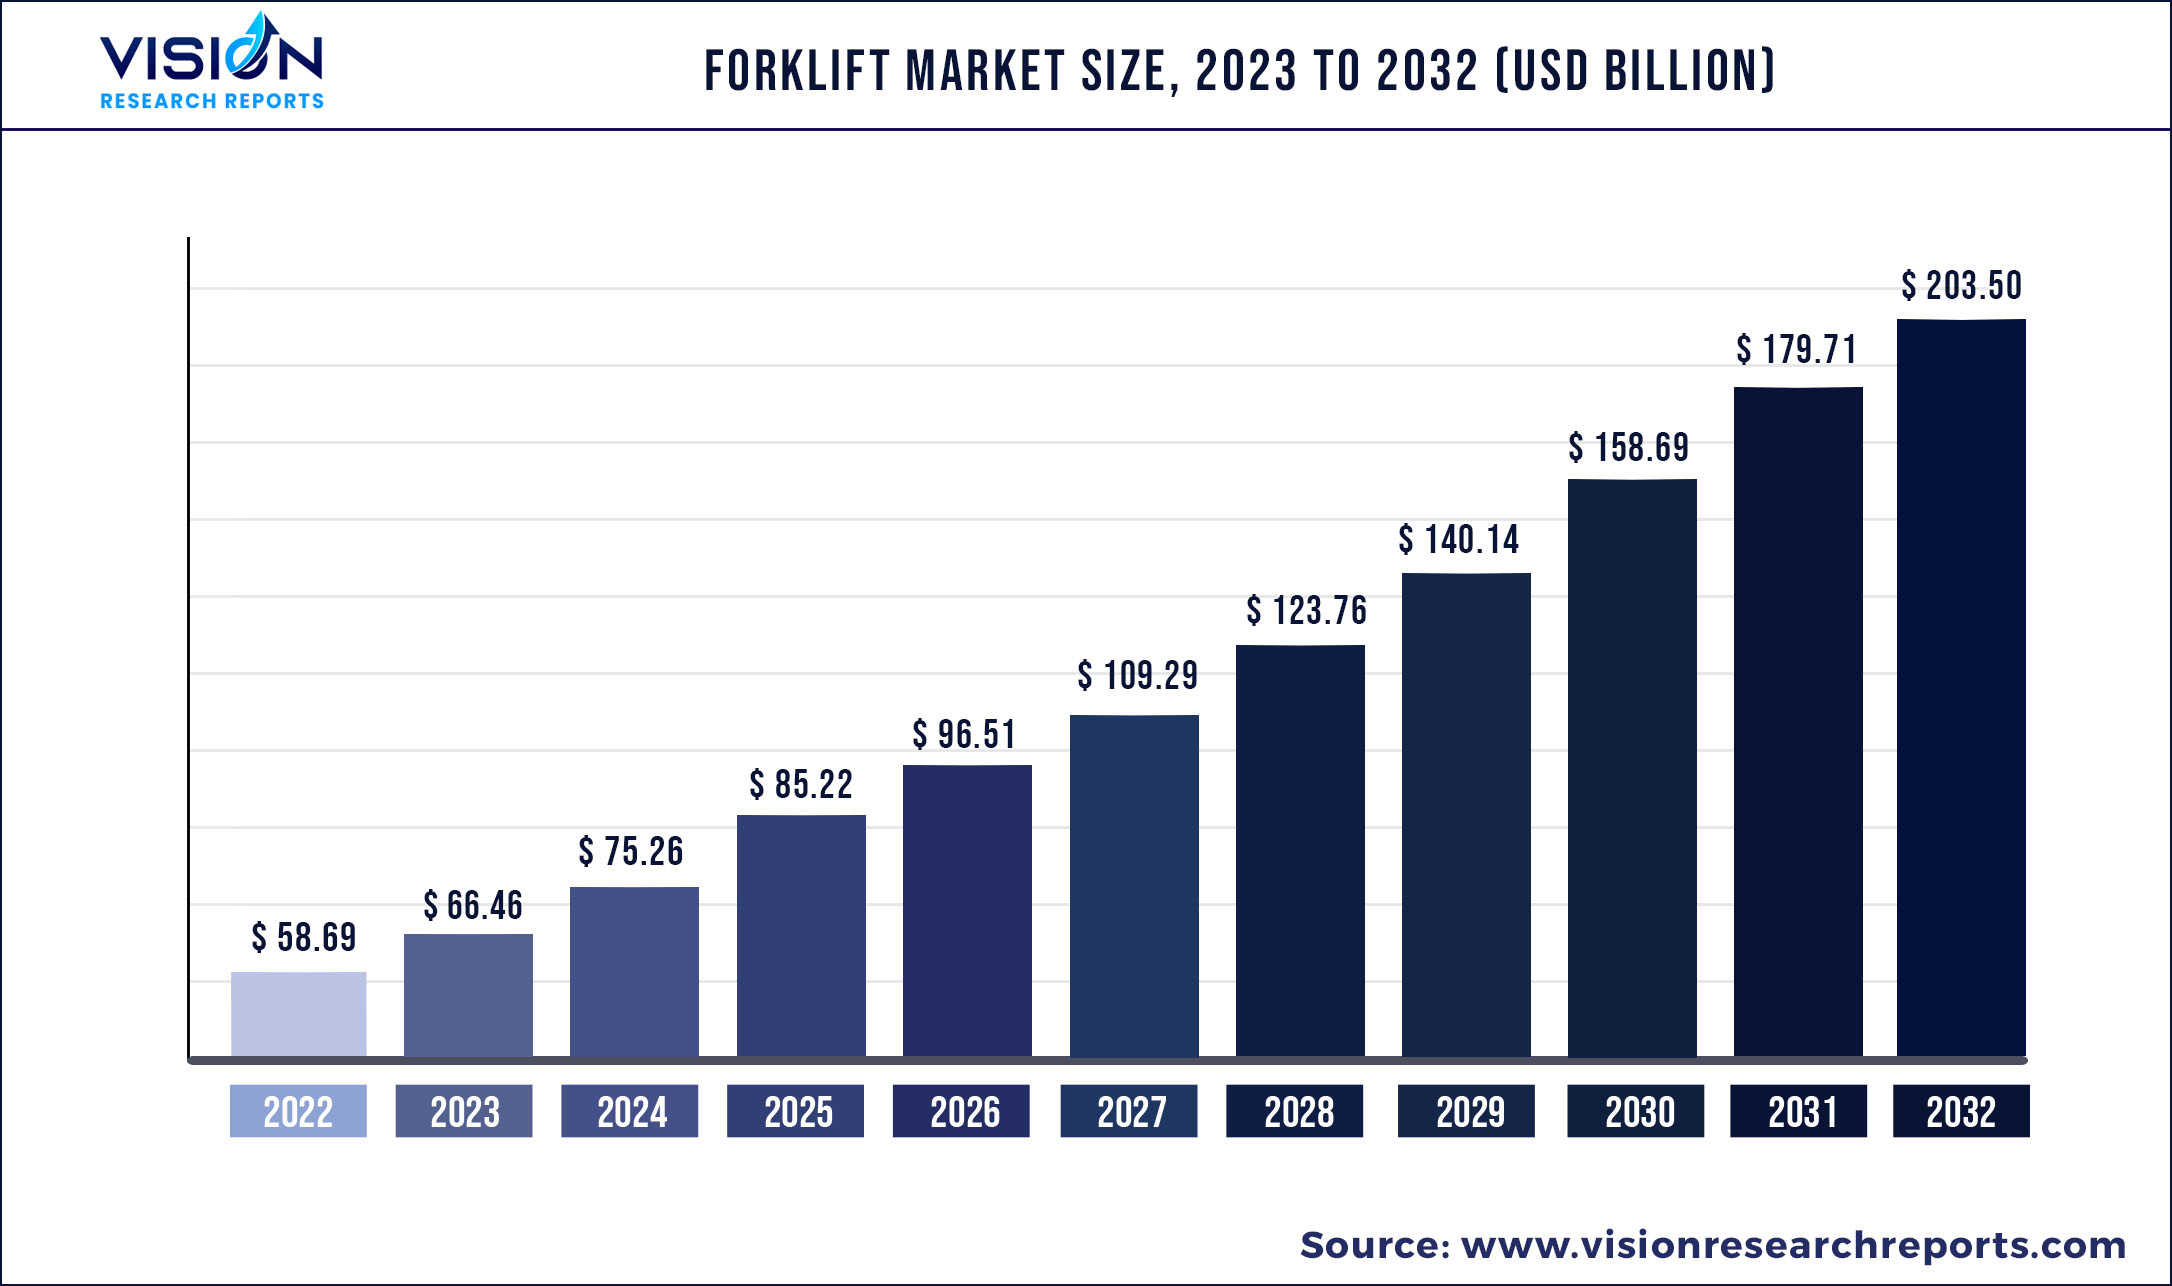
The global forklift market was estimated at USD 58.69 billion in 2022 and it is expected to surpass around USD 203.50 billion by 2032, poised to grow at a CAGR of 13.24% from 2023 to 2032.
Key Pointers
| Report Coverage | Details |
| Market Size in 2022 | USD 58.69 billion |
| Revenue Forecast by 2032 | USD 203.50 billion |
| Growth rate from 2023 to 2032 | CAGR of 13.24% |
| Base Year | 2022 |
| Forecast Period | 2023 to 2032 |
| Regions Covered | North America, Europe, Asia Pacific, Latin America, Middle East & Africa |
| Companies Covered | Anhui Heli Co., Ltd.; CLARK; Crown Equipment Corporation; Doosan Corporation; Hangcha; Hyster-Yale Materials Handling, Inc.; Jungheinrich AG; KION Group AG; Komatsu Ltd.; Mitsubishi Logisnext Co., Ltd.; Toyota Material Handling |
The burgeoning global e-commerce sector and changes in warehouse management over the past few years have increased demand for forklifts to handle heavy loads and maneuver through tight spaces. These are the prominent factors contributing to the market’s expansion. The demand for forklifts that can operate in challenging terrain and transport heavy construction supplies over long distances is also increasing as a result of the expansion of building projects around the world.
The thriving e-commerce industry is leading to an increase in the number of warehouses and the need to efficiently manage the supply chain in warehouses. Moreover, warehouse owners focus on increasing transparency, lowering operational costs, and enhancing productivity within the warehouse and operational plants. These aspects are expected to increase demand for forklifts such as stand-up riders and narrow-aisle forklifts that offer high operation accuracy and better navigation in narrow aisles, tiers, and mezzanines. The growing traction of electric forklifts among recycling center owners and chemical manufacturers is anticipated to encourage the forklift industry’s growth.
An electric forklift is operated on batteries and offers benefits such as low maintenance, lesser vibration, low noise, and low weight, providing employees convenience while performing fieldwork. Original Equipment Manufacturers (OEMs) such as Godrej & Boyce, Toyota Material Handling, and Guangxi LiuGong Machinery Co., Ltd. are concentrating on developing and designing products that suit the changing requirements of dockyards and warehouse operations.
However, the large amount of expenditure associated with maintenance and fluctuating prices of raw materials may stand as a challenge for market growth. In addition, stringent emission regulations could hamper growth to a certain extent. The pandemic also adversely impacted warehouse activities and construction and manufacturing in 2020. The spiking rate of COVID-19 infections and the following lockdowns across the globe caused an unexpected downturn in manufacturing activities.
Regional Insights
Asia Pacific dominated the forklift market and accounted for the largest revenue share of over 47.04% in 2022. The market is expected to grow steadily during the forecast period. The growth can be attributed to the rising inclination of manufacturers toward plant automation. Additionally, forklifts help streamline supply chain distribution activities while also enhancing the operational efficiency and workflow of production processes. Several regional players are focusing on the introduction of new products to attract new customers and improve their customer base.
In Europe, the market is expected to account for a significant revenue share in the global market due to rapid urbanization and rising demand from chemical and food manufacturers. Additionally, rising construction activities in countries such as the U.K., Germany, and France are driving the demand for forklifts for use across operations such as unloading pallets, steel joists, and construction materials.
Forklift Market Segmentations:
| By Class | By Power Source |
|
Class 1 Class 2 Class 3 Class 4/5 |
Internal Combustion Engine Electric |
Chapter 1. Introduction
1.1. Research Objective
1.2. Scope of the Study
1.3. Definition
Chapter 2. Research Methodology
2.1. Research Approach
2.2. Data Sources
2.3. Assumptions & Limitations
Chapter 3. Executive Summary
3.1. Market Snapshot
Chapter 4. Market Variables and Scope
4.1. Introduction
4.2. Market Classification and Scope
4.3. Industry Value Chain Analysis
4.3.1. Raw Material Procurement Analysis
4.3.2. Sales and Distribution Channel Analysis
4.3.3. Downstream Buyer Analysis
Chapter 5. COVID 19 Impact on Forklift Market
5.1. COVID-19 Landscape: Forklift Industry Impact
5.2. COVID 19 - Impact Assessment for the Industry
5.3. COVID 19 Impact: Global Major Government Policy
5.4. Market Trends and Opportunities in the COVID-19 Landscape
Chapter 6. Market Dynamics Analysis and Trends
6.1. Market Dynamics
6.1.1. Market Drivers
6.1.2. Market Restraints
6.1.3. Market Opportunities
6.2. Porter’s Five Forces Analysis
6.2.1. Bargaining power of suppliers
6.2.2. Bargaining power of buyers
6.2.3. Threat of substitute
6.2.4. Threat of new entrants
6.2.5. Degree of competition
Chapter 7. Competitive Landscape
7.1.1. Company Market Share/Positioning Analysis
7.1.2. Key Strategies Adopted by Players
7.1.3. Vendor Landscape
7.1.3.1. List of Suppliers
7.1.3.2. List of Buyers
Chapter 8. Global Forklift Market, By Class 1
8.1. Forklift Market, by Class, 2023-2032
8.1.1. Class 1
8.1.1.1. Market Revenue and Forecast (2020-2032)
8.1.2. Class 2
8.1.2.1. Market Revenue and Forecast (2020-2032)
8.1.3. Class 3
8.1.3.1. Market Revenue and Forecast (2020-2032)
8.1.4. Class 4/5
8.1.4.1. Market Revenue and Forecast (2020-2032)
Chapter 9. Global Forklift Market, By Power Source
9.1. Forklift Market, by Power Source, 2023-2032
9.1.1. Internal Combustion Engine
9.1.1.1. Market Revenue and Forecast (2020-2032)
9.1.2. Electric
9.1.2.1. Market Revenue and Forecast (2020-2032)
Chapter 10. Global Forklift Market, Regional Estimates and Trend Forecast
10.1. North America
10.1.1. Market Revenue and Forecast, by Class (2020-2032)
10.1.2. Market Revenue and Forecast, by Power Source (2020-2032)
10.1.3. U.S.
10.1.3.1. Market Revenue and Forecast, by Class (2020-2032)
10.1.3.2. Market Revenue and Forecast, by Power Source (2020-2032)
10.1.4. Rest of North America
10.1.4.1. Market Revenue and Forecast, by Class (2020-2032)
10.1.4.2. Market Revenue and Forecast, by Power Source (2020-2032)
10.2. Europe
10.2.1. Market Revenue and Forecast, by Class (2020-2032)
10.2.2. Market Revenue and Forecast, by Power Source (2020-2032)
10.2.3. UK
10.2.3.1. Market Revenue and Forecast, by Class (2020-2032)
10.2.3.2. Market Revenue and Forecast, by Power Source (2020-2032)
10.2.4. Germany
10.2.4.1. Market Revenue and Forecast, by Class (2020-2032)
10.2.4.2. Market Revenue and Forecast, by Power Source (2020-2032)
10.2.5. France
10.2.5.1. Market Revenue and Forecast, by Class (2020-2032)
10.2.5.2. Market Revenue and Forecast, by Power Source (2020-2032)
10.2.6. Rest of Europe
10.2.6.1. Market Revenue and Forecast, by Class (2020-2032)
10.2.6.2. Market Revenue and Forecast, by Power Source (2020-2032)
10.3. APAC
10.3.1. Market Revenue and Forecast, by Class (2020-2032)
10.3.2. Market Revenue and Forecast, by Power Source (2020-2032)
10.3.3. India
10.3.3.1. Market Revenue and Forecast, by Class (2020-2032)
10.3.3.2. Market Revenue and Forecast, by Power Source (2020-2032)
10.3.4. China
10.3.4.1. Market Revenue and Forecast, by Class (2020-2032)
10.3.4.2. Market Revenue and Forecast, by Power Source (2020-2032)
10.3.5. Japan
10.3.5.1. Market Revenue and Forecast, by Class (2020-2032)
10.3.5.2. Market Revenue and Forecast, by Power Source (2020-2032)
10.3.6. Rest of APAC
10.3.6.1. Market Revenue and Forecast, by Class (2020-2032)
10.3.6.2. Market Revenue and Forecast, by Power Source (2020-2032)
10.4. MEA
10.4.1. Market Revenue and Forecast, by Class (2020-2032)
10.4.2. Market Revenue and Forecast, by Power Source (2020-2032)
10.4.3. GCC
10.4.3.1. Market Revenue and Forecast, by Class (2020-2032)
10.4.3.2. Market Revenue and Forecast, by Power Source (2020-2032)
10.4.4. North Africa
10.4.4.1. Market Revenue and Forecast, by Class (2020-2032)
10.4.4.2. Market Revenue and Forecast, by Power Source (2020-2032)
10.4.5. South Africa
10.4.5.1. Market Revenue and Forecast, by Class (2020-2032)
10.4.5.2. Market Revenue and Forecast, by Power Source (2020-2032)
10.4.6. Rest of MEA
10.4.6.1. Market Revenue and Forecast, by Class (2020-2032)
10.4.6.2. Market Revenue and Forecast, by Power Source (2020-2032)
10.5. Latin America
10.5.1. Market Revenue and Forecast, by Class (2020-2032)
10.5.2. Market Revenue and Forecast, by Power Source (2020-2032)
10.5.3. Brazil
10.5.3.1. Market Revenue and Forecast, by Class (2020-2032)
10.5.3.2. Market Revenue and Forecast, by Power Source (2020-2032)
10.5.4. Rest of LATAM
10.5.4.1. Market Revenue and Forecast, by Class (2020-2032)
10.5.4.2. Market Revenue and Forecast, by Power Source (2020-2032)
Chapter 11. Company Profiles
11.1. Anhui Heli Co., Ltd.
11.1.1. Company Overview
11.1.2. Product Offerings
11.1.3. Financial Performance
11.1.4. Recent Initiatives
11.2. CLARK
11.2.1. Company Overview
11.2.2. Product Offerings
11.2.3. Financial Performance
11.2.4. Recent Initiatives
11.3. Crown Equipment Corporation
11.3.1. Company Overview
11.3.2. Product Offerings
11.3.3. Financial Performance
11.3.4. Recent Initiatives
11.4. Doosan Corporation
11.4.1. Company Overview
11.4.2. Product Offerings
11.4.3. Financial Performance
11.4.4. LTE Scientific
11.5. Hangcha
11.5.1. Company Overview
11.5.2. Product Offerings
11.5.3. Financial Performance
11.5.4. Recent Initiatives
11.6. Hyster-Yale Materials Handling, Inc.
11.6.1. Company Overview
11.6.2. Product Offerings
11.6.3. Financial Performance
11.6.4. Recent Initiatives
11.7. Jungheinrich AG
11.7.1. Company Overview
11.7.2. Product Offerings
11.7.3. Financial Performance
11.7.4. Recent Initiatives
11.8. KION Group AG
11.8.1. Company Overview
11.8.2. Product Offerings
11.8.3. Financial Performance
11.8.4. Recent Initiatives
11.9. Komatsu Ltd.
11.9.1. Company Overview
11.9.2. Product Offerings
11.9.3. Financial Performance
11.9.4. Recent Initiatives
11.10. Mitsubishi Logisnext Co., Ltd.
11.10.1. Company Overview
11.10.2. Product Offerings
11.10.3. Financial Performance
11.10.4. Recent Initiatives
Chapter 12. Research Methodology
12.1. Primary Research
12.2. Secondary Research
12.3. Assumptions
Chapter 13. Appendix
13.1. About Us
13.2. Glossary of Terms
 Cross-segment Market Size and Analysis for
Mentioned Segments
Additional Company Profiles (Upto 5 With No Cost)
Additional Countries (Apart From Mentioned Countries)
Country/Region-specific Report
Go To Market Strategy
Region Specific Market DynamicsRegion Level Market Share Import Export AnalysisProduction AnalysisOthers
Cross-segment Market Size and Analysis for
Mentioned Segments
Additional Company Profiles (Upto 5 With No Cost)
Additional Countries (Apart From Mentioned Countries)
Country/Region-specific Report
Go To Market Strategy
Region Specific Market DynamicsRegion Level Market Share Import Export AnalysisProduction AnalysisOthers