Fructooligosaccharides (FOS) Market Size, Growth, Trends | Report 2023-2032
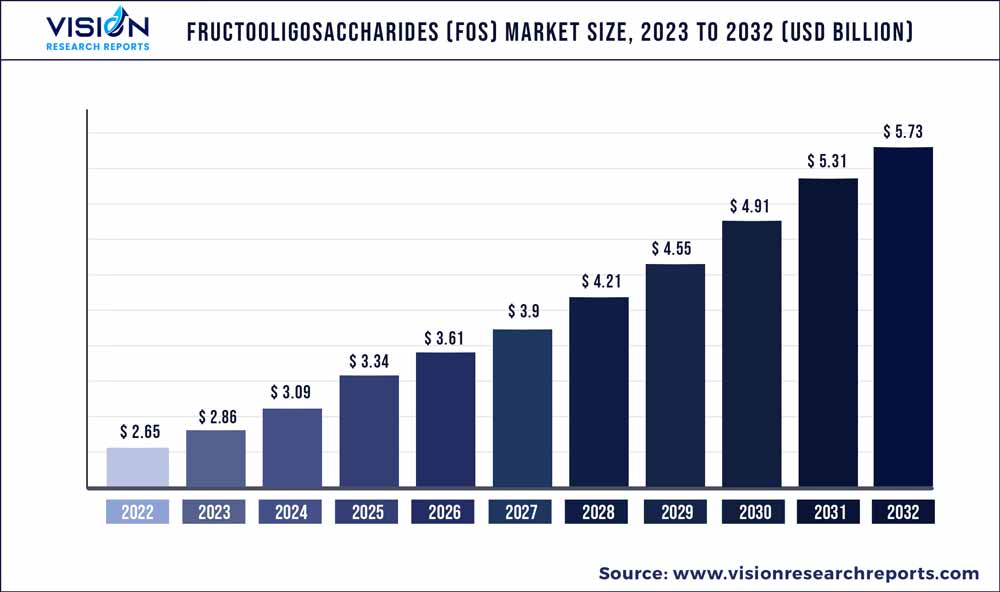
The global fructooligosaccharides (FOS) market was surpassed at USD 2.65 billion in 2022 and is expected to hit around USD 5.73 billion by 2032, growing at a CAGR of 8.02% from 2023 to 2032.
Key Pointers
Report Scope of the Fructooligosaccharides (FOS) Market
| Report Coverage | Details |
| Market Size in 2022 | USD 2.65 billion |
| Revenue Forecast by 2032 | USD 5.73 billion |
| Growth rate from 2023 to 2032 | CAGR of 8.02% |
| Base Year | 2022 |
| Forecast Period | 2023 to 2032 |
| Market Analysis (Terms Used) | Value (US$ Million/Billion) or (Volume/Units) |
| Regions Covered | North America, Europe, Asia Pacific, Latin America, Middle East & Africa |
| Companies Covered | Beneo, COSUCRA, Sensus, Galam, Ingredion, Meiji Holdings Co., Ltd., Tata Chemicals, Baolingbao Biological Co., Ltd., SAMYANG CORPORATION, Shandong Bailong Chuangyuan Bio-tech Co., Ltd., New Francisco Biotechnology Corporation Limited |
Increasing consumption of functional food in North America and Europe is expected to drive the market over the next eight years.
Rising use of fructooligosaccharides (FOS) combinations with probiotic strains including synbiotics in products such as bakery, chocolates, fat reduction creams and drinking yogurts is expected to have a positive impact on the market over the next seven years. In addition, rising demand for dietary products in the Asia Pacific is expected to propel industry growth over the forecast period.
Increasing consumer awareness regarding the occurrence of chronic diseases such as rickets and diabetes is expected to augment product needs over the projected period. The introduction of novel manufacturing techniques using highly efficient purification systems, recombinant enzymes, new substrates, and enzyme engineering are being used to reduce costs. This is expected to increase the market penetration of the product over the forecast period.
Source Insights
Chicory as a source of FOS dominated the market with a revenue share of more than 66.02% in 2022, as chicory is easy to extract, has high inulin content, low-calorie content, and is safe & efficient to use in versatile applications
Chicory root is a well-known source of fructooligosaccharides. Chicory root contains inulin, a type of soluble fiber that is not digested in the small intestine but instead is fermented by beneficial bacteria in the large intestine, producing FOS as a byproduct. In fact, cChicory root is one of the richest dietary sources of inulin, with concentrations ranging from 15-20% by weight.
Some other sources of fructooligosaccharides are banana, wheat, leeks, barley, onions, blue agave, garlic, and asparagus. In addition, Sucrose can be used as a starting material to produce FOS through a process called enzymatic hydrolysis. In this process, the sucrose is broken down into its component monosaccharides, glucose and fructose, by the action of enzymes. The resulting mixture of glucose and fructose can then be used as a substrate for the production of FOS.
Form Insights
Liquid form dominated the market with a revenue share of over 60.1% in 2022. Liquid fructooligosaccharides (FOS) are commonly used because they are easy to incorporate into a wide range of food and beverage products. Their syrupy texture makes them easily dissolvable in water and other liquids, which allows for a homogeneous mixture.
In addition to their ease of use, liquid FOS have has several other benefits that make them attractive to food manufacturers. For example, they are a natural, plant-based ingredient that can be used to replace traditional sweeteners, such as sugar and high fructose corn syrup. They also have a lower glycemic index than sugar, which means they do not cause a sharp spike in blood sugar levels.
Powder fructooligosaccharides are a form of FOS that is typically derived from natural sources such as chicory root, Jerusalem artichoke, or agave. The powder form is created by extracting FOS from these sources, purifying and concentrating them, and then drying the resulting liquid into a fine powder.
Application Insights
Infant Formulation application dominated the substrate segment with a revenue share of over 42.05% in 2022, because FOS are is a natural prebiotic ingredient that can help support the growth and activity of beneficial bacteria in the infant's gut. This is important because the gut microbiota plays a critical role in the development of the infant's immune system, digestive health, and overall well-being.
Furthermore, Fructooligosaccharides (FOS) are used in food and beverages for a variety of reasons, including as a natural sweetener, a prebiotic ingredient, and a source of dietary fiber. As a natural sweetener, FOS can be used to replace traditional sweeteners like sugar or high fructose corn syrup. It has a sweet taste but is lower in calories and has a lower glycemic index than sugar, which can help manage blood sugar levels.
FOS are used in dietary supplements for their prebiotic properties and potential health benefits. As a prebiotic ingredient, FOS serves as food for beneficial bacteria in the gut. This can help promote the growth and activity of these bacteria, which can have a range of positive effects on digestive health, immune function, and overall well-being. FOS has been shown to increase the population of Bifidobacteria in the gut, which is associated with various health benefits.
Regional Insights
Europe region dominated the market with a revenue share of more than 29.07% in 2022. This is due to several factors, including the growing consumer demand for natural, healthier food and beverage products, as well as the increasing awareness of the potential health benefits of FOS. In addition, the regulatory environment in Europe is supportive of the use of FOS in food and dietary supplements. The European Food Safety Authority (EFSA) has evaluated the safety and efficacy of FOS and has approved its use as a food ingredient and as a source of dietary fiber.
North America product demand was estimated at 85.21 kilotons in 2022. Dairy products especially beverages account for the major market in the U.S. functional food & beverage industry. Rising concern regarding aging, heart health, weight management, gut health, and immune function is likely to augment product demand in the U.S. over the next eight years.
The U.S., China, Japan, and Germany dominated the market over the past few years owing to increased demand from from the dietary supplement applications. In East Asia, Europe, and North America, the product is primarily employed as a dietary fiber and nutritional supplement.
Fructooligosaccharides (FOS) Market Segmentations:
By Source
By Form
By Application
By Regional
Chapter 1. Introduction
1.1. Research Objective
1.2. Scope of the Study
1.3. Definition
Chapter 2. Research Methodology
2.1. Research Approach
2.2. Data Sources
2.3. Assumptions & Limitations
Chapter 3. Executive Summary
3.1. Market Snapshot
Chapter 4. Market Variables and Scope
4.1. Introduction
4.2. Market Classification and Scope
4.3. Industry Value Chain Analysis
4.3.1. Raw Material Procurement Analysis
4.3.2. Sales and Distribution Source Analysis
4.3.3. Downstream Buyer Analysis
Chapter 5. COVID 19 Impact on Fructooligosaccharides (FOS) Market
5.1. COVID-19 Landscape: Fructooligosaccharides (FOS) Industry Impact
5.2. COVID 19 - Impact Assessment for the Industry
5.3. COVID 19 Impact: Global Major Government Policy
5.4. Market Trends and Opportunities in the COVID-19 Landscape
Chapter 6. Market Dynamics Analysis and Trends
6.1. Market Dynamics
6.1.1. Market Drivers
6.1.2. Market Restraints
6.1.3. Market Opportunities
6.2. Porter’s Five Forces Analysis
6.2.1. Bargaining power of suppliers
6.2.2. Bargaining power of buyers
6.2.3. Threat of substitute
6.2.4. Threat of new entrants
6.2.5. Degree of competition
Chapter 7. Competitive Landscape
7.1.1. Company Market Share/Positioning Analysis
7.1.2. Key Strategies Adopted by Players
7.1.3. Vendor Landscape
7.1.3.1. List of Suppliers
7.1.3.2. List of Buyers
Chapter 8. Global Fructooligosaccharides (FOS) Market, By Source
8.1. Fructooligosaccharides (FOS) Market, by Source, 2023-2032
8.1.1 Sucrose
8.1.1.1. Market Revenue and Forecast (2020-2032)
8.1.2. Chicory
8.1.2.1. Market Revenue and Forecast (2020-2032)
Chapter 9. Global Fructooligosaccharides (FOS) Market, By Form
9.1. Fructooligosaccharides (FOS) Market, by Form, 2023-2032
9.1.1. Liquid
9.1.1.1. Market Revenue and Forecast (2020-2032)
9.1.2. Powder
9.1.2.1. Market Revenue and Forecast (2020-2032)
Chapter 10. Global Fructooligosaccharides (FOS) Market, By Application
10.1. Fructooligosaccharides (FOS) Market, by Application, 2023-2032
10.1.1. Infant Formulation
10.1.1.1. Market Revenue and Forecast (2020-2032)
10.1.2. Food & Beverages
10.1.2.1. Market Revenue and Forecast (2020-2032)
10.1.3. Dietary Supplements
10.1.3.1. Market Revenue and Forecast (2020-2032)
10.1.4. Pet/Animal Feed
10.1.4.1. Market Revenue and Forecast (2020-2032)
Chapter 11. Global Fructooligosaccharides (FOS) Market, Regional Estimates and Trend Forecast
11.1. North America
11.1.1. Market Revenue and Forecast, by Source (2020-2032)
11.1.2. Market Revenue and Forecast, by Form (2020-2032)
11.1.3. Market Revenue and Forecast, by Application (2020-2032)
11.1.4. U.S.
11.1.4.1. Market Revenue and Forecast, by Source (2020-2032)
11.1.4.2. Market Revenue and Forecast, by Form (2020-2032)
11.1.4.3. Market Revenue and Forecast, by Application (2020-2032)
11.1.5. Rest of North America
11.1.5.1. Market Revenue and Forecast, by Source (2020-2032)
11.1.5.2. Market Revenue and Forecast, by Form (2020-2032)
11.1.5.3. Market Revenue and Forecast, by Application (2020-2032)
11.2. Europe
11.2.1. Market Revenue and Forecast, by Source (2020-2032)
11.2.2. Market Revenue and Forecast, by Form (2020-2032)
11.2.3. Market Revenue and Forecast, by Application (2020-2032)
11.2.4. UK
11.2.4.1. Market Revenue and Forecast, by Source (2020-2032)
11.2.4.2. Market Revenue and Forecast, by Form (2020-2032)
11.2.4.3. Market Revenue and Forecast, by Application (2020-2032)
11.2.5. Germany
11.2.5.1. Market Revenue and Forecast, by Source (2020-2032)
11.2.5.2. Market Revenue and Forecast, by Form (2020-2032)
11.2.5.3. Market Revenue and Forecast, by Application (2020-2032)
11.2.6. France
11.2.6.1. Market Revenue and Forecast, by Source (2020-2032)
11.2.6.2. Market Revenue and Forecast, by Form (2020-2032)
11.2.6.3. Market Revenue and Forecast, by Application (2020-2032)
11.2.7. Rest of Europe
11.2.7.1. Market Revenue and Forecast, by Source (2020-2032)
11.2.7.2. Market Revenue and Forecast, by Form (2020-2032)
11.2.7.3. Market Revenue and Forecast, by Application (2020-2032)
11.3. APAC
11.3.1. Market Revenue and Forecast, by Source (2020-2032)
11.3.2. Market Revenue and Forecast, by Form (2020-2032)
11.3.3. Market Revenue and Forecast, by Application (2020-2032)
11.3.4. India
11.3.4.1. Market Revenue and Forecast, by Source (2020-2032)
11.3.4.2. Market Revenue and Forecast, by Form (2020-2032)
11.3.4.3. Market Revenue and Forecast, by Application (2020-2032)
11.3.5. China
11.3.5.1. Market Revenue and Forecast, by Source (2020-2032)
11.3.5.2. Market Revenue and Forecast, by Form (2020-2032)
11.3.5.3. Market Revenue and Forecast, by Application (2020-2032)
11.3.6. Japan
11.3.6.1. Market Revenue and Forecast, by Source (2020-2032)
11.3.6.2. Market Revenue and Forecast, by Form (2020-2032)
11.3.6.3. Market Revenue and Forecast, by Application (2020-2032)
11.3.7. Rest of APAC
11.3.7.1. Market Revenue and Forecast, by Source (2020-2032)
11.3.7.2. Market Revenue and Forecast, by Form (2020-2032)
11.3.7.3. Market Revenue and Forecast, by Application (2020-2032)
11.4. MEA
11.4.1. Market Revenue and Forecast, by Source (2020-2032)
11.4.2. Market Revenue and Forecast, by Form (2020-2032)
11.4.3. Market Revenue and Forecast, by Application (2020-2032)
11.4.4. GCC
11.4.4.1. Market Revenue and Forecast, by Source (2020-2032)
11.4.4.2. Market Revenue and Forecast, by Form (2020-2032)
11.4.4.3. Market Revenue and Forecast, by Application (2020-2032)
11.4.5. North Africa
11.4.5.1. Market Revenue and Forecast, by Source (2020-2032)
11.4.5.2. Market Revenue and Forecast, by Form (2020-2032)
11.4.5.3. Market Revenue and Forecast, by Application (2020-2032)
11.4.6. South Africa
11.4.6.1. Market Revenue and Forecast, by Source (2020-2032)
11.4.6.2. Market Revenue and Forecast, by Form (2020-2032)
11.4.6.3. Market Revenue and Forecast, by Application (2020-2032)
11.4.7. Rest of MEA
11.4.7.1. Market Revenue and Forecast, by Source (2020-2032)
11.4.7.2. Market Revenue and Forecast, by Form (2020-2032)
11.4.7.3. Market Revenue and Forecast, by Application (2020-2032)
11.5. Latin America
11.5.1. Market Revenue and Forecast, by Source (2020-2032)
11.5.2. Market Revenue and Forecast, by Form (2020-2032)
11.5.3. Market Revenue and Forecast, by Application (2020-2032)
11.5.4. Brazil
11.5.4.1. Market Revenue and Forecast, by Source (2020-2032)
11.5.4.2. Market Revenue and Forecast, by Form (2020-2032)
11.5.4.3. Market Revenue and Forecast, by Application (2020-2032)
11.5.5. Rest of LATAM
11.5.5.1. Market Revenue and Forecast, by Source (2020-2032)
11.5.5.2. Market Revenue and Forecast, by Form (2020-2032)
11.5.5.3. Market Revenue and Forecast, by Application (2020-2032)
Chapter 12. Company Profiles
12.1. Beneo
12.1.1. Company Overview
12.1.2. Product Offerings
12.1.3. Financial Performance
12.1.4. Recent Initiatives
12.2. COSUCRA
12.2.1. Company Overview
12.2.2. Product Offerings
12.2.3. Financial Performance
12.2.4. Recent Initiatives
12.3. Sensus
12.3.1. Company Overview
12.3.2. Product Offerings
12.3.3. Financial Performance
12.3.4. Recent Initiatives
12.4. Galam
12.4.1. Company Overview
12.4.2. Product Offerings
12.4.3. Financial Performance
12.4.4. Recent Initiatives
12.5. Ingredion
12.5.1. Company Overview
12.5.2. Product Offerings
12.5.3. Financial Performance
12.5.4. Recent Initiatives
12.6. Meiji Holdings Co., Ltd.
12.6.1. Company Overview
12.6.2. Product Offerings
12.6.3. Financial Performance
12.6.4. Recent Initiatives
12.7. Tata Chemicals
12.7.1. Company Overview
12.7.2. Product Offerings
12.7.3. Financial Performance
12.7.4. Recent Initiatives
12.8. Baolingbao Biological Co., Ltd.
12.8.1. Company Overview
12.8.2. Product Offerings
12.8.3. Financial Performance
12.8.4. Recent Initiatives
12.9. SAMYANG CORPORATION
12.9.1. Company Overview
12.9.2. Product Offerings
12.9.3. Financial Performance
12.9.4. Recent Initiatives
12.10. Shandong Bailong Chuangyuan Bio-tech Co., Ltd.
12.10.1. Company Overview
12.10.2. Product Offerings
12.10.3. Financial Performance
12.10.4. Recent Initiatives
Chapter 13. Research Methodology
13.1. Primary Research
13.2. Secondary Research
13.3. Assumptions
Chapter 14. Appendix
14.1. About Us
14.2. Glossary of Terms
 Cross-segment Market Size and Analysis for
Mentioned Segments
Additional Company Profiles (Upto 5 With No Cost)
Additional Countries (Apart From Mentioned Countries)
Country/Region-specific Report
Go To Market Strategy
Region Specific Market DynamicsRegion Level Market Share Import Export AnalysisProduction AnalysisOthers
Cross-segment Market Size and Analysis for
Mentioned Segments
Additional Company Profiles (Upto 5 With No Cost)
Additional Countries (Apart From Mentioned Countries)
Country/Region-specific Report
Go To Market Strategy
Region Specific Market DynamicsRegion Level Market Share Import Export AnalysisProduction AnalysisOthers