Generative AI Market Size, Growth, Trends | Report 2023-2032
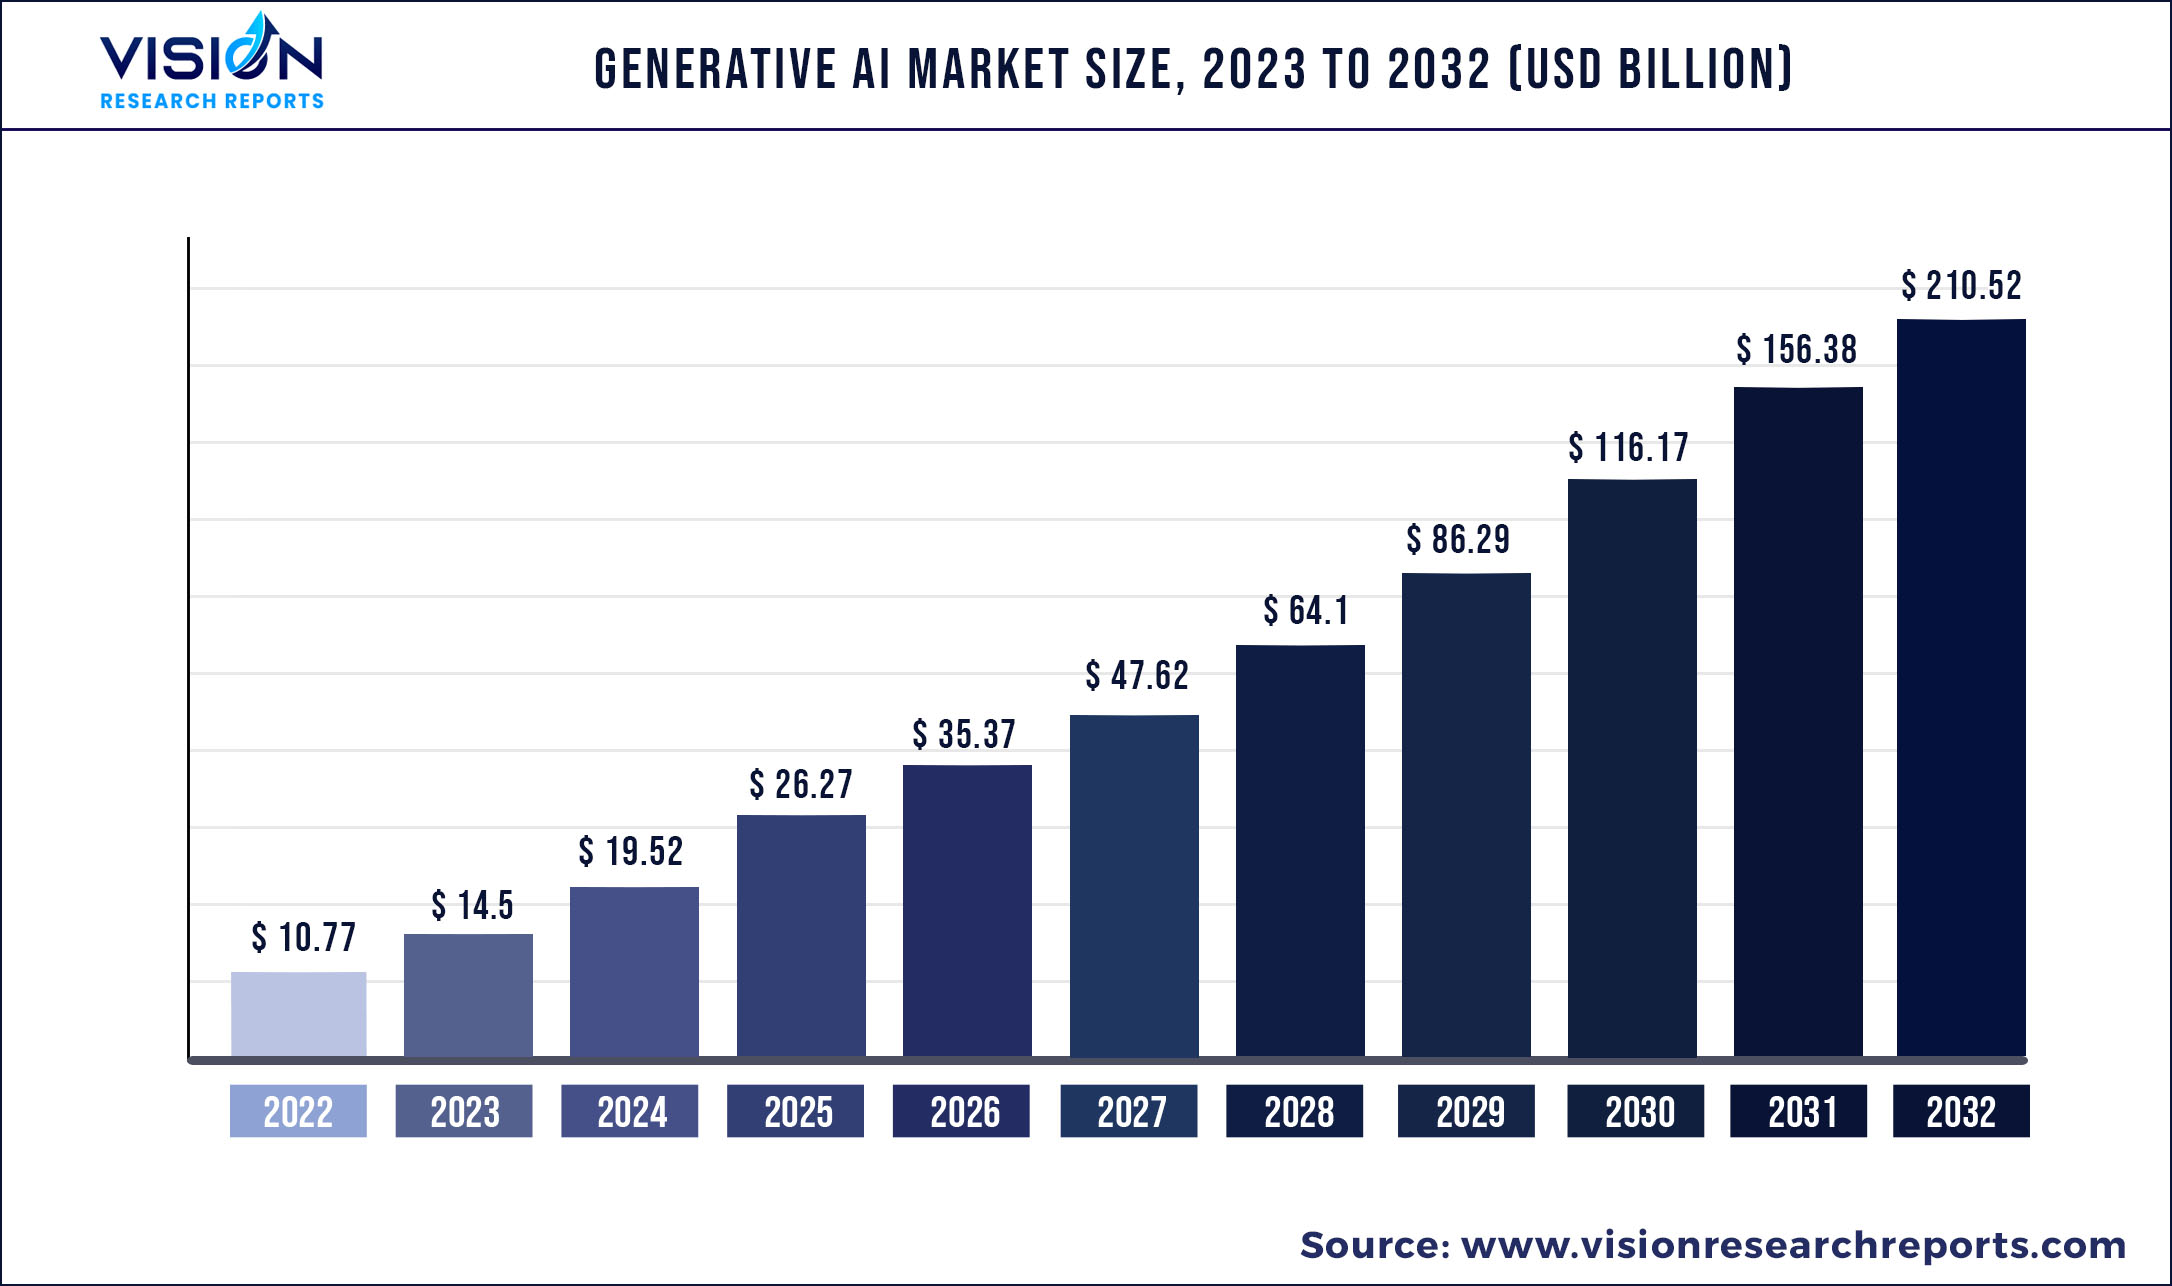
The global generative AI market was surpassed at USD 10.77 billion in 2022 and is expected to hit around USD 210.52 billion by 2032, growing at a CAGR of 34.62% from 2023 to 2032.
Key Pointers
Report Scope of the Generative AI Market
| Report Coverage | Details |
| Market Size in 2022 | USD 10.77 billion |
| Revenue Forecast by 2032 | USD 210.52 billion |
| Growth rate from 2023 to 2032 | CAGR of 34.62% |
| Base Year | 2022 |
| Forecast Period | 2023 to 2032 |
| Regions Covered | North America, Europe, Asia Pacific, Latin America, Middle East & Africa |
| Companies Covered | Synthesia; MOSTLY AI Inc.; Genie AI Ltd; Amazon Web Services, Inc.; IBM; Google LLC; Microsoft; Adobe, Rephrase.ai; D-ID |
Factors such as the rising applications of technologies such as super-resolution, text-to-image conversion, & text-to-video conversion and growing demand to modernize workflow across industries are driving the demand for generative AI applications among industries. The COVID-19 pandemic had a positive impact on the generative AI market as businesses shifted to the online work model, increasing digitalization across industries. As per IBM’s Global AI Adoption Index 2022 report, over 53% of IT professionals commented that they have accelerated the roll-out of Artificial Intelligence (AI) in the last 24 months as a part of their response to the pandemic Moreover, during the pandemic advance diagnosing tools were developed using Artificial Intelligence (AI) to detect the COVID-19 virus and various other imaging systems.
Generative AI makes use of unsupervised learning algorithms for spam detection, image compression, and preprocessing data stage such as removing noise from visual data to improve picture quality. Moreover, supervised learning algorithms is used for medical imaging and image classification. Furthermore, it has applications in various industries such as BFSI, healthcare, automotive & transportation, IT & telecommunications, media & entertainment, and others.
Generative AI is at a developing stage which will require a skilled workforce and high investment in implementation for development. According to IBM’s global AI adoption index 2022 report, 34% of respondents believed that a lack of Artificial Intelligence (AI) skills, expertise, or knowledge was restricting the adoption of Artificial Intelligence (AI) for industries. Hence, the unavailability of a skilled workforce and the high implementation costs are expected to slow down the pace of development of the market.
Major market players such as U.S.-based Microsoft and Apple Inc. are progressively investing in Research & Development (R&D) activities. Moreover, these companies are researching technologies such as Artificial Intelligence (AI) and Machine Learning (ML). For instance, in May 2020, World Wide Technology, a technology service provider started an initiative that is focused on artificial intelligence and machine learning and has some of the highest experiments and work programmed on generative AI. As an increasing number of companies continue to develop and experiment in the field and use generative AI in their products, the market is expected to witness promising growth opportunities.
Regional Insights
North America dominated the market with a share of 40.25% in 2022 and is projected to grow at a CAGR of 34.77% over the forecast period due to factors such as rising pseudo-imagination & medical care and increasing banking frauds. Also, the presence of prominent market players such as U.S.-based Meta, Microsoft, and Google LLC, developed technology organizations, and the presence of experts are likely to drive the growth generative AI market in the region.
Asia Pacific is anticipated to grow at the fastest CAGR of 35.61% during the forecast period. Increasing government initiatives in Artificial Intelligence (AI) in Asia Pacific and the increasing adoption of AI applications are driving the growth of generative AI in the region.
Generative AI Market Segmentations:
| By Component | By Technology | By End-use |
|
Software Services |
Generative Adversarial Networks (GANs) Transformers Variational Auto-encoders Diffusion Networks |
Media & Entertainment BFSI IT & Telecommunication Healthcare Automotive & Transportation Others |
Chapter 1. Introduction
1.1. Research Objective
1.2. Scope of the Study
1.3. Definition
Chapter 2. Research Methodology
2.1. Research Approach
2.2. Data Sources
2.3. Assumptions & Limitations
Chapter 3. Executive Summary
3.1. Market Snapshot
Chapter 4. Market Variables and Scope
4.1. Introduction
4.2. Market Classification and Scope
4.3. Industry Value Chain Analysis
4.3.1. Raw Material Procurement Analysis
4.3.2. Sales and Distribution Channel Analysis
4.3.3. Downstream Buyer Analysis
Chapter 5. COVID 19 Impact on Generative AI Market
5.1. COVID-19 Landscape: Generative AI Industry Impact
5.2. COVID 19 - Impact Assessment for the Industry
5.3. COVID 19 Impact: Global Major Government Policy
5.4. Market Trends and Opportunities in the COVID-19 Landscape
Chapter 6. Market Dynamics Analysis and Trends
6.1. Market Dynamics
6.1.1. Market Drivers
6.1.2. Market Restraints
6.1.3. Market Opportunities
6.2. Porter’s Five Forces Analysis
6.2.1. Bargaining power of suppliers
6.2.2. Bargaining power of buyers
6.2.3. Threat of substitute
6.2.4. Threat of new entrants
6.2.5. Degree of competition
Chapter 7. Competitive Landscape
7.1.1. Company Market Share/Positioning Analysis
7.1.2. Key Strategies Adopted by Players
7.1.3. Vendor Landscape
7.1.3.1. List of Suppliers
7.1.3.2. List of Buyers
Chapter 8. Global Generative AI Market, By Component
8.1. Generative AI Market, by Component, 2023-2032
8.1.1 Software
8.1.1.1. Market Revenue and Forecast (2020-2032)
8.1.2. Services
8.1.2.1. Market Revenue and Forecast (2020-2032)
Chapter 9. Global Generative AI Market, By Technology
9.1. Generative AI Market, by Technology, 2023-2032
9.1.1. Generative Adversarial Networks (GANs)
9.1.1.1. Market Revenue and Forecast (2020-2032)
9.1.2. Transformers
9.1.2.1. Market Revenue and Forecast (2020-2032)
9.1.3. Variational Auto-encoders
9.1.3.1. Market Revenue and Forecast (2020-2032)
9.1.4. Diffusion Networks
9.1.4.1. Market Revenue and Forecast (2020-2032)
Chapter 10. Global Generative AI Market, By End-use
10.1. Generative AI Market, by End-use, 2023-2032
10.1.1. Media & Entertainment
10.1.1.1. Market Revenue and Forecast (2020-2032)
10.1.2. BFSI
10.1.2.1. Market Revenue and Forecast (2020-2032)
10.1.3. IT & Telecommunication
10.1.3.1. Market Revenue and Forecast (2020-2032)
10.1.4. Healthcare
10.1.4.1. Market Revenue and Forecast (2020-2032)
10.1.5. Automotive & Transportation
10.1.5.1. Market Revenue and Forecast (2020-2032)
10.1.6. Others
10.1.6.1. Market Revenue and Forecast (2020-2032)
Chapter 11. Global Generative AI Market, Regional Estimates and Trend Forecast
11.1. North America
11.1.1. Market Revenue and Forecast, by Component (2020-2032)
11.1.2. Market Revenue and Forecast, by Technology (2020-2032)
11.1.3. Market Revenue and Forecast, by End-use (2020-2032)
11.1.4. U.S.
11.1.4.1. Market Revenue and Forecast, by Component (2020-2032)
11.1.4.2. Market Revenue and Forecast, by Technology (2020-2032)
11.1.4.3. Market Revenue and Forecast, by End-use (2020-2032)
11.1.5. Rest of North America
11.1.5.1. Market Revenue and Forecast, by Component (2020-2032)
11.1.5.2. Market Revenue and Forecast, by Technology (2020-2032)
11.1.5.3. Market Revenue and Forecast, by End-use (2020-2032)
11.2. Europe
11.2.1. Market Revenue and Forecast, by Component (2020-2032)
11.2.2. Market Revenue and Forecast, by Technology (2020-2032)
11.2.3. Market Revenue and Forecast, by End-use (2020-2032)
11.2.4. UK
11.2.4.1. Market Revenue and Forecast, by Component (2020-2032)
11.2.4.2. Market Revenue and Forecast, by Technology (2020-2032)
11.2.4.3. Market Revenue and Forecast, by End-use (2020-2032)
11.2.5. Germany
11.2.5.1. Market Revenue and Forecast, by Component (2020-2032)
11.2.5.2. Market Revenue and Forecast, by Technology (2020-2032)
11.2.5.3. Market Revenue and Forecast, by End-use (2020-2032)
11.2.6. France
11.2.6.1. Market Revenue and Forecast, by Component (2020-2032)
11.2.6.2. Market Revenue and Forecast, by Technology (2020-2032)
11.2.6.3. Market Revenue and Forecast, by End-use (2020-2032)
11.2.7. Rest of Europe
11.2.7.1. Market Revenue and Forecast, by Component (2020-2032)
11.2.7.2. Market Revenue and Forecast, by Technology (2020-2032)
11.2.7.3. Market Revenue and Forecast, by End-use (2020-2032)
11.3. APAC
11.3.1. Market Revenue and Forecast, by Component (2020-2032)
11.3.2. Market Revenue and Forecast, by Technology (2020-2032)
11.3.3. Market Revenue and Forecast, by End-use (2020-2032)
11.3.4. India
11.3.4.1. Market Revenue and Forecast, by Component (2020-2032)
11.3.4.2. Market Revenue and Forecast, by Technology (2020-2032)
11.3.4.3. Market Revenue and Forecast, by End-use (2020-2032)
11.3.5. China
11.3.5.1. Market Revenue and Forecast, by Component (2020-2032)
11.3.5.2. Market Revenue and Forecast, by Technology (2020-2032)
11.3.5.3. Market Revenue and Forecast, by End-use (2020-2032)
11.3.6. Japan
11.3.6.1. Market Revenue and Forecast, by Component (2020-2032)
11.3.6.2. Market Revenue and Forecast, by Technology (2020-2032)
11.3.6.3. Market Revenue and Forecast, by End-use (2020-2032)
11.3.7. Rest of APAC
11.3.7.1. Market Revenue and Forecast, by Component (2020-2032)
11.3.7.2. Market Revenue and Forecast, by Technology (2020-2032)
11.3.7.3. Market Revenue and Forecast, by End-use (2020-2032)
11.4. MEA
11.4.1. Market Revenue and Forecast, by Component (2020-2032)
11.4.2. Market Revenue and Forecast, by Technology (2020-2032)
11.4.3. Market Revenue and Forecast, by End-use (2020-2032)
11.4.4. GCC
11.4.4.1. Market Revenue and Forecast, by Component (2020-2032)
11.4.4.2. Market Revenue and Forecast, by Technology (2020-2032)
11.4.4.3. Market Revenue and Forecast, by End-use (2020-2032)
11.4.5. North Africa
11.4.5.1. Market Revenue and Forecast, by Component (2020-2032)
11.4.5.2. Market Revenue and Forecast, by Technology (2020-2032)
11.4.5.3. Market Revenue and Forecast, by End-use (2020-2032)
11.4.6. South Africa
11.4.6.1. Market Revenue and Forecast, by Component (2020-2032)
11.4.6.2. Market Revenue and Forecast, by Technology (2020-2032)
11.4.6.3. Market Revenue and Forecast, by End-use (2020-2032)
11.4.7. Rest of MEA
11.4.7.1. Market Revenue and Forecast, by Component (2020-2032)
11.4.7.2. Market Revenue and Forecast, by Technology (2020-2032)
11.4.7.3. Market Revenue and Forecast, by End-use (2020-2032)
11.5. Latin America
11.5.1. Market Revenue and Forecast, by Component (2020-2032)
11.5.2. Market Revenue and Forecast, by Technology (2020-2032)
11.5.3. Market Revenue and Forecast, by End-use (2020-2032)
11.5.4. Brazil
11.5.4.1. Market Revenue and Forecast, by Component (2020-2032)
11.5.4.2. Market Revenue and Forecast, by Technology (2020-2032)
11.5.4.3. Market Revenue and Forecast, by End-use (2020-2032)
11.5.5. Rest of LATAM
11.5.5.1. Market Revenue and Forecast, by Component (2020-2032)
11.5.5.2. Market Revenue and Forecast, by Technology (2020-2032)
11.5.5.3. Market Revenue and Forecast, by End-use (2020-2032)
Chapter 12. Company Profiles
12.1. Synthesia
12.1.1. Company Overview
12.1.2. Product Offerings
12.1.3. Financial Performance
12.1.4. Recent Initiatives
12.2. MOSTLY AI Inc.
12.2.1. Company Overview
12.2.2. Product Offerings
12.2.3. Financial Performance
12.2.4. Recent Initiatives
12.3. Genie AI Ltd
12.3.1. Company Overview
12.3.2. Product Offerings
12.3.3. Financial Performance
12.3.4. Recent Initiatives
12.4. Amazon Web Services, Inc.
12.4.1. Company Overview
12.4.2. Product Offerings
12.4.3. Financial Performance
12.4.4. Recent Initiatives
12.5. IBM
12.5.1. Company Overview
12.5.2. Product Offerings
12.5.3. Financial Performance
12.5.4. Recent Initiatives
12.6. Google LLC
12.6.1. Company Overview
12.6.2. Product Offerings
12.6.3. Financial Performance
12.6.4. Recent Initiatives
12.7. Microsoft
12.7.1. Company Overview
12.7.2. Product Offerings
12.7.3. Financial Performance
12.7.4. Recent Initiatives
12.8. Adobe
12.8.1. Company Overview
12.8.2. Product Offerings
12.8.3. Financial Performance
12.8.4. Recent Initiatives
12.9. Rephrase.ai
12.9.1. Company Overview
12.9.2. Product Offerings
12.9.3. Financial Performance
12.9.4. Recent Initiatives
12.10. D-ID
12.10.1. Company Overview
12.10.2. Product Offerings
12.10.3. Financial Performance
12.10.4. Recent Initiatives
Chapter 13. Research Methodology
13.1. Primary Research
13.2. Secondary Research
13.3. Assumptions
Chapter 14. Appendix
14.1. About Us
14.2. Glossary of Terms
 Cross-segment Market Size and Analysis for
Mentioned Segments
Additional Company Profiles (Upto 5 With No Cost)
Additional Countries (Apart From Mentioned Countries)
Country/Region-specific Report
Go To Market Strategy
Region Specific Market DynamicsRegion Level Market Share Import Export AnalysisProduction AnalysisOthers
Cross-segment Market Size and Analysis for
Mentioned Segments
Additional Company Profiles (Upto 5 With No Cost)
Additional Countries (Apart From Mentioned Countries)
Country/Region-specific Report
Go To Market Strategy
Region Specific Market DynamicsRegion Level Market Share Import Export AnalysisProduction AnalysisOthers