Green Ammonia Market Size, Growth, Trends | Report 2023-2032
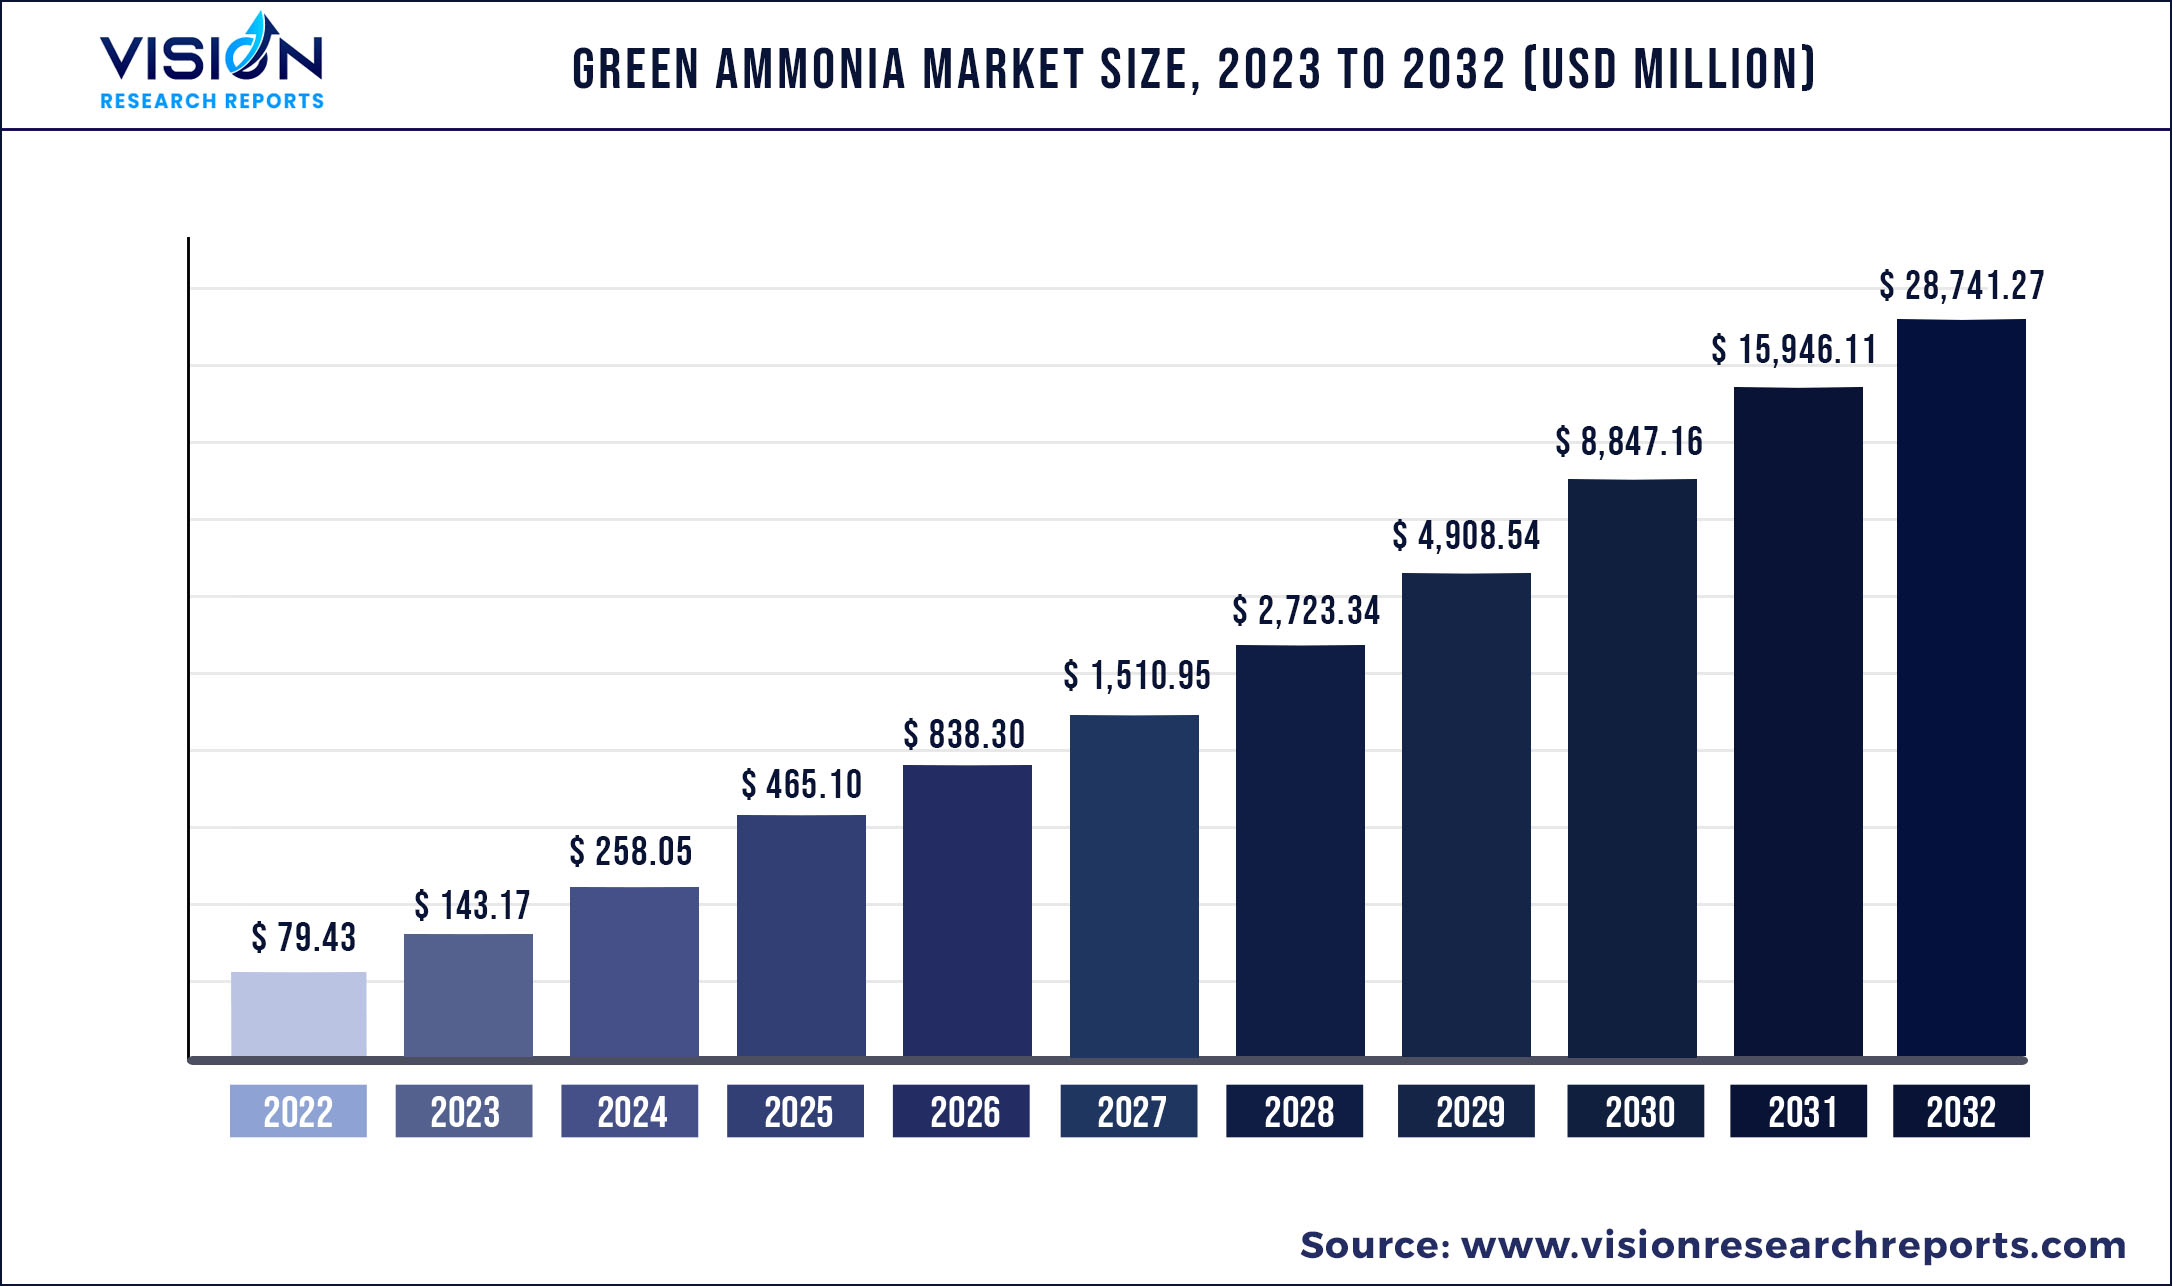
The global green ammonia market was surpassed at USD 79.43 million in 2022 and is expected to hit around USD 28,741.27 million by 2032, growing at a CAGR of 80.24% from 2023 to 2032.
Key Pointers
| Report Coverage | Details |
| Market Size in 2022 | USD 79.43 million |
| Revenue Forecast by 2032 | USD 28,741.27 million |
| Growth rate from 2023 to 2032 | CAGR of 80.24% |
| Base Year | 2022 |
| Forecast Period | 2023 to 2032 |
| Regions Covered | North America, Europe, Asia Pacific, Latin America, Middle East & Africa |
| Companies Covered | MAN Energy Solutions; Siemens Energy; ITM Power PLC; Nel Hydrogen; Hydrogenics; ThyssenKrupp AG; McPhy Energy; Green Hydrogen Systems; EXYTRON; Electrochaea; Enapter; AquaHydrex; Yara International; BASF SE; Uniper ENGIE; Star fire Energy; Haldor Topsoe; Hiringa Energy; Queensland Nitrates Pty Ltd |
The increasing prevalence of green ammonia due to growing awareness of producing clean energy and reducing carbon footprint is expected to boost demand in the coming years. The increasing popularity of the product as marine fuel and shipping in the transportation industry as it emits zero carbon and leaves no sulfur traces which leads to improved air quality is further anticipated to drive market growth in the near future. Green ammonia is produced by hydrogen that comes from water and nitrogen from the air. It is a resourceful fuel for heat and power, especially for marine transport that can be used in gas turbines, internal combustion engines, generator sets, industrial furnaces, and fuel cells.
Due to pressure on the shipping sector to reduce carbon emissions, green ammonia is the best alternative, as it has less volumetric energy density, which makes storage feasible, as compared to other fuels. Additionally, the favorable rules and regulations related to low-carbon emissions and growing fuel demand from the marine industry are also propelling market growth.
Renewable ammonia is expected to become a commodity chemical by 2040. This is due to increasing initiatives by several governments towards low to zero carbon emissions. In the forecast period, the product is likely to become a prime commodity for transporting renewable energy across the regions. Further, the growing demand for green ammonia in various end-use industries including fertilizer, power generation, refrigeration transportation, and others is expected to propel industry growth. In addition, increasing demand for green ammonia in industrial feedstock products including pharmaceutical products is expected to trigger market growth.
The value chain depicts the vertical integration of key players, whose business operations range from raw material suppliers to the distribution of finished products. BASF SE, Yara International, ThyssenKrupp AG, and ITM Power PLC are the key players integrated across the value chain. Among these, Haldor Topsoe, Green Fuel, Yara International ASA, Statkraft AS, and Aker Clean Hydrogen are the key players undertaking R&D activities for the development of required green ammonia in respective markets.
Green Ammonia Market Segmentations:
| By Technology | By End-Use |
|
Solid Oxide Electrolysis Proton Exchange Membrane Alkaline Water Electrolysis |
Power Generation Transportation Fertilizer Refrigeration Others |
Chapter 1. Introduction
1.1. Research Objective
1.2. Scope of the Study
1.3. Definition
Chapter 2. Research Methodology
2.1. Research Approach
2.2. Data Sources
2.3. Assumptions & Limitations
Chapter 3. Executive Summary
3.1. Market Snapshot
Chapter 4. Market Variables and Scope
4.1. Introduction
4.2. Market Classification and Scope
4.3. Industry Value Chain Analysis
4.3.1. Raw Material Procurement Analysis
4.3.2. Sales and Distribution Channel Analysis
4.3.3. Downstream Buyer Analysis
Chapter 5. COVID 19 Impact on Green Ammonia Market
5.1. COVID-19 Landscape: Green Ammonia Industry Impact
5.2. COVID 19 - Impact Assessment for the Industry
5.3. COVID 19 Impact: Global Major Government Policy
5.4. Market Trends and Opportunities in the COVID-19 Landscape
Chapter 6. Market Dynamics Analysis and Trends
6.1. Market Dynamics
6.1.1. Market Drivers
6.1.2. Market Restraints
6.1.3. Market Opportunities
6.2. Porter’s Five Forces Analysis
6.2.1. Bargaining power of suppliers
6.2.2. Bargaining power of buyers
6.2.3. Threat of substitute
6.2.4. Threat of new entrants
6.2.5. Degree of competition
Chapter 7. Competitive Landscape
7.1.1. Company Market Share/Positioning Analysis
7.1.2. Key Strategies Adopted by Players
7.1.3. Vendor Landscape
7.1.3.1. List of Suppliers
7.1.3.2. List of Buyers
Chapter 8. Global Green Ammonia Market, By Technology
8.1. Green Ammonia Market, by Technology, 2023-2032
8.1.1. Solid Oxide Electrolysis
8.1.1.1. Market Revenue and Forecast (2020-2032)
8.1.2. Proton Exchange Membrane
8.1.2.1. Market Revenue and Forecast (2020-2032)
8.1.3. Alkaline Water Electrolysis
8.1.3.1. Market Revenue and Forecast (2020-2032)
Chapter 9. Global Green Ammonia Market, By End-Use
9.1. Green Ammonia Market, by End-Use, 2023-2032
9.1.1. Power Generation
9.1.1.1. Market Revenue and Forecast (2020-2032)
9.1.2. Transportation
9.1.2.1. Market Revenue and Forecast (2020-2032)
9.1.3. Fertilizer
9.1.3.1. Market Revenue and Forecast (2020-2032)
9.1.4. Refrigeration
9.1.4.1. Market Revenue and Forecast (2020-2032)
9.1.5. Others
9.1.5.1. Market Revenue and Forecast (2020-2032)
Chapter 10. Global Green Ammonia Market, Regional Estimates and Trend Forecast
10.1. North America
10.1.1. Market Revenue and Forecast, by Technology (2020-2032)
10.1.2. Market Revenue and Forecast, by End-Use (2020-2032)
10.1.3. U.S.
10.1.3.1. Market Revenue and Forecast, by Technology (2020-2032)
10.1.3.2. Market Revenue and Forecast, by End-Use (2020-2032)
10.1.4. Rest of North America
10.1.4.1. Market Revenue and Forecast, by Technology (2020-2032)
10.1.4.2. Market Revenue and Forecast, by End-Use (2020-2032)
10.2. Europe
10.2.1. Market Revenue and Forecast, by Technology (2020-2032)
10.2.2. Market Revenue and Forecast, by End-Use (2020-2032)
10.2.3. UK
10.2.3.1. Market Revenue and Forecast, by Technology (2020-2032)
10.2.3.2. Market Revenue and Forecast, by End-Use (2020-2032)
10.2.4. Germany
10.2.4.1. Market Revenue and Forecast, by Technology (2020-2032)
10.2.4.2. Market Revenue and Forecast, by End-Use (2020-2032)
10.2.5. France
10.2.5.1. Market Revenue and Forecast, by Technology (2020-2032)
10.2.5.2. Market Revenue and Forecast, by End-Use (2020-2032)
10.2.6. Rest of Europe
10.2.6.1. Market Revenue and Forecast, by Technology (2020-2032)
10.2.6.2. Market Revenue and Forecast, by End-Use (2020-2032)
10.3. APAC
10.3.1. Market Revenue and Forecast, by Technology (2020-2032)
10.3.2. Market Revenue and Forecast, by End-Use (2020-2032)
10.3.3. India
10.3.3.1. Market Revenue and Forecast, by Technology (2020-2032)
10.3.3.2. Market Revenue and Forecast, by End-Use (2020-2032)
10.3.4. China
10.3.4.1. Market Revenue and Forecast, by Technology (2020-2032)
10.3.4.2. Market Revenue and Forecast, by End-Use (2020-2032)
10.3.5. Japan
10.3.5.1. Market Revenue and Forecast, by Technology (2020-2032)
10.3.5.2. Market Revenue and Forecast, by End-Use (2020-2032)
10.3.6. Rest of APAC
10.3.6.1. Market Revenue and Forecast, by Technology (2020-2032)
10.3.6.2. Market Revenue and Forecast, by End-Use (2020-2032)
10.4. MEA
10.4.1. Market Revenue and Forecast, by Technology (2020-2032)
10.4.2. Market Revenue and Forecast, by End-Use (2020-2032)
10.4.3. GCC
10.4.3.1. Market Revenue and Forecast, by Technology (2020-2032)
10.4.3.2. Market Revenue and Forecast, by End-Use (2020-2032)
10.4.4. North Africa
10.4.4.1. Market Revenue and Forecast, by Technology (2020-2032)
10.4.4.2. Market Revenue and Forecast, by End-Use (2020-2032)
10.4.5. South Africa
10.4.5.1. Market Revenue and Forecast, by Technology (2020-2032)
10.4.5.2. Market Revenue and Forecast, by End-Use (2020-2032)
10.4.6. Rest of MEA
10.4.6.1. Market Revenue and Forecast, by Technology (2020-2032)
10.4.6.2. Market Revenue and Forecast, by End-Use (2020-2032)
10.5. Latin America
10.5.1. Market Revenue and Forecast, by Technology (2020-2032)
10.5.2. Market Revenue and Forecast, by End-Use (2020-2032)
10.5.3. Brazil
10.5.3.1. Market Revenue and Forecast, by Technology (2020-2032)
10.5.3.2. Market Revenue and Forecast, by End-Use (2020-2032)
10.5.4. Rest of LATAM
10.5.4.1. Market Revenue and Forecast, by Technology (2020-2032)
10.5.4.2. Market Revenue and Forecast, by End-Use (2020-2032)
Chapter 11. Company Profiles
11.1. MAN Energy Solutions
11.1.1. Company Overview
11.1.2. Product Offerings
11.1.3. Financial Performance
11.1.4. Recent Initiatives
11.2. Siemens Energy
11.2.1. Company Overview
11.2.2. Product Offerings
11.2.3. Financial Performance
11.2.4. Recent Initiatives
11.3. ITM Power PLC
11.3.1. Company Overview
11.3.2. Product Offerings
11.3.3. Financial Performance
11.3.4. Recent Initiatives
11.4. Nel Hydrogen
11.4.1. Company Overview
11.4.2. Product Offerings
11.4.3. Financial Performance
11.4.4. LTE Scientific
11.5. Hydrogenics
11.5.1. Company Overview
11.5.2. Product Offerings
11.5.3. Financial Performance
11.5.4. Recent Initiatives
11.6. ThyssenKrupp AG
11.6.1. Company Overview
11.6.2. Product Offerings
11.6.3. Financial Performance
11.6.4. Recent Initiatives
11.7. McPhy Energy
11.7.1. Company Overview
11.7.2. Product Offerings
11.7.3. Financial Performance
11.7.4. Recent Initiatives
11.8. Green Hydrogen Systems
11.8.1. Company Overview
11.8.2. Product Offerings
11.8.3. Financial Performance
11.8.4. Recent Initiatives
11.9. EXYTRON
11.9.1. Company Overview
11.9.2. Product Offerings
11.9.3. Financial Performance
11.9.4. Recent Initiatives
11.10. Electrochaea
11.10.1. Company Overview
11.10.2. Product Offerings
11.10.3. Financial Performance
11.10.4. Recent Initiatives
Chapter 12. Research Methodology
12.1. Primary Research
12.2. Secondary Research
12.3. Assumptions
Chapter 13. Appendix
13.1. About Us
13.2. Glossary of Terms
 Cross-segment Market Size and Analysis for
Mentioned Segments
Additional Company Profiles (Upto 5 With No Cost)
Additional Countries (Apart From Mentioned Countries)
Country/Region-specific Report
Go To Market Strategy
Region Specific Market DynamicsRegion Level Market Share Import Export AnalysisProduction AnalysisOthers
Cross-segment Market Size and Analysis for
Mentioned Segments
Additional Company Profiles (Upto 5 With No Cost)
Additional Countries (Apart From Mentioned Countries)
Country/Region-specific Report
Go To Market Strategy
Region Specific Market DynamicsRegion Level Market Share Import Export AnalysisProduction AnalysisOthers