High Performance Computing Market Size, Share | Report 2023-2032
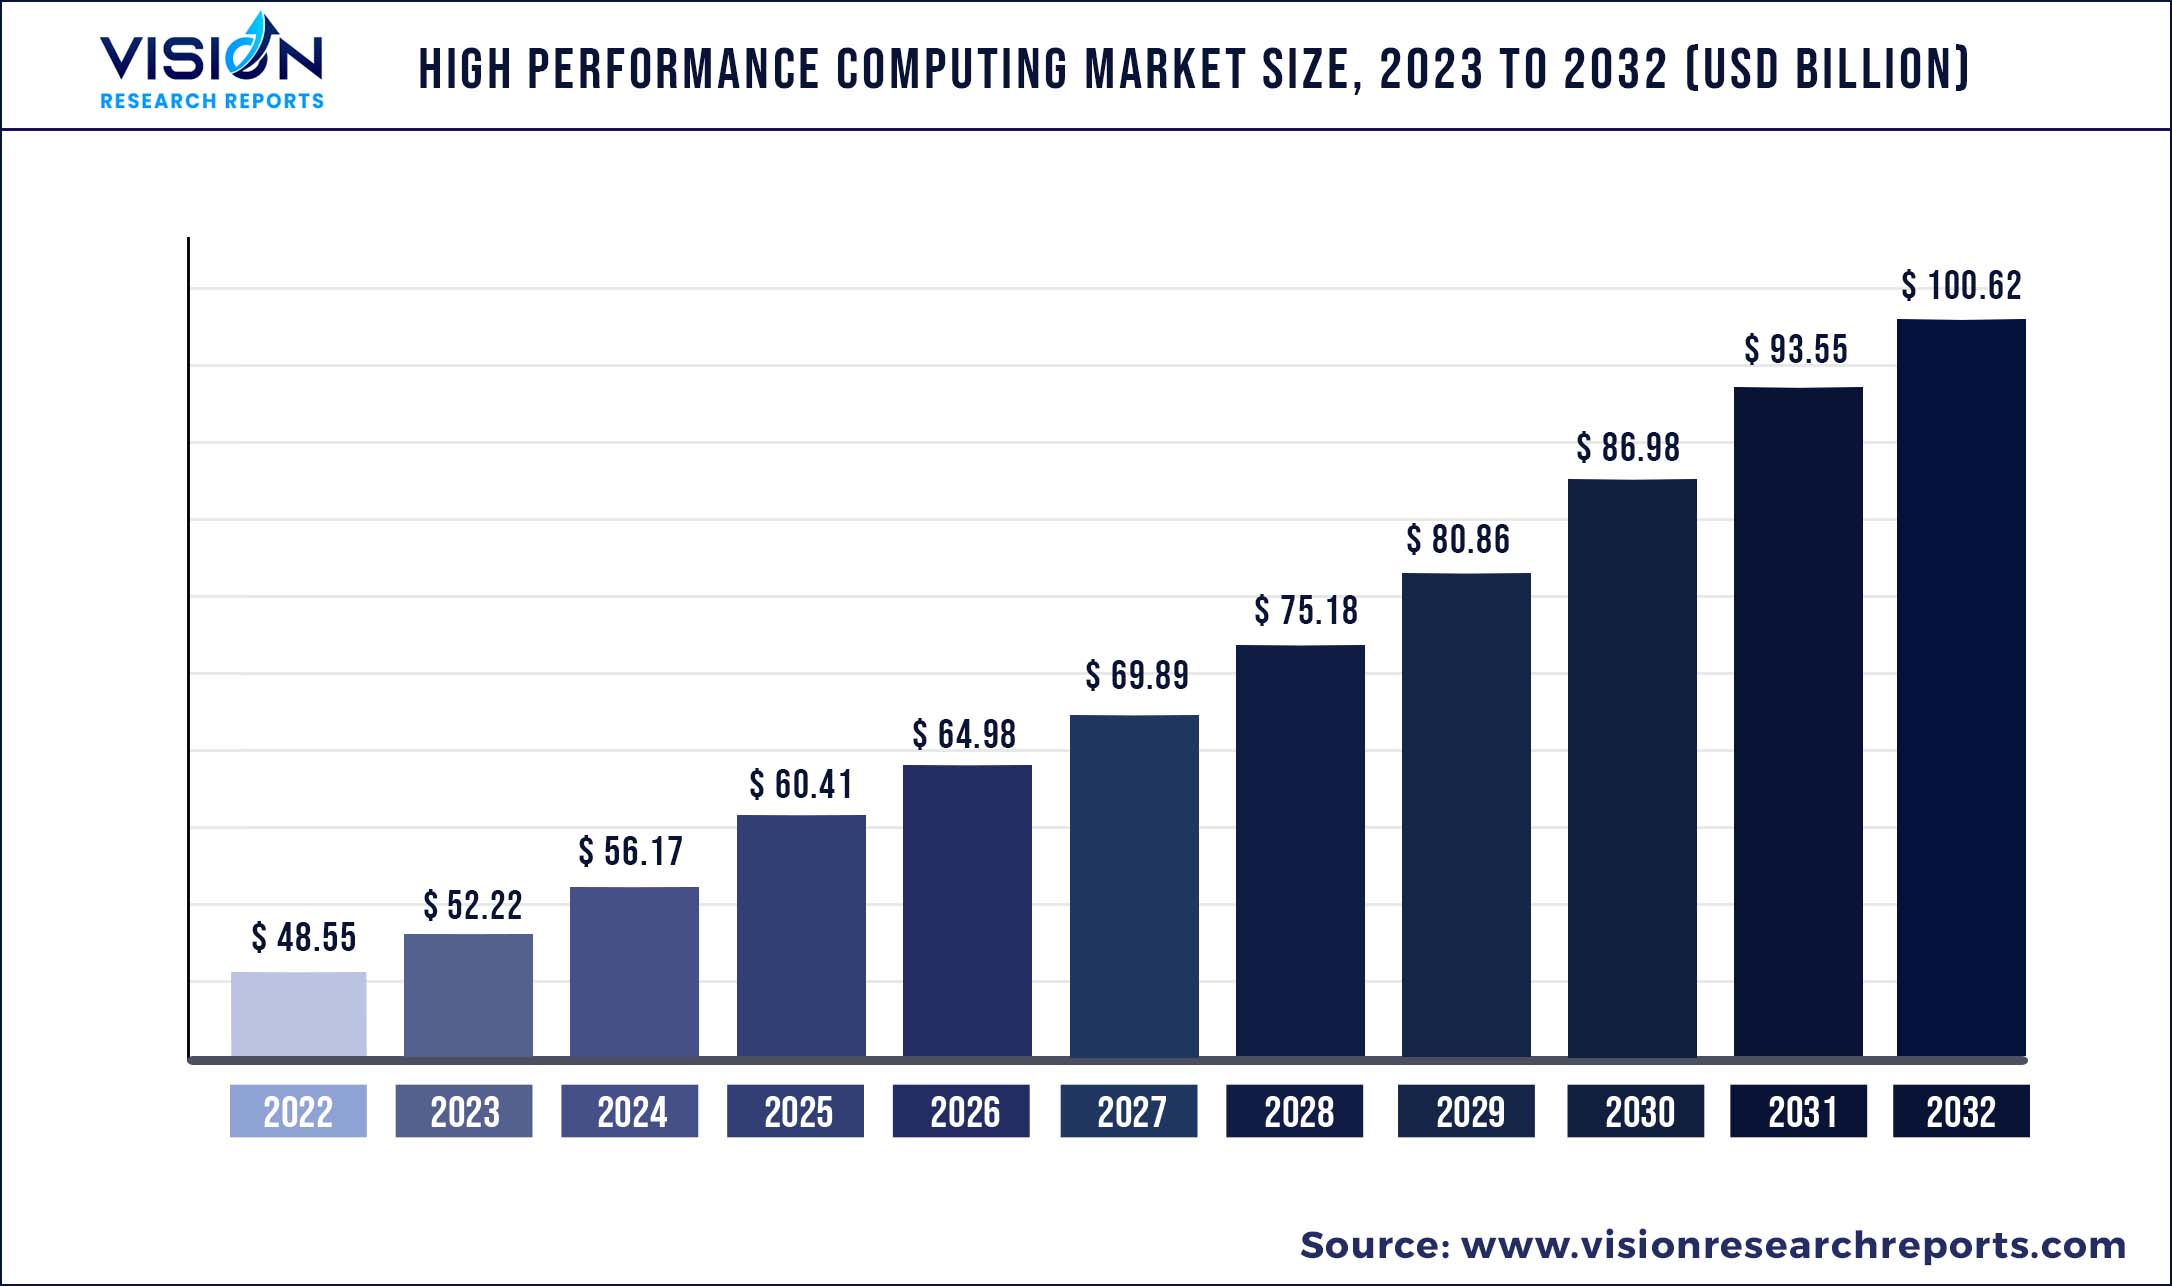
The global high-performance computing market was valued at USD 48.55 billion in 2022 and it is predicted to surpass around USD 100.62 billion by 2032 with a CAGR of 7.56% from 2023 to 2032.
Key Pointers
Report Scope of the High Performance Computing Market
| Report Coverage | Details |
| Market Size in 2022 | USD 48.55 billion |
| Revenue Forecast by 2032 | USD 100.62 billion |
| Growth rate from 2023 to 2032 | CAGR of 7.56% |
| Base Year | 2022 |
| Forecast Period | 2023 to 2032 |
| Regions Covered | North America, Europe, Asia Pacific, Latin America, Middle East & Africa |
| Companies Covered | Atos SE; Advanced Micro Devices, Inc; Hewlett Packard Enterprise Development LP; Dell Inc.; Cisco Systems, Inc.; Fujitsu; Intel Corporation; IBM; Microsoft; Amazon Web Services, Inc. |
The growing demand for high-efficiency computing, advancements in virtualization, continued diversification and expansion of the IT industry, and the increasing preference for hybrid high-performance computing (HPC) solutions are the factors that are expected to drive the growth. The capacity of HPC systems to process huge amounts of data at high speeds is encouraging academic institutions, defense agencies, energy companies, government agencies, and the utility sector to adopt HPC systems, which also helps in the expansion of the high-performance computing industry’s growth.
High-performance computing is growing due to the increased use of this technology in government sectors as well as in applications that require solving scientific, complex, and business problems. These uses and applications make it a high-demand and high-investment area. Additionally, HPC is being supported and identified at a higher rate because of its adoption in government, enterprise, and industrial applications. Furthermore, high-performance computing is required due to the adoption of cloud-based high-performance and complex application management.
Factors such as a lack of expertise and the high cost of high-performance computing maintenance remain hindrances to the growth of the industry. Furthermore, one of the restraining factors in the high-performance computing industry is the lack of advancements in high-performance workstations. As the use of HPC systems grows, so do concerns about cyber security. Because multiple entities access HPC systems, data security remains a major concern. As a result, security concerns are expected to limit the growth of the high-performance computing industry.
The opportunities for growth for high-performance computing in various industries in the U.S. continue to increase. HPC has enabled many industries and enterprises to discover new things and innovate their products and services. High-performance computing in aerospace, steel & welding, automotive, consumer packaged goods & manufacturing, weather forecasting, energy consumption and production, finance, healthcare, sports & entertainment, and space research are among the opportunities. High-performance computing systems are also made up of a group of computers whose combined or total power offers high computational capabilities. That is, high-performance computing systems can potentially simplify complex business procedures. As a result, the demand for High-performance computing systems is expected to rise in the forthcoming years.
The rising popularity of cloud computing coupled with the digitization initiatives being adopted by many governments would play a critical role in catapulting the HPC industry growth over the forecast period. For instance, the government of the United Arab Emirates (UAE) has launched digital transformation projects, such as Smart Abu Dhabi and Smart Dubai. These projects would promote the adoption of cloud computing and stimulate the demand for HPC systems. A new system of working from home was implemented because of COVID-19. This system was aided by the high-performance computing industry by resolving many computation power limitations and enhanced with the use of solutions like data analysis.
High Performance Computing Market Segmentations:
| By Component | By Deployment | By End-use |
|
Servers Storage Networking Devices Software Services Cloud Others |
On-Premise Cloud |
Banking, Financial Services, and Insurance (BFSI) Gaming Media & Entertainment Retail Transportation Government & Defense Education & Research Manufacturing Healthcare & Bioscience Others |
Chapter 1. Introduction
1.1. Research Objective
1.2. Scope of the Study
1.3. Definition
Chapter 2. Research Methodology
2.1. Research Approach
2.2. Data Sources
2.3. Assumptions & Limitations
Chapter 3. Executive Summary
3.1. Market Snapshot
Chapter 4. Market Variables and Scope
4.1. Introduction
4.2. Market Classification and Scope
4.3. Industry Value Chain Analysis
4.3.1. Raw Material Procurement Analysis
4.3.2. Sales and Distribution Component Analysis
4.3.3. Downstream Buyer Analysis
Chapter 5. COVID 19 Impact on High Performance Computing Market
5.1. COVID-19 Landscape: High Performance Computing Industry Impact
5.2. COVID 19 - Impact Assessment for the Industry
5.3. COVID 19 Impact: Global Major Government Policy
5.4. Market Trends and Opportunities in the COVID-19 Landscape
Chapter 6. Market Dynamics Analysis and Trends
6.1. Market Dynamics
6.1.1. Market Drivers
6.1.2. Market Restraints
6.1.3. Market Opportunities
6.2. Porter’s Five Forces Analysis
6.2.1. Bargaining power of suppliers
6.2.2. Bargaining power of buyers
6.2.3. Threat of substitute
6.2.4. Threat of new entrants
6.2.5. Degree of competition
Chapter 7. Competitive Landscape
7.1.1. Company Market Share/Positioning Analysis
7.1.2. Key Strategies Adopted by Players
7.1.3. Vendor Landscape
7.1.3.1. List of Suppliers
7.1.3.2. List of Buyers
Chapter 8. Global High Performance Computing Market, By Component
8.1. High Performance Computing Market, by Component, 2023-2032
8.1.1 Servers
8.1.1.1. Market Revenue and Forecast (2020-2032)
8.1.2. Storage
8.1.2.1. Market Revenue and Forecast (2020-2032)
8.1.3. Networking Devices
8.1.3.1. Market Revenue and Forecast (2020-2032)
8.1.4. Software
8.1.4.1. Market Revenue and Forecast (2020-2032)
8.1.5. Services
8.1.5.1. Market Revenue and Forecast (2020-2032)
8.1.6. Cloud
8.1.6.1. Market Revenue and Forecast (2020-2032)
8.1.7. Others
8.1.7.1. Market Revenue and Forecast (2020-2032)
Chapter 9. Global High Performance Computing Market, By Deployment
9.1. High Performance Computing Market, by Deployment, 2023-2032
9.1.1. On-Premise
9.1.1.1. Market Revenue and Forecast (2020-2032)
9.1.2. Cloud
9.1.2.1. Market Revenue and Forecast (2020-2032)
Chapter 10. Global High Performance Computing Market, By End-use
10.1. High Performance Computing Market, by End-use, 2023-2032
10.1.1. Banking, Financial Services, and Insurance (BFSI)
10.1.1.1. Market Revenue and Forecast (2020-2032)
10.1.2. Gaming
10.1.2.1. Market Revenue and Forecast (2020-2032)
10.1.3. Media & Entertainment
10.1.3.1. Market Revenue and Forecast (2020-2032)
10.1.4. Retail
10.1.4.1. Market Revenue and Forecast (2020-2032)
10.1.5. Transportation
10.1.5.1. Market Revenue and Forecast (2020-2032)
10.1.6. Government & Defense
10.1.6.1. Market Revenue and Forecast (2020-2032)
10.1.7. Education & Research
10.1.7.1. Market Revenue and Forecast (2020-2032)
10.1.8. Manufacturing
10.1.8.1. Market Revenue and Forecast (2020-2032)
10.1.9. Healthcare & Bioscience
10.1.9.1. Market Revenue and Forecast (2020-2032)
10.1.10. Others
10.1.10.1. Market Revenue and Forecast (2020-2032)
Chapter 11. Global High Performance Computing Market, Regional Estimates and Trend Forecast
11.1. North America
11.1.1. Market Revenue and Forecast, by Component (2020-2032)
11.1.2. Market Revenue and Forecast, by Deployment (2020-2032)
11.1.3. Market Revenue and Forecast, by End-use (2020-2032)
11.1.4. U.S.
11.1.4.1. Market Revenue and Forecast, by Component (2020-2032)
11.1.4.2. Market Revenue and Forecast, by Deployment (2020-2032)
11.1.4.3. Market Revenue and Forecast, by End-use (2020-2032)
11.1.5. Rest of North America
11.1.5.1. Market Revenue and Forecast, by Component (2020-2032)
11.1.5.2. Market Revenue and Forecast, by Deployment (2020-2032)
11.1.5.3. Market Revenue and Forecast, by End-use (2020-2032)
11.2. Europe
11.2.1. Market Revenue and Forecast, by Component (2020-2032)
11.2.2. Market Revenue and Forecast, by Deployment (2020-2032)
11.2.3. Market Revenue and Forecast, by End-use (2020-2032)
11.2.4. UK
11.2.4.1. Market Revenue and Forecast, by Component (2020-2032)
11.2.4.2. Market Revenue and Forecast, by Deployment (2020-2032)
11.2.4.3. Market Revenue and Forecast, by End-use (2020-2032)
11.2.5. Germany
11.2.5.1. Market Revenue and Forecast, by Component (2020-2032)
11.2.5.2. Market Revenue and Forecast, by Deployment (2020-2032)
11.2.5.3. Market Revenue and Forecast, by End-use (2020-2032)
11.2.6. France
11.2.6.1. Market Revenue and Forecast, by Component (2020-2032)
11.2.6.2. Market Revenue and Forecast, by Deployment (2020-2032)
11.2.6.3. Market Revenue and Forecast, by End-use (2020-2032)
11.2.7. Rest of Europe
11.2.7.1. Market Revenue and Forecast, by Component (2020-2032)
11.2.7.2. Market Revenue and Forecast, by Deployment (2020-2032)
11.2.7.3. Market Revenue and Forecast, by End-use (2020-2032)
11.3. APAC
11.3.1. Market Revenue and Forecast, by Component (2020-2032)
11.3.2. Market Revenue and Forecast, by Deployment (2020-2032)
11.3.3. Market Revenue and Forecast, by End-use (2020-2032)
11.3.4. India
11.3.4.1. Market Revenue and Forecast, by Component (2020-2032)
11.3.4.2. Market Revenue and Forecast, by Deployment (2020-2032)
11.3.4.3. Market Revenue and Forecast, by End-use (2020-2032)
11.3.5. China
11.3.5.1. Market Revenue and Forecast, by Component (2020-2032)
11.3.5.2. Market Revenue and Forecast, by Deployment (2020-2032)
11.3.5.3. Market Revenue and Forecast, by End-use (2020-2032)
11.3.6. Japan
11.3.6.1. Market Revenue and Forecast, by Component (2020-2032)
11.3.6.2. Market Revenue and Forecast, by Deployment (2020-2032)
11.3.6.3. Market Revenue and Forecast, by End-use (2020-2032)
11.3.7. Rest of APAC
11.3.7.1. Market Revenue and Forecast, by Component (2020-2032)
11.3.7.2. Market Revenue and Forecast, by Deployment (2020-2032)
11.3.7.3. Market Revenue and Forecast, by End-use (2020-2032)
11.4. MEA
11.4.1. Market Revenue and Forecast, by Component (2020-2032)
11.4.2. Market Revenue and Forecast, by Deployment (2020-2032)
11.4.3. Market Revenue and Forecast, by End-use (2020-2032)
11.4.4. GCC
11.4.4.1. Market Revenue and Forecast, by Component (2020-2032)
11.4.4.2. Market Revenue and Forecast, by Deployment (2020-2032)
11.4.4.3. Market Revenue and Forecast, by End-use (2020-2032)
11.4.5. North Africa
11.4.5.1. Market Revenue and Forecast, by Component (2020-2032)
11.4.5.2. Market Revenue and Forecast, by Deployment (2020-2032)
11.4.5.3. Market Revenue and Forecast, by End-use (2020-2032)
11.4.6. South Africa
11.4.6.1. Market Revenue and Forecast, by Component (2020-2032)
11.4.6.2. Market Revenue and Forecast, by Deployment (2020-2032)
11.4.6.3. Market Revenue and Forecast, by End-use (2020-2032)
11.4.7. Rest of MEA
11.4.7.1. Market Revenue and Forecast, by Component (2020-2032)
11.4.7.2. Market Revenue and Forecast, by Deployment (2020-2032)
11.4.7.3. Market Revenue and Forecast, by End-use (2020-2032)
11.5. Latin America
11.5.1. Market Revenue and Forecast, by Component (2020-2032)
11.5.2. Market Revenue and Forecast, by Deployment (2020-2032)
11.5.3. Market Revenue and Forecast, by End-use (2020-2032)
11.5.4. Brazil
11.5.4.1. Market Revenue and Forecast, by Component (2020-2032)
11.5.4.2. Market Revenue and Forecast, by Deployment (2020-2032)
11.5.4.3. Market Revenue and Forecast, by End-use (2020-2032)
11.5.5. Rest of LATAM
11.5.5.1. Market Revenue and Forecast, by Component (2020-2032)
11.5.5.2. Market Revenue and Forecast, by Deployment (2020-2032)
11.5.5.3. Market Revenue and Forecast, by End-use (2020-2032)
Chapter 12. Company Profiles
12.1. Atos SE
12.1.1. Company Overview
12.1.2. Product Offerings
12.1.3. Financial Performance
12.1.4. Recent Initiatives
12.2. Advanced Micro Devices, Inc
12.2.1. Company Overview
12.2.2. Product Offerings
12.2.3. Financial Performance
12.2.4. Recent Initiatives
12.3. Hewlett Packard Enterprise Development LP
12.3.1. Company Overview
12.3.2. Product Offerings
12.3.3. Financial Performance
12.3.4. Recent Initiatives
12.4. Dell Inc.
12.4.1. Company Overview
12.4.2. Product Offerings
12.4.3. Financial Performance
12.4.4. Recent Initiatives
12.5. Cisco Systems, Inc.
12.5.1. Company Overview
12.5.2. Product Offerings
12.5.3. Financial Performance
12.5.4. Recent Initiatives
12.6. Fujitsu
12.6.1. Company Overview
12.6.2. Product Offerings
12.6.3. Financial Performance
12.6.4. Recent Initiatives
12.7. Intel Corporation
12.7.1. Company Overview
12.7.2. Product Offerings
12.7.3. Financial Performance
12.7.4. Recent Initiatives
12.8. IBM
12.8.1. Company Overview
12.8.2. Product Offerings
12.8.3. Financial Performance
12.8.4. Recent Initiatives
12.9. Microsoft
12.9.1. Company Overview
12.9.2. Product Offerings
12.9.3. Financial Performance
12.9.4. Recent Initiatives
12.10. Amazon Web Services, Inc.
12.10.1. Company Overview
12.10.2. Product Offerings
12.10.3. Financial Performance
12.10.4. Recent Initiatives
Chapter 13. Research Methodology
13.1. Primary Research
13.2. Secondary Research
13.3. Assumptions
Chapter 14. Appendix
14.1. About Us
14.2. Glossary of Terms
 Cross-segment Market Size and Analysis for
Mentioned Segments
Additional Company Profiles (Upto 5 With No Cost)
Additional Countries (Apart From Mentioned Countries)
Country/Region-specific Report
Go To Market Strategy
Region Specific Market DynamicsRegion Level Market Share Import Export AnalysisProduction AnalysisOthers
Cross-segment Market Size and Analysis for
Mentioned Segments
Additional Company Profiles (Upto 5 With No Cost)
Additional Countries (Apart From Mentioned Countries)
Country/Region-specific Report
Go To Market Strategy
Region Specific Market DynamicsRegion Level Market Share Import Export AnalysisProduction AnalysisOthers