Hydrolyzed Vegetable Proteins Market Size, Share | Report 2023-2032
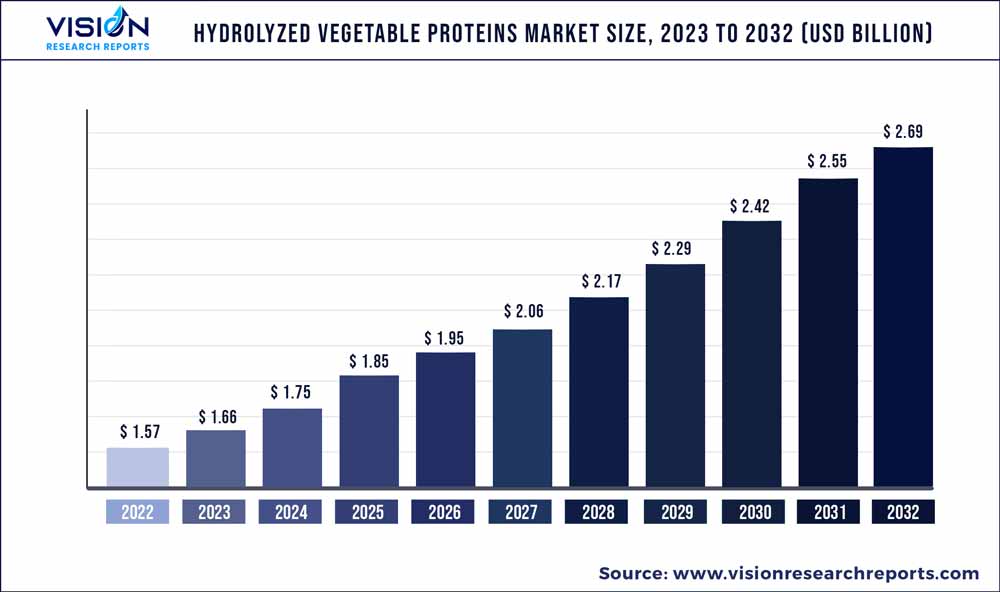
The global hydrolyzed vegetable proteins market was surpassed at USD 1.57 billion in 2022 and is expected to hit around USD 2.69 billion by 2032, growing at a CAGR of 5.54% from 2023 to 2032.
Key Pointers
Report Scope of the Hydrolyzed Vegetable Proteins Market
| Report Coverage | Details |
| Market Size in 2022 | USD 1.57 billion |
| Revenue Forecast by 2032 | USD 2.69 billion |
| Growth rate from 2023 to 2032 | CAGR of 5.54% |
| Base Year | 2022 |
| Forecast Period | 2023 to 2032 |
| Market Analysis (Terms Used) | Value (US$ Million/Billion) or (Volume/Units) |
| Regions Covered | North America, Europe, Asia Pacific, Latin America, Middle East & Africa |
| Companies Covered | Ajinomoto Co., Inc.; Kerry Group Plc.; Aipu Food Industry; Titan Biotech; Cargill Inc.; Roquette Frères; DSM; Tate & Lyle; ADM; Griffith Foods; MGP |
The product demand is anticipated to be driven by several factors, such as the rising demand for meat analogs due to the growing popularity of the vegan diet, increasing demand for functional foods and healthy snacking as well as a growing interest in plant-based proteins. The increasing demand for vegan and vegetarian diets is one of the major drivers of the market. With the growing awareness about the benefits of plant-based diets, more consumers are opting for vegetarian and vegan food products.
Hydrolyzed Vegetable Protein (HVP) is a popular ingredient in vegetarian and vegan food products as it provides a rich source of protein without the use of animal-based ingredients. HVPs are becoming an important ingredient in the preparation of new foods, including meat analogs, sausages, soups, and cereals. It is also used as a flavoring agent in meat analogs to improve the taste as well as flavor. Meat analogs are non-meat foods that are designed to resemble meat in flavor, texture, chemical characteristics, and appearance. With the use of hydrolyzed plant protein, food manufacturers can create meat analogs that are both healthy & flavorful and appealing to a wide range of consumers who are looking for plant-based options.
The popularity of healthy snack foods is on the rise, especially among working individuals who have busy schedules due to rapid urbanization and changing lifestyles. The popularity of Ready-To-Eat (RTE) meals has led to an increase in demand for hydrolyzed vegetable proteins in the food industry. Hydrolyzed vegetable proteins are widely used in the food industry as a texturizer, flavor enhancer, and preservative. They are obtained by breaking down vegetable proteins into smaller components through a process called hydrolysis. HVPs are used in many RTE meals, including soups, stews, and casseroles, to enhance their flavor and improve texture. They are also used in sauces, salad dressings, and marinades to provide a rich umami flavor and extend their shelf life.
In addition to their use in the RTE meal market, HVPs are also used in the production of processed foods, such as baked goods, breakfast cereals, and snack foods. HVPs can be used to improve the taste and texture of a variety of food products. The increasing demand for functional foods is another key factor driving the growth of the hydrolyzed vegetable protein market. Functional foods are food products that provide health benefits beyond basic nutrition. HVP is used as a functional ingredient in various food products, such as nutrition bars, beverages, and meal replacement shakes. The incorporation of hydrolyzed plant protein in functional foods is expected to drive the growth of the global hydrolyzed plant protein market in the coming years.
Source Insights
Based on sources, the industry is segmented into soy, wheat, corn, peas, and others. In 2022, the soy segment dominated the market with a revenue share of over 48.62% owing to the cost-effectiveness and the wide availability of soy crops. The demand for HVP made from soy is driven by its availability, health benefits, popularity in vegetarian and vegan diets, cost-effectiveness, and flavor-enhancing properties. Soy is a good source of protein and soy HVP is a relatively healthy alternative to animal-based flavorings as it is low in fat, calories, and cholesterol. Soy HVP is less expensive than animal-based flavorings, making it a cost-effective option for food manufacturers. Furthermore, it has a strong umami flavor, which enhances the taste of various food products and helps mask off flavors or bitter tastes in processed foods.
The pea HVP segment is expected to register a significant CAGR from 2023 to 2032. Pea protein hydrolysate is a popular protein supplement among athletes, bodybuilders, and health-conscious individuals due to its high protein content and potential health benefits, including improved muscle growth, reduced muscle soreness, and lower blood pressure. Its benefits make it an attractive option for individuals looking to enhance their overall health and athletic performance. It is commonly used in sports medicine as it allows for improved absorption of amino acids compared to intact proteins, resulting in optimal nutrient delivery to muscles. In addition to its health benefits, it is free from common allergens, such as dairy, soy, and gluten, making it a safe choice for people with food allergies or sensitivities.
Application Insights
Based on applications, the market is segmented into bakery & confectionary, processed food products, meat substitutes, beverages, and others. In 2022, the processed food products segment dominated the industry with a revenue share of over 41.04% owing to the growing application of HVP in processed food products. HVP is a functional ingredient that is widely used in the food industry because of its ability to enhance flavor and texture, as well as its cost-effectiveness and ease of use. HVP is commonly used as an emulsifying agent, a flavor enhancer, and a texture modifier in processed foods.
The rising demand for processed foods due to their convenience, longer shelf life, and changing consumer lifestyles is expected to increase the demand for HVP as an ingredient in these products. The meat substitutes segment is expected to register the fastest CAGR from 2023 to 2032. HVP is often used as an ingredient in meat substitutes, such as veggie burgers or meatless meatballs, to provide a meaty flavor and texture. It can also be used as a seasoning or flavor enhancer in a variety of vegetarian and vegan dishes. One advantage of using HVP as a meat substitute is that it is typically less expensive than traditional meat, making it an affordable option for those on a budget. In addition, it is a plant-based ingredient, making it a suitable option for vegetarians and vegans.
Function Insights
Based on functions, the market is segmented into flavoring agent, emulsifying agent, and others. The flavoring agent segment dominated the market with the highest revenue share of 74.87% in 2022 and is expected to retain its dominance during the forecast period. HVP is a common flavoring agent in the food industry as it provides a savory or umami flavor that enhances the taste of food products. Umami is often referred to as the fifth taste, alongside sweet, sour, salty, and bitter. The food industry’s need to create more flavorful and appealing products that can compete with traditional meat-based products has led to the increasing demand for HVP as a flavoring agent.
HVP is often used in soups, sauces, snacks, and ready-to-eat meals, among other products. The growing demand for plant-based and vegetarian food products is also contributing to the increased use of HVP as a flavoring agent in the food industry. The emulsifying agent segment is expected to register a significant CAGR from 2023 to 2032. The ingredient is used as an emulsifying agent due to its ability to help blend and stabilize different components in a food product that would otherwise separate. HVP can also help improve the texture, appearance, and overall quality of food products by preventing fat bloom, improving viscosity, and reducing water activity.
Regional Insights
In terms of revenue, North America dominated the industry with a revenue share of 38.1% in 2022 owing to the large and established food and beverage industry, which creates a significant demand for HVP as a flavor enhancer and functional ingredient. In addition, increasing demand for processed and convenience foods in the region has further fueled the growth of the market. Furthermore, the region has a well-developed healthcare industry that utilizes HVP in medical nutrition products.
Moreover, the region has a high prevalence of various health conditions, such as obesity and diabetes, which have led to an increased demand for healthier food options, including products containing HVP. The Asia Pacific region is expected to register a lucrative CAGR from 2023 to 2032 owing to the rising demand for natural and plant-based food ingredients, as well as increasing awareness about the health benefits of protein. The region is also the largest producer of plant-based protein sources, such as soybean and wheat, which further drives the market growth.
Hydrolyzed Vegetable Proteins Market Segmentations:
By Source
By Function
By Application
By Regional
Chapter 1. Introduction
1.1. Research Objective
1.2. Scope of the Study
1.3. Definition
Chapter 2. Research Methodology
2.1. Research Approach
2.2. Data Sources
2.3. Assumptions & Limitations
Chapter 3. Executive Summary
3.1. Market Snapshot
Chapter 4. Market Variables and Scope
4.1. Introduction
4.2. Market Classification and Scope
4.3. Industry Value Chain Analysis
4.3.1. Raw Material Procurement Analysis
4.3.2. Sales and Distribution Source Analysis
4.3.3. Downstream Buyer Analysis
Chapter 5. COVID 19 Impact on Hydrolyzed Vegetable Proteins Market
5.1. COVID-19 Landscape: Hydrolyzed Vegetable Proteins Industry Impact
5.2. COVID 19 - Impact Assessment for the Industry
5.3. COVID 19 Impact: Global Major Government Policy
5.4. Market Trends and Opportunities in the COVID-19 Landscape
Chapter 6. Market Dynamics Analysis and Trends
6.1. Market Dynamics
6.1.1. Market Drivers
6.1.2. Market Restraints
6.1.3. Market Opportunities
6.2. Porter’s Five Forces Analysis
6.2.1. Bargaining power of suppliers
6.2.2. Bargaining power of buyers
6.2.3. Threat of substitute
6.2.4. Threat of new entrants
6.2.5. Degree of competition
Chapter 7. Competitive Landscape
7.1.1. Company Market Share/Positioning Analysis
7.1.2. Key Strategies Adopted by Players
7.1.3. Vendor Landscape
7.1.3.1. List of Suppliers
7.1.3.2. List of Buyers
Chapter 8. Global Hydrolyzed Vegetable Proteins Market, By Source
8.1. Hydrolyzed Vegetable Proteins Market, by Source, 2023-2032
8.1.1 Soy
8.1.1.1. Market Revenue and Forecast (2020-2032)
8.1.2. Wheat
8.1.2.1. Market Revenue and Forecast (2020-2032)
8.1.3. Corn
8.1.3.1. Market Revenue and Forecast (2020-2032)
8.1.4. Pea
8.1.4.1. Market Revenue and Forecast (2020-2032)
8.1.5. Others
8.1.5.1. Market Revenue and Forecast (2020-2032)
Chapter 9. Global Hydrolyzed Vegetable Proteins Market, By Function
9.1. Hydrolyzed Vegetable Proteins Market, by Function, 2023-2032
9.1.1. Flavoring Agent
9.1.1.1. Market Revenue and Forecast (2020-2032)
9.1.2. Emulsifying Agent
9.1.2.1. Market Revenue and Forecast (2020-2032)
9.1.3. Others
9.1.3.1. Market Revenue and Forecast (2020-2032)
Chapter 10. Global Hydrolyzed Vegetable Proteins Market, By Application
10.1. Hydrolyzed Vegetable Proteins Market, by Application, 2023-2032
10.1.1. Bakery & Confectionary
10.1.1.1. Market Revenue and Forecast (2020-2032)
10.1.2. Processed Food Products
10.1.2.1. Market Revenue and Forecast (2020-2032)
10.1.3. Meat Substitutes
10.1.3.1. Market Revenue and Forecast (2020-2032)
10.1.4. Beverages
10.1.4.1. Market Revenue and Forecast (2020-2032)
10.1.5. Others
10.1.5.1. Market Revenue and Forecast (2020-2032)
Chapter 11. Global Hydrolyzed Vegetable Proteins Market, Regional Estimates and Trend Forecast
11.1. North America
11.1.1. Market Revenue and Forecast, by Source (2020-2032)
11.1.2. Market Revenue and Forecast, by Function (2020-2032)
11.1.3. Market Revenue and Forecast, by Application (2020-2032)
11.1.4. U.S.
11.1.4.1. Market Revenue and Forecast, by Source (2020-2032)
11.1.4.2. Market Revenue and Forecast, by Function (2020-2032)
11.1.4.3. Market Revenue and Forecast, by Application (2020-2032)
11.1.5. Rest of North America
11.1.5.1. Market Revenue and Forecast, by Source (2020-2032)
11.1.5.2. Market Revenue and Forecast, by Function (2020-2032)
11.1.5.3. Market Revenue and Forecast, by Application (2020-2032)
11.2. Europe
11.2.1. Market Revenue and Forecast, by Source (2020-2032)
11.2.2. Market Revenue and Forecast, by Function (2020-2032)
11.2.3. Market Revenue and Forecast, by Application (2020-2032)
11.2.4. UK
11.2.4.1. Market Revenue and Forecast, by Source (2020-2032)
11.2.4.2. Market Revenue and Forecast, by Function (2020-2032)
11.2.4.3. Market Revenue and Forecast, by Application (2020-2032)
11.2.5. Germany
11.2.5.1. Market Revenue and Forecast, by Source (2020-2032)
11.2.5.2. Market Revenue and Forecast, by Function (2020-2032)
11.2.5.3. Market Revenue and Forecast, by Application (2020-2032)
11.2.6. France
11.2.6.1. Market Revenue and Forecast, by Source (2020-2032)
11.2.6.2. Market Revenue and Forecast, by Function (2020-2032)
11.2.6.3. Market Revenue and Forecast, by Application (2020-2032)
11.2.7. Rest of Europe
11.2.7.1. Market Revenue and Forecast, by Source (2020-2032)
11.2.7.2. Market Revenue and Forecast, by Function (2020-2032)
11.2.7.3. Market Revenue and Forecast, by Application (2020-2032)
11.3. APAC
11.3.1. Market Revenue and Forecast, by Source (2020-2032)
11.3.2. Market Revenue and Forecast, by Function (2020-2032)
11.3.3. Market Revenue and Forecast, by Application (2020-2032)
11.3.4. India
11.3.4.1. Market Revenue and Forecast, by Source (2020-2032)
11.3.4.2. Market Revenue and Forecast, by Function (2020-2032)
11.3.4.3. Market Revenue and Forecast, by Application (2020-2032)
11.3.5. China
11.3.5.1. Market Revenue and Forecast, by Source (2020-2032)
11.3.5.2. Market Revenue and Forecast, by Function (2020-2032)
11.3.5.3. Market Revenue and Forecast, by Application (2020-2032)
11.3.6. Japan
11.3.6.1. Market Revenue and Forecast, by Source (2020-2032)
11.3.6.2. Market Revenue and Forecast, by Function (2020-2032)
11.3.6.3. Market Revenue and Forecast, by Application (2020-2032)
11.3.7. Rest of APAC
11.3.7.1. Market Revenue and Forecast, by Source (2020-2032)
11.3.7.2. Market Revenue and Forecast, by Function (2020-2032)
11.3.7.3. Market Revenue and Forecast, by Application (2020-2032)
11.4. MEA
11.4.1. Market Revenue and Forecast, by Source (2020-2032)
11.4.2. Market Revenue and Forecast, by Function (2020-2032)
11.4.3. Market Revenue and Forecast, by Application (2020-2032)
11.4.4. GCC
11.4.4.1. Market Revenue and Forecast, by Source (2020-2032)
11.4.4.2. Market Revenue and Forecast, by Function (2020-2032)
11.4.4.3. Market Revenue and Forecast, by Application (2020-2032)
11.4.5. North Africa
11.4.5.1. Market Revenue and Forecast, by Source (2020-2032)
11.4.5.2. Market Revenue and Forecast, by Function (2020-2032)
11.4.5.3. Market Revenue and Forecast, by Application (2020-2032)
11.4.6. South Africa
11.4.6.1. Market Revenue and Forecast, by Source (2020-2032)
11.4.6.2. Market Revenue and Forecast, by Function (2020-2032)
11.4.6.3. Market Revenue and Forecast, by Application (2020-2032)
11.4.7. Rest of MEA
11.4.7.1. Market Revenue and Forecast, by Source (2020-2032)
11.4.7.2. Market Revenue and Forecast, by Function (2020-2032)
11.4.7.3. Market Revenue and Forecast, by Application (2020-2032)
11.5. Latin America
11.5.1. Market Revenue and Forecast, by Source (2020-2032)
11.5.2. Market Revenue and Forecast, by Function (2020-2032)
11.5.3. Market Revenue and Forecast, by Application (2020-2032)
11.5.4. Brazil
11.5.4.1. Market Revenue and Forecast, by Source (2020-2032)
11.5.4.2. Market Revenue and Forecast, by Function (2020-2032)
11.5.4.3. Market Revenue and Forecast, by Application (2020-2032)
11.5.5. Rest of LATAM
11.5.5.1. Market Revenue and Forecast, by Source (2020-2032)
11.5.5.2. Market Revenue and Forecast, by Function (2020-2032)
11.5.5.3. Market Revenue and Forecast, by Application (2020-2032)
Chapter 12. Company Profiles
12.1. Ajinomoto Co., Inc.
12.1.1. Company Overview
12.1.2. Product Offerings
12.1.3. Financial Performance
12.1.4. Recent Initiatives
12.2. Kerry Group Plc.
12.2.1. Company Overview
12.2.2. Product Offerings
12.2.3. Financial Performance
12.2.4. Recent Initiatives
12.3. Aipu Food Industry
12.3.1. Company Overview
12.3.2. Product Offerings
12.3.3. Financial Performance
12.3.4. Recent Initiatives
12.4. Titan Biotech
12.4.1. Company Overview
12.4.2. Product Offerings
12.4.3. Financial Performance
12.4.4. Recent Initiatives
12.5. Cargill Inc.
12.5.1. Company Overview
12.5.2. Product Offerings
12.5.3. Financial Performance
12.5.4. Recent Initiatives
12.6. Roquette Frères
12.6.1. Company Overview
12.6.2. Product Offerings
12.6.3. Financial Performance
12.6.4. Recent Initiatives
12.7. DSM
12.7.1. Company Overview
12.7.2. Product Offerings
12.7.3. Financial Performance
12.7.4. Recent Initiatives
12.8. Tate & Lyle
12.8.1. Company Overview
12.8.2. Product Offerings
12.8.3. Financial Performance
12.8.4. Recent Initiatives
12.9. ADM
12.9.1. Company Overview
12.9.2. Product Offerings
12.9.3. Financial Performance
12.9.4. Recent Initiatives
12.10. Griffith Foods
12.10.1. Company Overview
12.10.2. Product Offerings
12.10.3. Financial Performance
12.10.4. Recent Initiatives
Chapter 13. Research Methodology
13.1. Primary Research
13.2. Secondary Research
13.3. Assumptions
Chapter 14. Appendix
14.1. About Us
14.2. Glossary of Terms
 Cross-segment Market Size and Analysis for
Mentioned Segments
Additional Company Profiles (Upto 5 With No Cost)
Additional Countries (Apart From Mentioned Countries)
Country/Region-specific Report
Go To Market Strategy
Region Specific Market DynamicsRegion Level Market Share Import Export AnalysisProduction AnalysisOthers
Cross-segment Market Size and Analysis for
Mentioned Segments
Additional Company Profiles (Upto 5 With No Cost)
Additional Countries (Apart From Mentioned Countries)
Country/Region-specific Report
Go To Market Strategy
Region Specific Market DynamicsRegion Level Market Share Import Export AnalysisProduction AnalysisOthers