Hyperloop Technology Market Size, Growth, Trends | Report 2023-2032
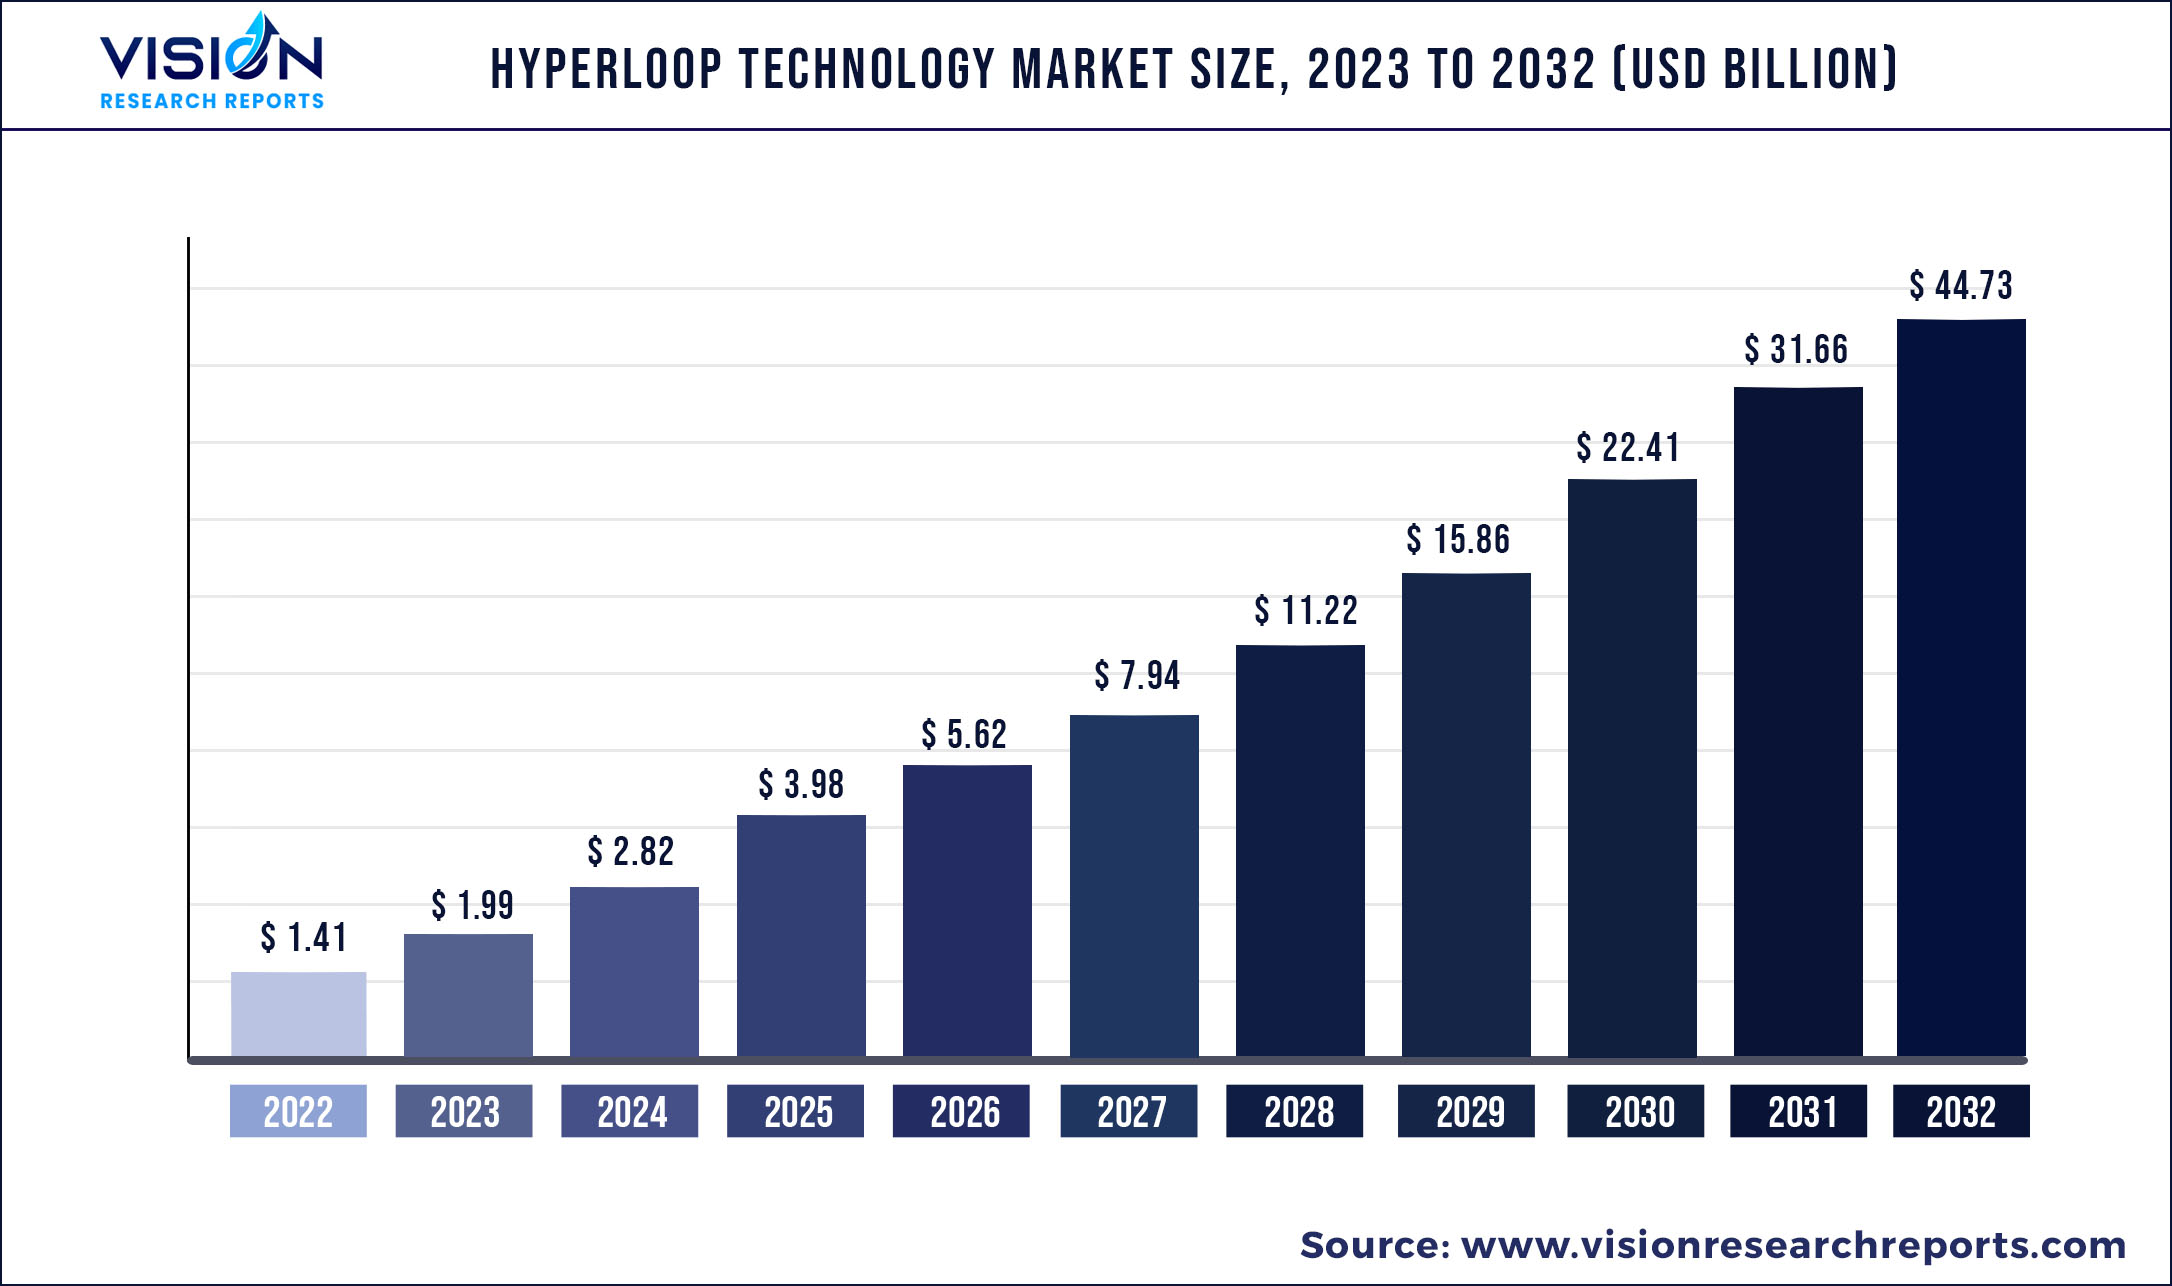
The global hyperloop technology market was surpassed at USD 1.41 billion in 2022 and is expected to hit around USD 44.73 billion by 2032, growing at a CAGR of 41.3% from 2023 to 2032.
Key Pointers
Report Scope of the Hyperloop Technology Market
| Report Coverage | Details |
| Market Size in 2022 | USD 1.41 billion |
| Revenue Forecast by 2032 | USD 44.73 billion |
| Growth rate from 2023 to 2032 | CAGR of 41.3% |
| Base Year | 2022 |
| Forecast Period | 2023 to 2032 |
| Market Analysis (Terms Used) | Value (US$ Million/Billion) or (Volume/Units) |
| Regions Covered | North America, Europe, Asia Pacific, Latin America, Middle East & Africa |
| Companies Covered | Aecom, Dinclix GroundWorks Private Limited, Hardt B.V., Hyperloop Transportation Technologies, Tesla Inc., TransPod Inc., Virgin Hyperloop and Zeleros Hyperloop |
Hyperloop technology is a futuristic mode of transportation for passenger or goods. This technology is proposed by a combined team of SpaceX and Tesla. It consists of a system of tubes or pods that allow for free frictionless movement, without any air resistance of passengers and goods, thereby optimizing the overall travel time for the passengers. These Pods float within the tubes above the rail line and further being pushed by electromagnets. Vactrain concept is used to remove external effects, which magnetically take off transportation system in evacuated or partly evacuated tubes that allows the mode of transportation to speed up to thousands of miles per hour. Once the pod reaches 100 miles glide it will run without requiring any external energy.
Hyperloop technology has several advantages such as speedy transportation, safety, and security, and more efficient infrastructure. Based on the prototype being made by the Hyperloop One, the onboard environmental controls along with localization capabilities will help in communication between pods and system controller making a stronger network. These pods will be able to detect obstacles through an array of sensors providing better safety experience for the passengers. Additionally, real-time data along with auto braking sensor will help in communication between motor and tubes ensuring greater system uptime for maintenance and operations. Systems and controls will be equally important as the physical innovations within tubes and pods further making a radically transformed transportation that will be faster with a stronger network topology. These factors are expected to have a positive impact on the growth of global hyperloop technology market during forecast period.
Hyperloop being a futuristic technology involves a lot of barriers when it comes to commercialization and worldwide implementation. As per Space X and Hyperloop One, two major companies working for hyperloop, it is presumed that terrain and other natural disasters will act as a major restraint for this market. Design prototype are being made for understanding the air friction and electro-magnets which is very costly. In addition to this, it is seen that the online services associated with hyperloop will require connection to the pods that might affect the magnetic field within the tube further forming a major obstacle for the implementation process.
North America is witnessing a large market share owing to the presence of the prominent market players such as Hyperloop Transportation Technologies, Virgin Hyperloop One, and others. The rising R&D investments and technological development led North America to become a dominant region in the adoption of hyperloop technology. Thus, North America is forestalling to emerge as a market leader. The key players in this region are focusing on collaboration strategy to enhance their production capabilities.
Asia-Pacific is the most developing region across the world. The growing participation of the government bodies towards exploring the feasibility of implementing hyperloop technology is anticipated to boost the growth of the market. Asia-pacific is likely to emerge as a prominent market contributor in the foremost period.
Hyperloop Technology Market Segmentations:
| By Transportation System | By Carriage Type | By Speed |
|
Capsule Tube Propulsion System Route |
Passenger Cargo/Freight |
Less than 700 kmph More than 700 kmph |
Chapter 1. Introduction
1.1. Research Objective
1.2. Scope of the Study
1.3. Definition
Chapter 2. Research Methodology
2.1. Research Approach
2.2. Data Sources
2.3. Assumptions & Limitations
Chapter 3. Executive Summary
3.1. Market Snapshot
Chapter 4. Market Variables and Scope
4.1. Introduction
4.2. Market Classification and Scope
4.3. Industry Value Chain Analysis
4.3.1. Raw Material Procurement Analysis
4.3.2. Sales and Distribution Transportation System Analysis
4.3.3. Downstream Buyer Analysis
Chapter 5. COVID 19 Impact on Hyperloop Technology Market
5.1. COVID-19 Landscape: Hyperloop Technology Industry Impact
5.2. COVID 19 - Impact Assessment for the Industry
5.3. COVID 19 Impact: Global Major Government Policy
5.4. Market Trends and Opportunities in the COVID-19 Landscape
Chapter 6. Market Dynamics Analysis and Trends
6.1. Market Dynamics
6.1.1. Market Drivers
6.1.2. Market Restraints
6.1.3. Market Opportunities
6.2. Porter’s Five Forces Analysis
6.2.1. Bargaining power of suppliers
6.2.2. Bargaining power of buyers
6.2.3. Threat of substitute
6.2.4. Threat of new entrants
6.2.5. Degree of competition
Chapter 7. Competitive Landscape
7.1.1. Company Market Share/Positioning Analysis
7.1.2. Key Strategies Adopted by Players
7.1.3. Vendor Landscape
7.1.3.1. List of Suppliers
7.1.3.2. List of Buyers
Chapter 8. Global Hyperloop Technology Market, By Transportation System
8.1. Hyperloop Technology Market, by Transportation System, 2023-2032
8.1.1 Capsule
8.1.1.1. Market Revenue and Forecast (2020-2032)
8.1.2. Tube
8.1.2.1. Market Revenue and Forecast (2020-2032)
8.1.3. Propulsion System
8.1.3.1. Market Revenue and Forecast (2020-2032)
8.1.4. Route
8.1.4.1. Market Revenue and Forecast (2020-2032)
Chapter 9. Global Hyperloop Technology Market, By Carriage Type
9.1. Hyperloop Technology Market, by Carriage Type, 2023-2032
9.1.1. Passenger
9.1.1.1. Market Revenue and Forecast (2020-2032)
9.1.2. Cargo/Freight
9.1.2.1. Market Revenue and Forecast (2020-2032)
Chapter 10. Global Hyperloop Technology Market, By Speed
10.1. Hyperloop Technology Market, by Speed, 2023-2032
10.1.1. Less than 700 kmph
10.1.1.1. Market Revenue and Forecast (2020-2032)
10.1.2. More than 700 kmph
10.1.2.1. Market Revenue and Forecast (2020-2032)
Chapter 11. Global Hyperloop Technology Market, Regional Estimates and Trend Forecast
11.1. North America
11.1.1. Market Revenue and Forecast, by Transportation System (2020-2032)
11.1.2. Market Revenue and Forecast, by Carriage Type (2020-2032)
11.1.3. Market Revenue and Forecast, by Speed (2020-2032)
11.1.4. U.S.
11.1.4.1. Market Revenue and Forecast, by Transportation System (2020-2032)
11.1.4.2. Market Revenue and Forecast, by Carriage Type (2020-2032)
11.1.4.3. Market Revenue and Forecast, by Speed (2020-2032)
11.1.5. Rest of North America
11.1.5.1. Market Revenue and Forecast, by Transportation System (2020-2032)
11.1.5.2. Market Revenue and Forecast, by Carriage Type (2020-2032)
11.1.5.3. Market Revenue and Forecast, by Speed (2020-2032)
11.2. Europe
11.2.1. Market Revenue and Forecast, by Transportation System (2020-2032)
11.2.2. Market Revenue and Forecast, by Carriage Type (2020-2032)
11.2.3. Market Revenue and Forecast, by Speed (2020-2032)
11.2.4. UK
11.2.4.1. Market Revenue and Forecast, by Transportation System (2020-2032)
11.2.4.2. Market Revenue and Forecast, by Carriage Type (2020-2032)
11.2.4.3. Market Revenue and Forecast, by Speed (2020-2032)
11.2.5. Germany
11.2.5.1. Market Revenue and Forecast, by Transportation System (2020-2032)
11.2.5.2. Market Revenue and Forecast, by Carriage Type (2020-2032)
11.2.5.3. Market Revenue and Forecast, by Speed (2020-2032)
11.2.6. France
11.2.6.1. Market Revenue and Forecast, by Transportation System (2020-2032)
11.2.6.2. Market Revenue and Forecast, by Carriage Type (2020-2032)
11.2.6.3. Market Revenue and Forecast, by Speed (2020-2032)
11.2.7. Rest of Europe
11.2.7.1. Market Revenue and Forecast, by Transportation System (2020-2032)
11.2.7.2. Market Revenue and Forecast, by Carriage Type (2020-2032)
11.2.7.3. Market Revenue and Forecast, by Speed (2020-2032)
11.3. APAC
11.3.1. Market Revenue and Forecast, by Transportation System (2020-2032)
11.3.2. Market Revenue and Forecast, by Carriage Type (2020-2032)
11.3.3. Market Revenue and Forecast, by Speed (2020-2032)
11.3.4. India
11.3.4.1. Market Revenue and Forecast, by Transportation System (2020-2032)
11.3.4.2. Market Revenue and Forecast, by Carriage Type (2020-2032)
11.3.4.3. Market Revenue and Forecast, by Speed (2020-2032)
11.3.5. China
11.3.5.1. Market Revenue and Forecast, by Transportation System (2020-2032)
11.3.5.2. Market Revenue and Forecast, by Carriage Type (2020-2032)
11.3.5.3. Market Revenue and Forecast, by Speed (2020-2032)
11.3.6. Japan
11.3.6.1. Market Revenue and Forecast, by Transportation System (2020-2032)
11.3.6.2. Market Revenue and Forecast, by Carriage Type (2020-2032)
11.3.6.3. Market Revenue and Forecast, by Speed (2020-2032)
11.3.7. Rest of APAC
11.3.7.1. Market Revenue and Forecast, by Transportation System (2020-2032)
11.3.7.2. Market Revenue and Forecast, by Carriage Type (2020-2032)
11.3.7.3. Market Revenue and Forecast, by Speed (2020-2032)
11.4. MEA
11.4.1. Market Revenue and Forecast, by Transportation System (2020-2032)
11.4.2. Market Revenue and Forecast, by Carriage Type (2020-2032)
11.4.3. Market Revenue and Forecast, by Speed (2020-2032)
11.4.4. GCC
11.4.4.1. Market Revenue and Forecast, by Transportation System (2020-2032)
11.4.4.2. Market Revenue and Forecast, by Carriage Type (2020-2032)
11.4.4.3. Market Revenue and Forecast, by Speed (2020-2032)
11.4.5. North Africa
11.4.5.1. Market Revenue and Forecast, by Transportation System (2020-2032)
11.4.5.2. Market Revenue and Forecast, by Carriage Type (2020-2032)
11.4.5.3. Market Revenue and Forecast, by Speed (2020-2032)
11.4.6. South Africa
11.4.6.1. Market Revenue and Forecast, by Transportation System (2020-2032)
11.4.6.2. Market Revenue and Forecast, by Carriage Type (2020-2032)
11.4.6.3. Market Revenue and Forecast, by Speed (2020-2032)
11.4.7. Rest of MEA
11.4.7.1. Market Revenue and Forecast, by Transportation System (2020-2032)
11.4.7.2. Market Revenue and Forecast, by Carriage Type (2020-2032)
11.4.7.3. Market Revenue and Forecast, by Speed (2020-2032)
11.5. Latin America
11.5.1. Market Revenue and Forecast, by Transportation System (2020-2032)
11.5.2. Market Revenue and Forecast, by Carriage Type (2020-2032)
11.5.3. Market Revenue and Forecast, by Speed (2020-2032)
11.5.4. Brazil
11.5.4.1. Market Revenue and Forecast, by Transportation System (2020-2032)
11.5.4.2. Market Revenue and Forecast, by Carriage Type (2020-2032)
11.5.4.3. Market Revenue and Forecast, by Speed (2020-2032)
11.5.5. Rest of LATAM
11.5.5.1. Market Revenue and Forecast, by Transportation System (2020-2032)
11.5.5.2. Market Revenue and Forecast, by Carriage Type (2020-2032)
11.5.5.3. Market Revenue and Forecast, by Speed (2020-2032)
Chapter 12. Company Profiles
12.1. Aecom
12.1.1. Company Overview
12.1.2. Product Offerings
12.1.3. Financial Performance
12.1.4. Recent Initiatives
12.2. Dinclix GroundWorks Private Limited
12.2.1. Company Overview
12.2.2. Product Offerings
12.2.3. Financial Performance
12.2.4. Recent Initiatives
12.3. Hardt B.V.
12.3.1. Company Overview
12.3.2. Product Offerings
12.3.3. Financial Performance
12.3.4. Recent Initiatives
12.4. Hyperloop Transportation Technologies
12.4.1. Company Overview
12.4.2. Product Offerings
12.4.3. Financial Performance
12.4.4. Recent Initiatives
12.5. Tesla Inc.
12.5.1. Company Overview
12.5.2. Product Offerings
12.5.3. Financial Performance
12.5.4. Recent Initiatives
12.6. TransPod Inc.
12.6.1. Company Overview
12.6.2. Product Offerings
12.6.3. Financial Performance
12.6.4. Recent Initiatives
12.7. Virgin Hyperloop
12.7.1. Company Overview
12.7.2. Product Offerings
12.7.3. Financial Performance
12.7.4. Recent Initiatives
12.8. Zeleros Hyperloop
12.8.1. Company Overview
12.8.2. Product Offerings
12.8.3. Financial Performance
12.8.4. Recent Initiatives
Chapter 13. Research Methodology
13.1. Primary Research
13.2. Secondary Research
13.3. Assumptions
Chapter 14. Appendix
14.1. About Us
14.2. Glossary of Terms
 Cross-segment Market Size and Analysis for
Mentioned Segments
Additional Company Profiles (Upto 5 With No Cost)
Additional Countries (Apart From Mentioned Countries)
Country/Region-specific Report
Go To Market Strategy
Region Specific Market DynamicsRegion Level Market Share Import Export AnalysisProduction AnalysisOthers
Cross-segment Market Size and Analysis for
Mentioned Segments
Additional Company Profiles (Upto 5 With No Cost)
Additional Countries (Apart From Mentioned Countries)
Country/Region-specific Report
Go To Market Strategy
Region Specific Market DynamicsRegion Level Market Share Import Export AnalysisProduction AnalysisOthers