In-vitro Toxicology Testing Market Size, Trends, Share, Growth | Report 2023-2032
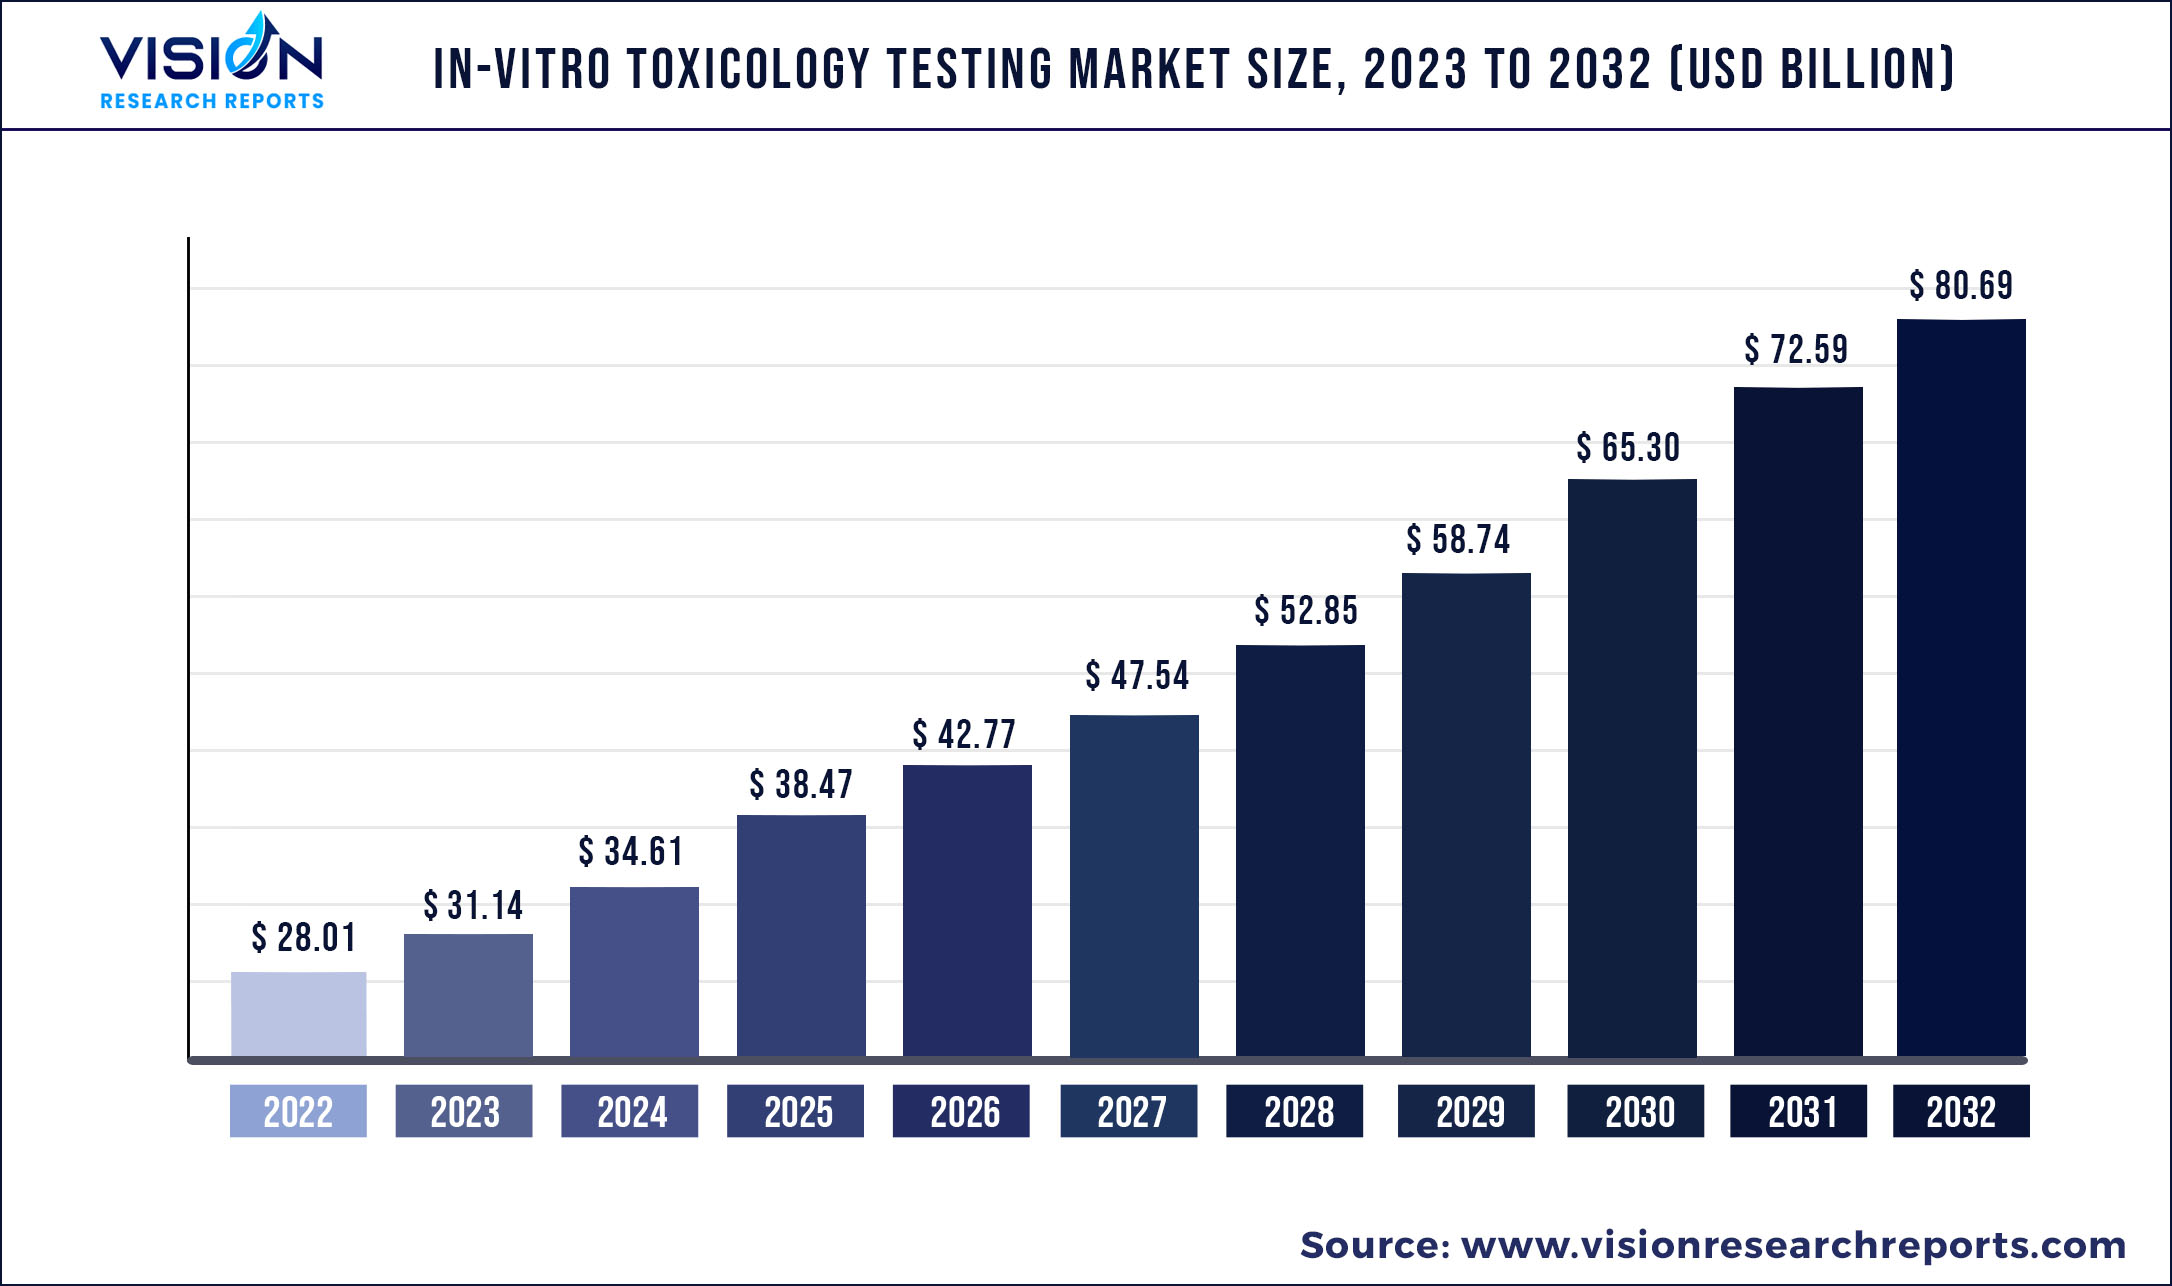
The global in-vitro toxicology testing market was valued at USD 28.01 billion in 2022 and it is predicted to surpass around USD 80.69 billion by 2032 with a CAGR of 11.16% from 2023 to 2032.
Key Pointers
| Report Coverage | Details |
| Market Size in 2022 | USD 28.01 billion |
| Revenue Forecast by 2032 | USD 80.69 billion |
| Growth rate from 2023 to 2032 | CAGR of 11.16% |
| Base Year | 2022 |
| Forecast Period | 2023 to 2032 |
| Regions Covered | North America, Europe, Asia Pacific, Latin America, Middle East & Africa |
| Companies Covered | Charles River Laboratories International, Inc.; SGS S.A.; Merck KGaA; Eurofins Scientific; Abbott Laboratories; Laboratory Corporation of America Holdings; Evotec S.E.; Thermo Fisher Scientific, Inc.; Quest Diagnostics Incorporated; Agilent Technologies, Inc.; Catalent, Inc.; Danaher Corporation; Bio-Rad Laboratories, Inc.; BioIVT; Gentronix |
The major factor boosting the growth of in-vitro toxicology testing market is the developments in toxicology research such as use of 3D in-vitro models. In addition, the higher cost of animal testing to evaluate the toxicity along with the ethical & social concerns for these conventional tests is anticipated to further fuel the market’s growth. The COVID-19 pandemic resulted in limitation of movement and restriction due to which the market observed a short term decline in growth. However, as there were multiple drug discovery processes, various drug development programs & high research activities, the market demand for in-vitro toxicology testing accelerated eventually. The significant contributing reason for this was to minimize the last stage drug failure risk by in-vitro toxicology assays. As per US FDA Coronavirus Treatment Acceleration Program (CTAP), there are more than 700 drug development programs in various stages for COVID-19.This high number of programs is estimated to further increase the demand for in-vitro toxicology testing services.
Increase in government initiatives that are focused on banning animal testing can be attributed to the rise in adoption of in-vitro toxicology testing. Several government bodies’ as well private agencies are involved in offering funding opportunities & programs to research communities for development of in-vitro test approaches. Funding programs are primarily aimed to protect the human health, animal health, and the environment through reducing the reliance on animal models for the safety assessment of new chemical compound and formulations.
The increase in need of in-vitro assays and toxicology testing is coupled with the developments in these assays to evaluate safety of drugs, cosmetics, diagnostics, and other products. This has led several companies to broaden their portfolio of offerings to increase revenue generation and meet the market demand. Moreover, presence of various advanced methods such as in-silico simulated models alongside databases for analysis of vast compounds to understand & study the toxicity is anticipated to attribute to the market growth in the forecasted period.
Regional Insights
North America held the largest revenue share of 47.84% in market during 2022. Owing to the rising government funding for research of therapeutics, increased healthcare expenditure, advanced infrastructure & processes for drug discovery and strong regulatory framework for approval has increased the demand as well as adoption on in-vitro testing methods in this region’s market.
Furthermore, launch of biologics by biopharmaceutical players in North America, particularly the U.S. has driven the adoption of toxicology testing and will contribute to future revenue generation. Presence of multiple government & private agencies for funding programs will also contribute to the fastest growth rate in 2023-2032.
On the other hand, Asia Pacific will also register significant CAGR during the forecast period due to development of health care settings, increased geriatric population in need of medicines, and various government incentives for enhancing technology and development.
In-vitro Toxicology Testing Market Segmentations:
By Technology
By Application
By Method
By End-user
Chapter 1. Introduction
1.1. Research Objective
1.2. Scope of the Study
1.3. Definition
Chapter 2. Research Methodology
2.1. Research Approach
2.2. Data Sources
2.3. Assumptions & Limitations
Chapter 3. Executive Summary
3.1. Market Snapshot
Chapter 4. Market Variables and Scope
4.1. Introduction
4.2. Market Classification and Scope
4.3. Industry Value Chain Analysis
4.3.1. Raw Material Procurement Analysis
4.3.2. Sales and Distribution Channel Analysis
4.3.3. Downstream Buyer Analysis
Chapter 5. COVID 19 Impact on In-vitro Toxicology Testing Market
5.1. COVID-19 Landscape: In-vitro Toxicology Testing Industry Impact
5.2. COVID 19 - Impact Assessment for the Industry
5.3. COVID 19 Impact: Global Major Government Policy
5.4. Market Trends and Opportunities in the COVID-19 Landscape
Chapter 6. Market Dynamics Analysis and Trends
6.1. Market Dynamics
6.1.1. Market Drivers
6.1.2. Market Restraints
6.1.3. Market Opportunities
6.2. Porter’s Five Forces Analysis
6.2.1. Bargaining power of suppliers
6.2.2. Bargaining power of buyers
6.2.3. Threat of substitute
6.2.4. Threat of new entrants
6.2.5. Degree of competition
Chapter 7. Competitive Landscape
7.1.1. Company Market Share/Positioning Analysis
7.1.2. Key Strategies Adopted by Players
7.1.3. Vendor Landscape
7.1.3.1. List of Suppliers
7.1.3.2. List of Buyers
Chapter 8. Global In-vitro Toxicology Testing Market, By Technology
8.1. In-vitro Toxicology Testing Market, by Technology, 2023-2032
8.1.1. Cell Culture Technology
8.1.1.1. Market Revenue and Forecast (2020-2032)
8.1.2. High Throughput Technology
8.1.2.1. Market Revenue and Forecast (2020-2032)
8.1.3. Molecular Imaging
8.1.3.1. Market Revenue and Forecast (2020-2032)
8.1.4. OMICS Technology
8.1.4.1. Market Revenue and Forecast (2020-2032)
Chapter 9. Global In-vitro Toxicology Testing Market, By Application
9.1. In-vitro Toxicology Testing Market, by Application, 2023-2032
9.1.1. Systemic Toxicology
9.1.1.1. Market Revenue and Forecast (2020-2032)
9.1.2. Dermal Toxicity
9.1.2.1. Market Revenue and Forecast (2020-2032)
9.1.3. Endocrine Disruption
9.1.3.1. Market Revenue and Forecast (2020-2032)
9.1.4. Occular Toxicity
9.1.4.1. Market Revenue and Forecast (2020-2032)
9.1.5. Others
9.1.5.1. Market Revenue and Forecast (2020-2032)
Chapter 10. Global In-vitro Toxicology Testing Market, By Method
10.1. In-vitro Toxicology Testing Market, by Method, 2023-2032
10.1.1. Cellular Assay
10.1.1.1. Market Revenue and Forecast (2020-2032)
10.1.2. Biochemical Assay
10.1.2.1. Market Revenue and Forecast (2020-2032)
10.1.3. In-silico
10.1.3.1. Market Revenue and Forecast (2020-2032)
10.1.4. Ex-vivo
10.1.4.1. Market Revenue and Forecast (2020-2032)
Chapter 11. Global In-vitro Toxicology Testing Market, By End-user
11.1. In-vitro Toxicology Testing Market, by End-user, 2023-2032
11.1.1. Pharmaceutical Industry
11.1.1.1. Market Revenue and Forecast (2020-2032)
11.1.2. Cosmetics & Household Products
11.1.2.1. Market Revenue and Forecast (2020-2032)
11.1.3. Academic Institutes & Research Laboratories
11.1.3.1. Market Revenue and Forecast (2020-2032)
11.1.4. Diagnostics
11.1.4.1. Market Revenue and Forecast (2020-2032)
11.1.5. Chemicals Industry
11.1.5.1. Market Revenue and Forecast (2020-2032)
11.1.6. Food Industry
11.1.6.1. Market Revenue and Forecast (2020-2032)
Chapter 12. Global In-vitro Toxicology Testing Market, Regional Estimates and Trend Forecast
12.1. North America
12.1.1. Market Revenue and Forecast, by Technology (2020-2032)
12.1.2. Market Revenue and Forecast, by Application (2020-2032)
12.1.3. Market Revenue and Forecast, by Method (2020-2032)
12.1.4. Market Revenue and Forecast, by End-user (2020-2032)
12.1.5. U.S.
12.1.5.1. Market Revenue and Forecast, by Technology (2020-2032)
12.1.5.2. Market Revenue and Forecast, by Application (2020-2032)
12.1.5.3. Market Revenue and Forecast, by Method (2020-2032)
12.1.5.4. Market Revenue and Forecast, by End-user (2020-2032)
12.1.6. Rest of North America
12.1.6.1. Market Revenue and Forecast, by Technology (2020-2032)
12.1.6.2. Market Revenue and Forecast, by Application (2020-2032)
12.1.6.3. Market Revenue and Forecast, by Method (2020-2032)
12.1.6.4. Market Revenue and Forecast, by End-user (2020-2032)
12.2. Europe
12.2.1. Market Revenue and Forecast, by Technology (2020-2032)
12.2.2. Market Revenue and Forecast, by Application (2020-2032)
12.2.3. Market Revenue and Forecast, by Method (2020-2032)
12.2.4. Market Revenue and Forecast, by End-user (2020-2032)
12.2.5. UK
12.2.5.1. Market Revenue and Forecast, by Technology (2020-2032)
12.2.5.2. Market Revenue and Forecast, by Application (2020-2032)
12.2.5.3. Market Revenue and Forecast, by Method (2020-2032)
12.2.5.4. Market Revenue and Forecast, by End-user (2020-2032)
12.2.6. Germany
12.2.6.1. Market Revenue and Forecast, by Technology (2020-2032)
12.2.6.2. Market Revenue and Forecast, by Application (2020-2032)
12.2.6.3. Market Revenue and Forecast, by Method (2020-2032)
12.2.6.4. Market Revenue and Forecast, by End-user (2020-2032)
12.2.7. France
12.2.7.1. Market Revenue and Forecast, by Technology (2020-2032)
12.2.7.2. Market Revenue and Forecast, by Application (2020-2032)
12.2.7.3. Market Revenue and Forecast, by Method (2020-2032)
12.2.7.4. Market Revenue and Forecast, by End-user (2020-2032)
12.2.8. Rest of Europe
12.2.8.1. Market Revenue and Forecast, by Technology (2020-2032)
12.2.8.2. Market Revenue and Forecast, by Application (2020-2032)
12.2.8.3. Market Revenue and Forecast, by Method (2020-2032)
12.2.8.4. Market Revenue and Forecast, by End-user (2020-2032)
12.3. APAC
12.3.1. Market Revenue and Forecast, by Technology (2020-2032)
12.3.2. Market Revenue and Forecast, by Application (2020-2032)
12.3.3. Market Revenue and Forecast, by Method (2020-2032)
12.3.4. Market Revenue and Forecast, by End-user (2020-2032)
12.3.5. India
12.3.5.1. Market Revenue and Forecast, by Technology (2020-2032)
12.3.5.2. Market Revenue and Forecast, by Application (2020-2032)
12.3.5.3. Market Revenue and Forecast, by Method (2020-2032)
12.3.5.4. Market Revenue and Forecast, by End-user (2020-2032)
12.3.6. China
12.3.6.1. Market Revenue and Forecast, by Technology (2020-2032)
12.3.6.2. Market Revenue and Forecast, by Application (2020-2032)
12.3.6.3. Market Revenue and Forecast, by Method (2020-2032)
12.3.6.4. Market Revenue and Forecast, by End-user (2020-2032)
12.3.7. Japan
12.3.7.1. Market Revenue and Forecast, by Technology (2020-2032)
12.3.7.2. Market Revenue and Forecast, by Application (2020-2032)
12.3.7.3. Market Revenue and Forecast, by Method (2020-2032)
12.3.7.4. Market Revenue and Forecast, by End-user (2020-2032)
12.3.8. Rest of APAC
12.3.8.1. Market Revenue and Forecast, by Technology (2020-2032)
12.3.8.2. Market Revenue and Forecast, by Application (2020-2032)
12.3.8.3. Market Revenue and Forecast, by Method (2020-2032)
12.3.8.4. Market Revenue and Forecast, by End-user (2020-2032)
12.4. MEA
12.4.1. Market Revenue and Forecast, by Technology (2020-2032)
12.4.2. Market Revenue and Forecast, by Application (2020-2032)
12.4.3. Market Revenue and Forecast, by Method (2020-2032)
12.4.4. Market Revenue and Forecast, by End-user (2020-2032)
12.4.5. GCC
12.4.5.1. Market Revenue and Forecast, by Technology (2020-2032)
12.4.5.2. Market Revenue and Forecast, by Application (2020-2032)
12.4.5.3. Market Revenue and Forecast, by Method (2020-2032)
12.4.5.4. Market Revenue and Forecast, by End-user (2020-2032)
12.4.6. North Africa
12.4.6.1. Market Revenue and Forecast, by Technology (2020-2032)
12.4.6.2. Market Revenue and Forecast, by Application (2020-2032)
12.4.6.3. Market Revenue and Forecast, by Method (2020-2032)
12.4.6.4. Market Revenue and Forecast, by End-user (2020-2032)
12.4.7. South Africa
12.4.7.1. Market Revenue and Forecast, by Technology (2020-2032)
12.4.7.2. Market Revenue and Forecast, by Application (2020-2032)
12.4.7.3. Market Revenue and Forecast, by Method (2020-2032)
12.4.7.4. Market Revenue and Forecast, by End-user (2020-2032)
12.4.8. Rest of MEA
12.4.8.1. Market Revenue and Forecast, by Technology (2020-2032)
12.4.8.2. Market Revenue and Forecast, by Application (2020-2032)
12.4.8.3. Market Revenue and Forecast, by Method (2020-2032)
12.4.8.4. Market Revenue and Forecast, by End-user (2020-2032)
12.5. Latin America
12.5.1. Market Revenue and Forecast, by Technology (2020-2032)
12.5.2. Market Revenue and Forecast, by Application (2020-2032)
12.5.3. Market Revenue and Forecast, by Method (2020-2032)
12.5.4. Market Revenue and Forecast, by End-user (2020-2032)
12.5.5. Brazil
12.5.5.1. Market Revenue and Forecast, by Technology (2020-2032)
12.5.5.2. Market Revenue and Forecast, by Application (2020-2032)
12.5.5.3. Market Revenue and Forecast, by Method (2020-2032)
12.5.5.4. Market Revenue and Forecast, by End-user (2020-2032)
12.5.6. Rest of LATAM
12.5.6.1. Market Revenue and Forecast, by Technology (2020-2032)
12.5.6.2. Market Revenue and Forecast, by Application (2020-2032)
12.5.6.3. Market Revenue and Forecast, by Method (2020-2032)
12.5.6.4. Market Revenue and Forecast, by End-user (2020-2032)
Chapter 13. Company Profiles
13.1. Charles River Laboratories International, Inc.
13.1.1. Company Overview
13.1.2. Product Offerings
13.1.3. Financial Performance
13.1.4. Recent Initiatives
13.2. SGS S.A.
13.2.1. Company Overview
13.2.2. Product Offerings
13.2.3. Financial Performance
13.2.4. Recent Initiatives
13.3. Merck KGaA
13.3.1. Company Overview
13.3.2. Product Offerings
13.3.3. Financial Performance
13.3.4. Recent Initiatives
13.4. Eurofins Scientific
13.4.1. Company Overview
13.4.2. Product Offerings
13.4.3. Financial Performance
13.4.4. Recent Initiatives
13.5. Abbott Laboratories
13.5.1. Company Overview
13.5.2. Product Offerings
13.5.3. Financial Performance
13.5.4. Recent Initiatives
13.6. Laboratory Corporation of America Holdings
13.6.1. Company Overview
13.6.2. Product Offerings
13.6.3. Financial Performance
13.6.4. Recent Initiatives
13.7. Evotec S.E.
13.7.1. Company Overview
13.7.2. Product Offerings
13.7.3. Financial Performance
13.7.4. Recent Initiatives
13.8. Thermo Fisher Scientific, Inc.
13.8.1. Company Overview
13.8.2. Product Offerings
13.8.3. Financial Performance
13.8.4. Recent Initiatives
13.9. Quest Diagnostics Incorporated
13.9.1. Company Overview
13.9.2. Product Offerings
13.9.3. Financial Performance
13.9.4. Recent Initiatives
13.10. Agilent Technologies, Inc.
13.10.1. Company Overview
13.10.2. Product Offerings
13.10.3. Financial Performance
13.10.4. Recent Initiatives
Chapter 14. Research Methodology
14.1. Primary Research
14.2. Secondary Research
14.3. Assumptions
Chapter 15. Appendix
15.1. About Us
15.2. Glossary of Terms
 Cross-segment Market Size and Analysis for
Mentioned Segments
Additional Company Profiles (Upto 5 With No Cost)
Additional Countries (Apart From Mentioned Countries)
Country/Region-specific Report
Go To Market Strategy
Region Specific Market DynamicsRegion Level Market Share Import Export AnalysisProduction AnalysisOthers
Cross-segment Market Size and Analysis for
Mentioned Segments
Additional Company Profiles (Upto 5 With No Cost)
Additional Countries (Apart From Mentioned Countries)
Country/Region-specific Report
Go To Market Strategy
Region Specific Market DynamicsRegion Level Market Share Import Export AnalysisProduction AnalysisOthers