Induced Pluripotent Stem Cells Production Market Size, Share, Growth, Trends, Forecast 2023 to 2032
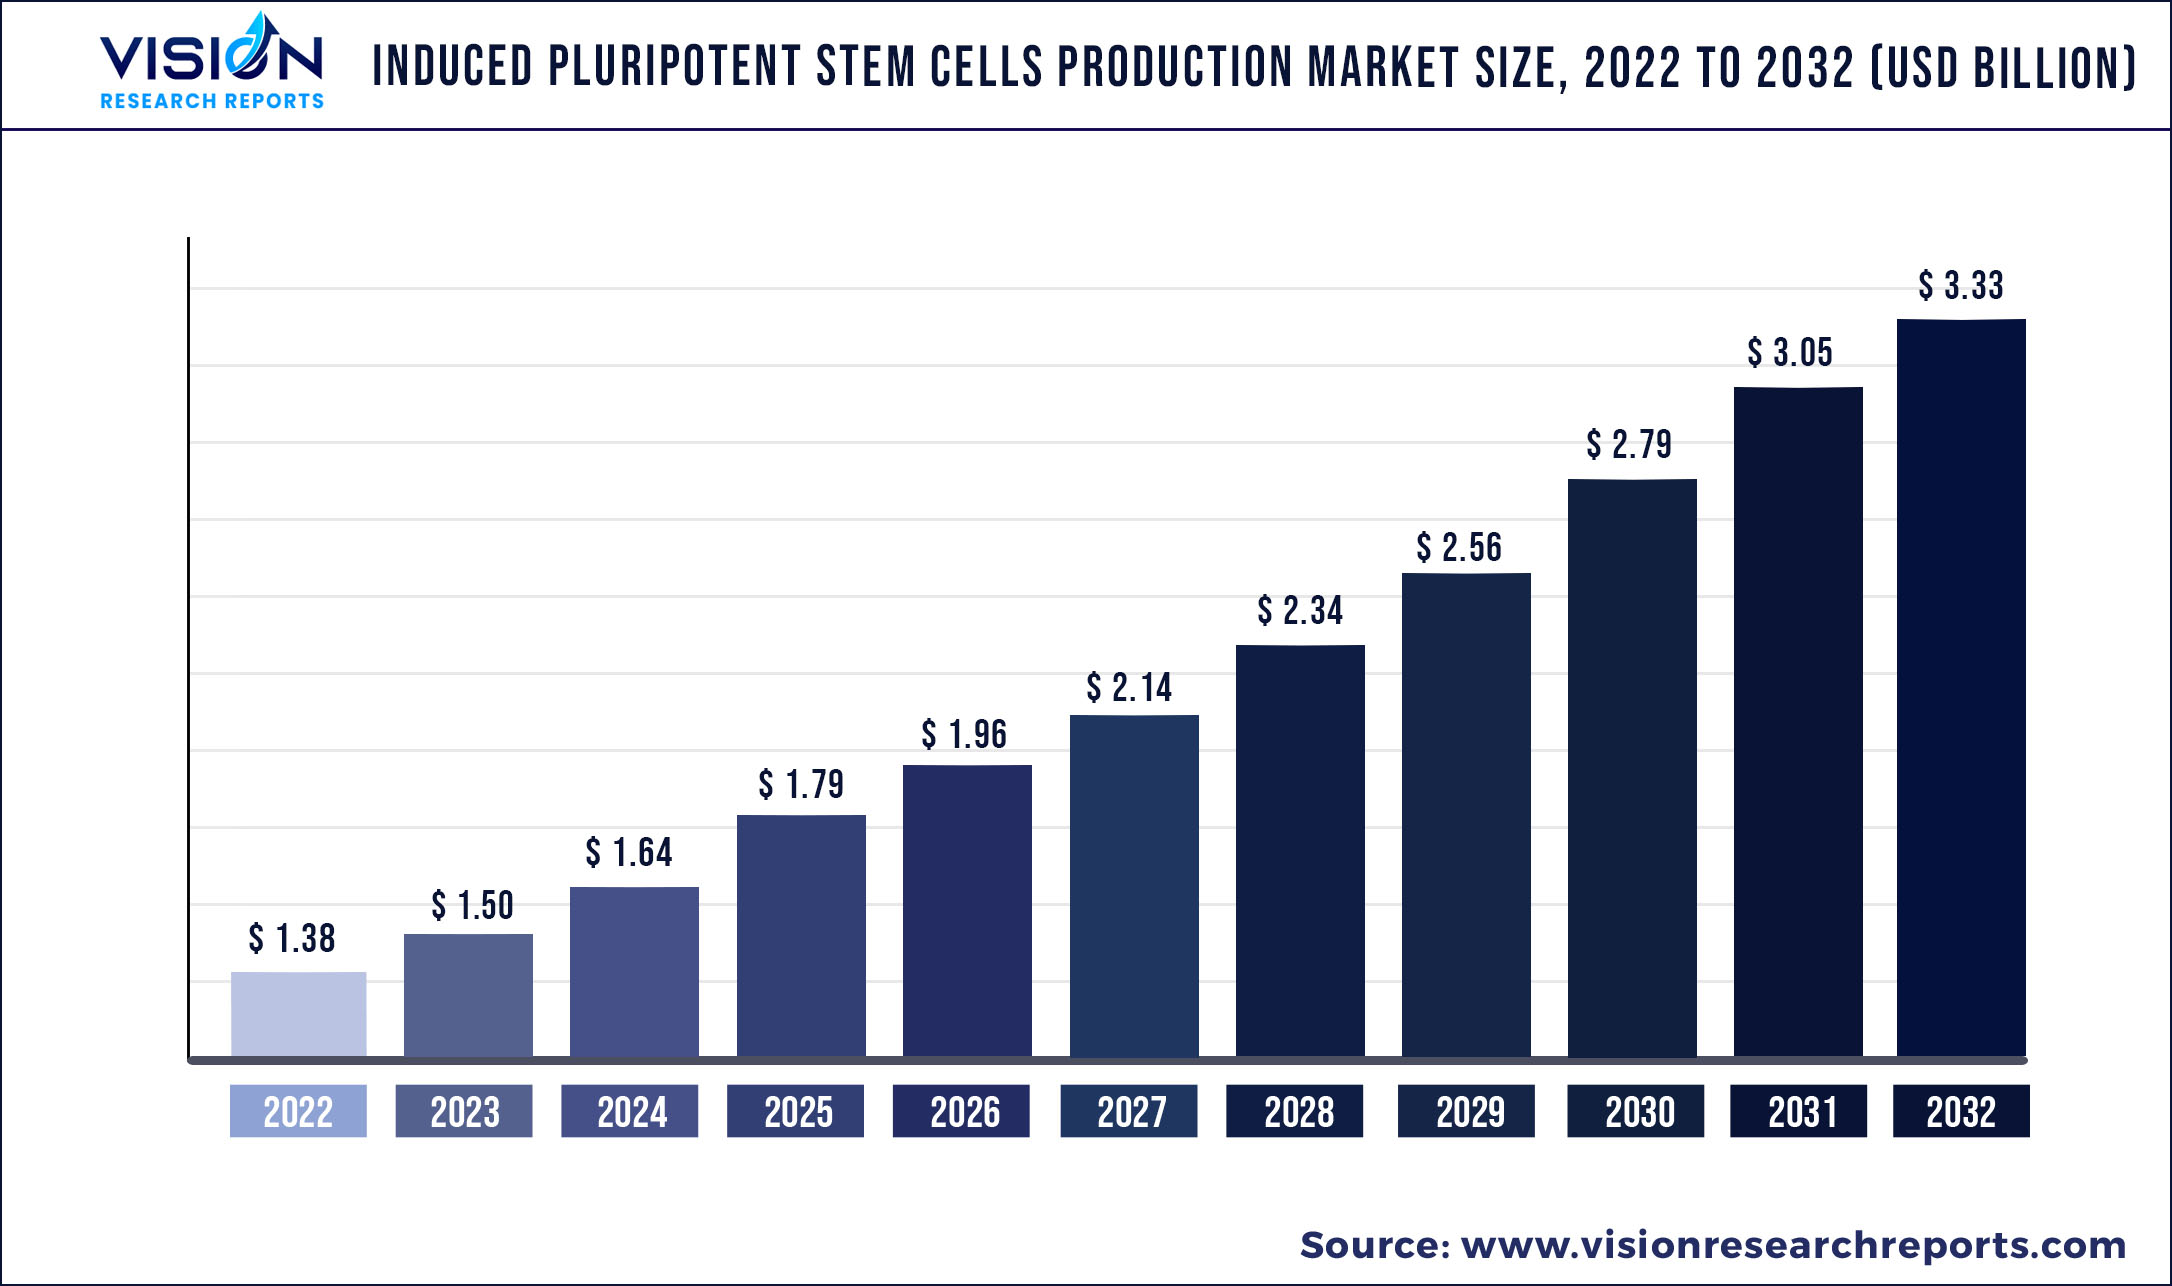
The global induced pluripotent stem cells production market was valued at USD 1.38 billion in 2022 and it is predicted to surpass around USD 3.33 billion by 2032 with a CAGR of 9.24% from 2023 to 2032.
Key Pointers
| Report Coverage | Details |
| Market Size in 2022 | USD 1.38 billion |
| Revenue Forecast by 2032 | USD 3.33 billion |
| Growth rate from 2023 to 2032 | CAGR of 9.24% |
| Base Year | 2022 |
| Forecast Period | 2023 to 2032 |
| Regions Covered | North America, Europe, Asia Pacific, Latin America, Middle East & Africa |
| Companies Covered | Lonza; Axol Biosciences Ltd.; Evotec SE; Hitachi Ltd.; Merck KGaA; REPROCELLS, Inc.; Fate Therapeutics; Thermo Fisher Scientific, Inc.; StemCellsFactory III; Applied StemCells, Inc. |
The potential of stem cell-based therapies, increasing capital investments for stem cell-based research, the growing incidence of cancer, and multiple advantages of induced pluripotent stem cells (iPSCs) over Embryonic Stem Cells (ESCs) are driving the market growth significantly. The increase in research activities during the COVID-19 pandemic also boosted iPSCs-based research activities. The continuous strive by scientists to develop novel treatment and therapies to manage the SARS CoV-2 infection have driven the demand for iPSCs as research tools. In addition, as induced pluripotent stem cells are capable of generating physiologically similar organ models or organoids, these cells can be used to understand the pathophysiology of the virus infection in humans.
For example, in a October 2022 published article, researchers from Japan tried to understand the role of salivary glands during COVID-19 infection. The researchers used human iPSCs to generate Human Induced Salivary Glands (hiSGs) to assess the role of salivary glands as virus reservoirs. As per the authors of this research article, hiSGs can prove to be a promising in-vitro model for future investigation. This further aid the understanding of SARS CoV-2 infection spread, thereby driving the demand for induced pluripotent stem cells as a powerful research tool in the future.
The increase in the number of induced pluripotent stem cells based research studies is expanding the market growth drastically. Currently, there are more than 120 clinical trials underway which utilize iPSCs for disease intervention or the generation of iPSCs products. In addition, the advantages offered by induced pluripotent stem cells such as the elimination of animal models and flexibility of ethical implications associated with embryonic stem cells further propel the market growth. This has created a favorable market for iPSCs-based therapeutics from many business entities.
A significant number of companies and research organizations are discovering the therapeutic potency of stem cell products and targeting diseases with cell-based therapeutics. For example, in June 2021 Novo Nordisk A/S announced a global collaborative effort with Heartseed Inc., an iPSC-producing startup in Japan. Through this collaboration, the company develops, manufactures, and commercializes HS-001, which are purified cardiomyocytes derived from iPSCs. HS-001 is an investigated cell therapy for heart failure.
The manufacturing process for the production of induced pluripotent stem cells is relatively long. The induced pluripotent stem cells may exhibit loss of heterozygosity, chromosomal instability, and genetic instability over a cultured in-vitro. Furthermore, the high costs associated with iPSC production as well as immunogenicity and heterogeneity issues also make a negative impact on market demand.
Induced Pluripotent Stem Cells Production Market Segmentations:
| By Process | By Workflow | By Product | By Application | By End-user |
|
Manual iPSC Production Process Automated iPSC Production Process |
Reprogramming Cell Culture Cell Characterization / Analysis Engineering Others |
Instruments/ Devices Automated Platforms Consumables & Kits Services |
Drug Development & Discovery Regenerative Medicine Toxicology Studies Others |
Research & Academic Institutes Biotechnology & Pharmaceutical Companies Hospitals & Clinics |
Chapter 1. Introduction
1.1. Research Objective
1.2. Scope of the Study
1.3. Definition
Chapter 2. Research Methodology
2.1. Research Approach
2.2. Data Sources
2.3. Assumptions & Limitations
Chapter 3. Executive Summary
3.1. Market Snapshot
Chapter 4. Market Variables and Scope
4.1. Introduction
4.2. Market Classification and Scope
4.3. Industry Value Chain Analysis
4.3.1. Raw Material Procurement Analysis
4.3.2. Sales and Distribution Channel Analysis
4.3.3. Downstream Buyer Analysis
Chapter 5. COVID 19 Impact on Induced Pluripotent Stem Cells Production Market
5.1. COVID-19 Landscape: Induced Pluripotent Stem Cells Production Industry Impact
5.2. COVID 19 - Impact Assessment for the Industry
5.3. COVID 19 Impact: Global Major Government Policy
5.4. Market Trends and Opportunities in the COVID-19 Landscape
Chapter 6. Market Dynamics Analysis and Trends
6.1. Market Dynamics
6.1.1. Market Drivers
6.1.2. Market Restraints
6.1.3. Market Opportunities
6.2. Porter’s Five Forces Analysis
6.2.1. Bargaining power of suppliers
6.2.2. Bargaining power of buyers
6.2.3. Threat of substitute
6.2.4. Threat of new entrants
6.2.5. Degree of competition
Chapter 7. Competitive Landscape
7.1.1. Company Market Share/Positioning Analysis
7.1.2. Key Strategies Adopted by Players
7.1.3. Vendor Landscape
7.1.3.1. List of Suppliers
7.1.3.2. List of Buyers
Chapter 8. Global Induced Pluripotent Stem Cells Production Market, By Process
8.1. Induced Pluripotent Stem Cells Production Market, by Process, 2023-2032
8.1.1. Manual iPSC Production Process
8.1.1.1. Market Revenue and Forecast (2019-2032)
8.1.2. Automated iPSC Production Process
8.1.2.1. Market Revenue and Forecast (2019-2032)
Chapter 9. Global Induced Pluripotent Stem Cells Production Market, By Workflow
9.1. Induced Pluripotent Stem Cells Production Market, by Workflow, 2023-2032
9.1.1. Reprogramming
9.1.1.1. Market Revenue and Forecast (2019-2032)
9.1.2. Cell Culture
9.1.2.1. Market Revenue and Forecast (2019-2032)
9.1.3. Cell Characterization / Analysis
9.1.3.1. Market Revenue and Forecast (2019-2032)
9.1.4. Engineering
9.1.4.1. Market Revenue and Forecast (2019-2032)
9.1.5. Others
9.1.5.1. Market Revenue and Forecast (2019-2032)
Chapter 10. Global Induced Pluripotent Stem Cells Production Market, By Product
10.1. Induced Pluripotent Stem Cells Production Market, by Product, 2023-2032
10.1.1. Instruments/ Devices
10.1.1.1. Market Revenue and Forecast (2019-2032)
10.1.2. Automated Platforms
10.1.2.1. Market Revenue and Forecast (2019-2032)
10.1.3. Consumables & Kits
10.1.3.1. Market Revenue and Forecast (2019-2032)
10.1.4. Services
10.1.4.1. Market Revenue and Forecast (2019-2032)
Chapter 11. Global Induced Pluripotent Stem Cells Production Market, By Application
11.1. Induced Pluripotent Stem Cells Production Market, by Application, 2023-2032
11.1.1. Drug Development & Discovery
11.1.1.1. Market Revenue and Forecast (2019-2032)
11.1.2. Regenerative Medicine
11.1.2.1. Market Revenue and Forecast (2019-2032)
11.1.3. Toxicology Studies
11.1.3.1. Market Revenue and Forecast (2019-2032)
11.1.4. Others
11.1.4.1. Market Revenue and Forecast (2019-2032)
Chapter 12. Global Induced Pluripotent Stem Cells Production Market, By End-user
12.1. Induced Pluripotent Stem Cells Production Market, by End-user, 2023-2032
12.1.1. Research & Academic Institutes
12.1.1.1. Market Revenue and Forecast (2019-2032)
12.1.2. Biotechnology & Pharmaceutical Companies
12.1.2.1. Market Revenue and Forecast (2019-2032)
12.1.3. Hospitals & Clinics
12.1.3.1. Market Revenue and Forecast (2019-2032)
Chapter 13. Global Induced Pluripotent Stem Cells Production Market, Regional Estimates and Trend Forecast
13.1. North America
13.1.1. Market Revenue and Forecast, by Process (2019-2032)
13.1.2. Market Revenue and Forecast, by Workflow (2019-2032)
13.1.3. Market Revenue and Forecast, by Product (2019-2032)
13.1.4. Market Revenue and Forecast, by Application (2019-2032)
13.1.5. Market Revenue and Forecast, by End-user (2019-2032)
13.1.6. U.S.
13.1.6.1. Market Revenue and Forecast, by Process (2019-2032)
13.1.6.2. Market Revenue and Forecast, by Workflow (2019-2032)
13.1.6.3. Market Revenue and Forecast, by Product (2019-2032)
13.1.6.4. Market Revenue and Forecast, by Application (2019-2032)
13.1.7. Market Revenue and Forecast, by End-user (2019-2032)
13.1.8. Rest of North America
13.1.8.1. Market Revenue and Forecast, by Process (2019-2032)
13.1.8.2. Market Revenue and Forecast, by Workflow (2019-2032)
13.1.8.3. Market Revenue and Forecast, by Product (2019-2032)
13.1.8.4. Market Revenue and Forecast, by Application (2019-2032)
13.1.8.5. Market Revenue and Forecast, by End-user (2019-2032)
13.2. Europe
13.2.1. Market Revenue and Forecast, by Process (2019-2032)
13.2.2. Market Revenue and Forecast, by Workflow (2019-2032)
13.2.3. Market Revenue and Forecast, by Product (2019-2032)
13.2.4. Market Revenue and Forecast, by Application (2019-2032)
13.2.5. Market Revenue and Forecast, by End-user (2019-2032)
13.2.6. UK
13.2.6.1. Market Revenue and Forecast, by Process (2019-2032)
13.2.6.2. Market Revenue and Forecast, by Workflow (2019-2032)
13.2.6.3. Market Revenue and Forecast, by Product (2019-2032)
13.2.7. Market Revenue and Forecast, by Application (2019-2032)
13.2.8. Market Revenue and Forecast, by End-user (2019-2032)
13.2.9. Germany
13.2.9.1. Market Revenue and Forecast, by Process (2019-2032)
13.2.9.2. Market Revenue and Forecast, by Workflow (2019-2032)
13.2.9.3. Market Revenue and Forecast, by Product (2019-2032)
13.2.10. Market Revenue and Forecast, by Application (2019-2032)
13.2.11. Market Revenue and Forecast, by End-user (2019-2032)
13.2.12. France
13.2.12.1. Market Revenue and Forecast, by Process (2019-2032)
13.2.12.2. Market Revenue and Forecast, by Workflow (2019-2032)
13.2.12.3. Market Revenue and Forecast, by Product (2019-2032)
13.2.12.4. Market Revenue and Forecast, by Application (2019-2032)
13.2.13. Market Revenue and Forecast, by End-user (2019-2032)
13.2.14. Rest of Europe
13.2.14.1. Market Revenue and Forecast, by Process (2019-2032)
13.2.14.2. Market Revenue and Forecast, by Workflow (2019-2032)
13.2.14.3. Market Revenue and Forecast, by Product (2019-2032)
13.2.14.4. Market Revenue and Forecast, by Application (2019-2032)
13.2.15. Market Revenue and Forecast, by End-user (2019-2032)
13.3. APAC
13.3.1. Market Revenue and Forecast, by Process (2019-2032)
13.3.2. Market Revenue and Forecast, by Workflow (2019-2032)
13.3.3. Market Revenue and Forecast, by Product (2019-2032)
13.3.4. Market Revenue and Forecast, by Application (2019-2032)
13.3.5. Market Revenue and Forecast, by End-user (2019-2032)
13.3.6. India
13.3.6.1. Market Revenue and Forecast, by Process (2019-2032)
13.3.6.2. Market Revenue and Forecast, by Workflow (2019-2032)
13.3.6.3. Market Revenue and Forecast, by Product (2019-2032)
13.3.6.4. Market Revenue and Forecast, by Application (2019-2032)
13.3.7. Market Revenue and Forecast, by End-user (2019-2032)
13.3.8. China
13.3.8.1. Market Revenue and Forecast, by Process (2019-2032)
13.3.8.2. Market Revenue and Forecast, by Workflow (2019-2032)
13.3.8.3. Market Revenue and Forecast, by Product (2019-2032)
13.3.8.4. Market Revenue and Forecast, by Application (2019-2032)
13.3.9. Market Revenue and Forecast, by End-user (2019-2032)
13.3.10. Japan
13.3.10.1. Market Revenue and Forecast, by Process (2019-2032)
13.3.10.2. Market Revenue and Forecast, by Workflow (2019-2032)
13.3.10.3. Market Revenue and Forecast, by Product (2019-2032)
13.3.10.4. Market Revenue and Forecast, by Application (2019-2032)
13.3.10.5. Market Revenue and Forecast, by End-user (2019-2032)
13.3.11. Rest of APAC
13.3.11.1. Market Revenue and Forecast, by Process (2019-2032)
13.3.11.2. Market Revenue and Forecast, by Workflow (2019-2032)
13.3.11.3. Market Revenue and Forecast, by Product (2019-2032)
13.3.11.4. Market Revenue and Forecast, by Application (2019-2032)
13.3.11.5. Market Revenue and Forecast, by End-user (2019-2032)
13.4. MEA
13.4.1. Market Revenue and Forecast, by Process (2019-2032)
13.4.2. Market Revenue and Forecast, by Workflow (2019-2032)
13.4.3. Market Revenue and Forecast, by Product (2019-2032)
13.4.4. Market Revenue and Forecast, by Application (2019-2032)
13.4.5. Market Revenue and Forecast, by End-user (2019-2032)
13.4.6. GCC
13.4.6.1. Market Revenue and Forecast, by Process (2019-2032)
13.4.6.2. Market Revenue and Forecast, by Workflow (2019-2032)
13.4.6.3. Market Revenue and Forecast, by Product (2019-2032)
13.4.6.4. Market Revenue and Forecast, by Application (2019-2032)
13.4.7. Market Revenue and Forecast, by End-user (2019-2032)
13.4.8. North Africa
13.4.8.1. Market Revenue and Forecast, by Process (2019-2032)
13.4.8.2. Market Revenue and Forecast, by Workflow (2019-2032)
13.4.8.3. Market Revenue and Forecast, by Product (2019-2032)
13.4.8.4. Market Revenue and Forecast, by Application (2019-2032)
13.4.9. Market Revenue and Forecast, by End-user (2019-2032)
13.4.10. South Africa
13.4.10.1. Market Revenue and Forecast, by Process (2019-2032)
13.4.10.2. Market Revenue and Forecast, by Workflow (2019-2032)
13.4.10.3. Market Revenue and Forecast, by Product (2019-2032)
13.4.10.4. Market Revenue and Forecast, by Application (2019-2032)
13.4.10.5. Market Revenue and Forecast, by End-user (2019-2032)
13.4.11. Rest of MEA
13.4.11.1. Market Revenue and Forecast, by Process (2019-2032)
13.4.11.2. Market Revenue and Forecast, by Workflow (2019-2032)
13.4.11.3. Market Revenue and Forecast, by Product (2019-2032)
13.4.11.4. Market Revenue and Forecast, by Application (2019-2032)
13.4.11.5. Market Revenue and Forecast, by End-user (2019-2032)
13.5. Latin America
13.5.1. Market Revenue and Forecast, by Process (2019-2032)
13.5.2. Market Revenue and Forecast, by Workflow (2019-2032)
13.5.3. Market Revenue and Forecast, by Product (2019-2032)
13.5.4. Market Revenue and Forecast, by Application (2019-2032)
13.5.5. Market Revenue and Forecast, by End-user (2019-2032)
13.5.6. Brazil
13.5.6.1. Market Revenue and Forecast, by Process (2019-2032)
13.5.6.2. Market Revenue and Forecast, by Workflow (2019-2032)
13.5.6.3. Market Revenue and Forecast, by Product (2019-2032)
13.5.6.4. Market Revenue and Forecast, by Application (2019-2032)
13.5.7. Market Revenue and Forecast, by End-user (2019-2032)
13.5.8. Rest of LATAM
13.5.8.1. Market Revenue and Forecast, by Process (2019-2032)
13.5.8.2. Market Revenue and Forecast, by Workflow (2019-2032)
13.5.8.3. Market Revenue and Forecast, by Product (2019-2032)
13.5.8.4. Market Revenue and Forecast, by Application (2019-2032)
13.5.8.5. Market Revenue and Forecast, by End-user (2019-2032)
Chapter 14. Company Profiles
14.1. Lonza
14.1.1. Company Overview
14.1.2. Product Offerings
14.1.3. Financial Performance
14.1.4. Recent Initiatives
14.2. Axol Biosciences Ltd.
14.2.1. Company Overview
14.2.2. Product Offerings
14.2.3. Financial Performance
14.2.4. Recent Initiatives
14.3. Evotec SE
14.3.1. Company Overview
14.3.2. Product Offerings
14.3.3. Financial Performance
14.3.4. Recent Initiatives
14.4. Hitachi Ltd.
14.4.1. Company Overview
14.4.2. Product Offerings
14.4.3. Financial Performance
14.4.4. Recent Initiatives
14.5. Merck KGaA
14.5.1. Company Overview
14.5.2. Product Offerings
14.5.3. Financial Performance
14.5.4. Recent Initiatives
14.6. REPROCELLS, Inc.
14.6.1. Company Overview
14.6.2. Product Offerings
14.6.3. Financial Performance
14.6.4. Recent Initiatives
14.7. Fate Therapeutics
14.7.1. Company Overview
14.7.2. Product Offerings
14.7.3. Financial Performance
14.7.4. Recent Initiatives
14.8. Thermo Fisher Scientific, Inc.
14.8.1. Company Overview
14.8.2. Product Offerings
14.8.3. Financial Performance
14.8.4. Recent Initiatives
14.9. StemCellsFactory III
14.9.1. Company Overview
14.9.2. Product Offerings
14.9.3. Financial Performance
14.9.4. Recent Initiatives
14.10. Applied StemCells, Inc.
14.10.1. Company Overview
14.10.2. Product Offerings
14.10.3. Financial Performance
14.10.4. Recent Initiatives
Chapter 15. Research Methodology
15.1. Primary Research
15.2. Secondary Research
15.3. Assumptions
Chapter 16. Appendix
16.1. About Us
16.2. Glossary of Terms
 Cross-segment Market Size and Analysis for
Mentioned Segments
Additional Company Profiles (Upto 5 With No Cost)
Additional Countries (Apart From Mentioned Countries)
Country/Region-specific Report
Go To Market Strategy
Region Specific Market DynamicsRegion Level Market Share Import Export AnalysisProduction AnalysisOthers
Cross-segment Market Size and Analysis for
Mentioned Segments
Additional Company Profiles (Upto 5 With No Cost)
Additional Countries (Apart From Mentioned Countries)
Country/Region-specific Report
Go To Market Strategy
Region Specific Market DynamicsRegion Level Market Share Import Export AnalysisProduction AnalysisOthers