Industrial Display Market Size, Growth, Trends | Report 2023-2032
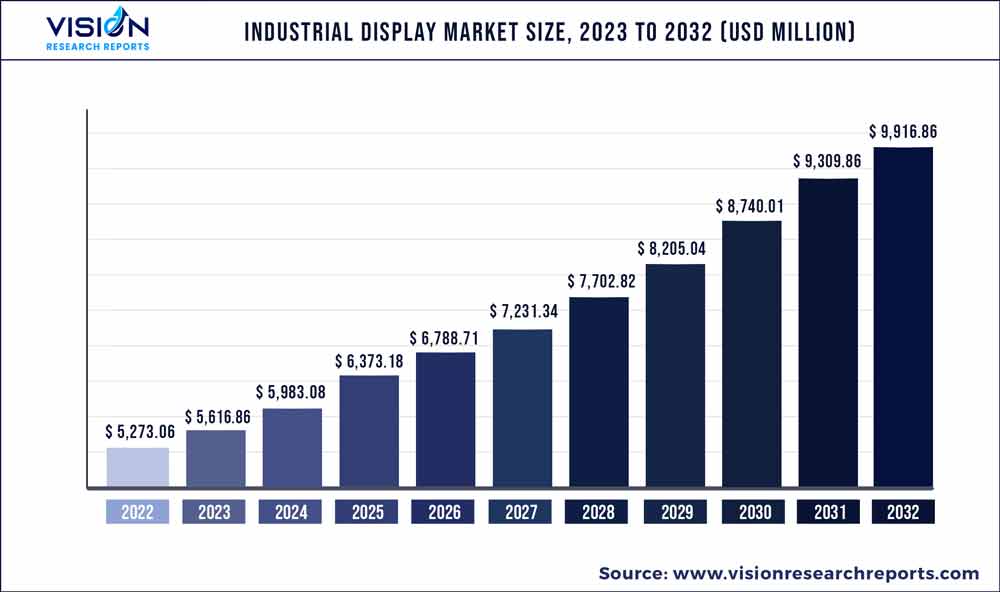
The global industrial display market was surpassed at USD 5,273.06 million in 2022 and is expected to hit around USD 9,916.86 million by 2032, growing at a CAGR of 6.52% from 2023 to 2032.
Key Pointers
Report Scope of the Industrial Display Market
| Report Coverage | Details |
| Market Size in 2022 | USD 5,273.06 million |
| Revenue Forecast by 2032 | USD 9,916.86 million |
| Growth rate from 2023 to 2032 | CAGR of 6.52% |
| Base Year | 2022 |
| Forecast Period | 2023 to 2032 |
| Market Analysis (Terms Used) | Value (US$ Million/Billion) or (Volume/Units) |
| Regions Covered | North America, Europe, Asia Pacific, Latin America, Middle East & Africa |
| Companies Covered | LG Display Co., Ltd.; Samsung Display; Pepperl+Fuchs GmbH; Advantech Co., Ltd.; Planar Systems, Inc.; WinMate, Inc.; Sharp NEC Display Solutions; Maple Systems, Inc.; Japan Display, Inc.; Innolux Corporation; Siemens AG |
As industrial operations and processes have become more complicated, industrial displays have become essential for streamlining operational tasks and providing improved functionality.
The global industrial display industry greatly benefits from the increasing demand for Human Machine Interface (HMI) applications in the manufacturing and process industries. HMIs and other screens enable monitoring production operations effectively, cutting down on downtime and raising worker productivity. The market is growing due to the increased demand for digital signage applications across several industry verticals. The capacity of HMI-enabled industrial displays to give real-time data on crucial parameters, enabling operators to make data-driven decisions rapidly, is one of their main advantages.
OLED displays are anticipated to become more popular due to their improved picture quality and reduced power usage. Digital signs and display boards that demonstrate the operational status on industrial floors frequently utilize this technology. Solution providers have started to offer IIoT application platforms with devices and services for industrial displays. For example, American Industrial Systems, Inc. (AIS) provides open-platform computing solutions for IIoT, making it easier for industrial businesses, factories, transportation & logistics, buildings, and smart cities to use these solutions.
The industrial sector is continuously developing and adapting to meet changing requirements, fueled by technological advancements. Cutting-edge innovations in this sector include technologies like Thin-Film-Transistor (TFT) Liquid Crystal Display (LCD), Low-Temperature Poly-Silicon (LTPS), Digital Light Processing (DLP), and Color Filter (CF). The demand for multi-functional Human-Machine Interfaces (HMIs) and intelligent touch screen displays continues to fuel the technological progress and innovation.
Nevertheless, regulations overseeing the production and distribution of industrial displays can vary by region and country. For example, the European Union's Law on the Restriction of Hazardous Substances (RoHS) prohibits the use of cadmium, lead, mercury, hexavalent chromium, and flame retardants such as Polybrominated Diphenyl Ethers (PBDE) or Polybrominated Biphenyls (PBB) in electronic equipment.
Type Insights
Based on type, the market is classified into rugged displays, open frame monitors, panel-mount monitors, marine displays, and video walls. Among these, the panel-mount monitor type segment dominated the market in 2022, accounting for a market share of 31.28%. Panel-mount monitors are industrial displays made to be put directly into a control panel or enclosure. They are often manufactured with a rugged shell, bezel, and mounting brackets to survive harsh industrial conditions and offer a secure and sturdy installation.
The sizes and resolutions of panel-mount monitors range from tiny displays for embedded systems to large panels for process control applications. They may additionally have touchscreen functionality, high brightness, and several interface options to support numerous industrial applications. Panel-mount monitors are frequently used in manufacturing, automation, and process control applications, where reliable and durable equipment is essential for the best performance and safety. They can also be found in transportation, defense, and aerospace applications where resistance to shock and vibration is essential.
The open frame monitors segment is anticipated to witness the fastest growth, growing at a CAGR of 7.85% throughout the forecast period. Industrial displays without a bezel or casing are known as open-frame monitors. They comprise of a metal frame, a display panel, electronics, and interface connectors. This frame is a popular option for industrial and commercial applications that demand flexibility and customization since it can be easily integrated into custom enclosures, kiosks, or other machinery. Widescreen formats are available on open-frame displays, which typically have a sleek style and come in various sizes and resolutions. They also feature touchscreen capabilities and great brightness for the best visibility under varied lighting conditions. Gaming machines, self-service kiosks, ATMs, digital signage, and industrial automation equipment are examples of applications where open-frame monitors are frequently employed.
Application Insights
In terms of application, the market is classified into the human-machine interface (HMI), remote monitoring, interactive display, and digital signage. The HMI segment dominated the overall market, gaining a market share of 34.03% in 2022. It is expected to grow at a CAGR of 5.94% during the forecast period. An HMI display is a visual display employed in industrial automation systems to give users and operators real-time information. These displays frequently employ cutting-edge technologies like touchscreens, high-resolution graphics, and tough designs to resist severe industrial conditions.
Typically, HMI displays are used to monitor and manage various industrial operations, including production lines, assembly lines, and power generation facilities. They give operators access to real-time data on the condition of the monitored process, including temperature, pressure, flow rate, and other relevant aspects. HMI industrial displays can be used alone or with other industrial automation components like programmable logic controllers (PLC) or supervisory control and data acquisition (SCADA) systems to form a more comprehensive solution. They are made to be simple to use with simple, user-friendly interfaces and legible, easy-to-read visuals and displays.
The interactive display segment is anticipated to witness the fastest growth, growing at a CAGR of 7.75% throughout the forecast period. An interactive display lets viewers engage with digital content using touch, gestures, or other input techniques. It typically consists of a display screen, sensors, and software to allow users to interact or traverse digital content on the screen. Users can engage with digital content on interactive displays by using several input devices, such as touchscreens, styluses, or motion sensors. They might also contain software programs that offer extra features, like augmented reality applications, virtual whiteboards, and collaborative workplaces.
Applications for interactive displays in industrial environments include monitoring and managing assembly lines, production operations, and power generation facilities. They provide operators with real-time information on the status of the monitored process, allowing them to adjust and control the process as needed. Interactive Displays in industrial settings typically use touchscreens or other input methods to enable operators to interact with the system. They may also include software applications that provide additional functionality, such as real-time data visualization, remote monitoring, and diagnostic tools.
Technology Insights
In terms of technology, the market is classified into light-emitting diode (LED), e-paper, liquid crystal display (LCD), and organic light-emitting diode (OLED). The LCD segment dominated the market, gaining a market share of 37.97% in 2022, and is likely to register a CAGR of 5.63% during the forecast period. A liquid crystal display (LCD) is a flat panel display that generates images using liquid crystals. LCDs are widely utilized in various industrial applications, such as instrumentation and control panels, medical equipment, automobile displays, and many more. High brightness, a thin profile, and low power consumption are all characteristics of LCDs. They can be used in applications where numerous users must view the display simultaneously because they also have a broad viewing angle. These displays provide more dependability, toughness, and versatility in extreme environments.
The e-paper segment is anticipated to witness the fastest growth, growing at a CAGR of 7.95% throughout the forecast period. Electronic paper, often known as an e-paper or an e-ink display, is a display technology that resembles the look of ink on paper. E-readers, electronic shelf labels, and digital signage are just a few examples of industrial applications that frequently use e-paper displays. These displays are renowned for their great contrast, low power usage, and sunlight readability.
E-paper displays have several benefits, one of which is their low power consumption, enabling them to run for extended periods on a single battery charge. They are appropriate for applications where battery life and power conservation are important considerations because they also offer a broad viewing angle and can retain an image without electricity. E-paper comes in various sizes and shapes, and it can also be flexible or even translucent, opening up new creative opportunities. Unfortunately, they are inappropriate for applications needing color displays or quick refresh rates.
Panel Size Insights
In terms of panel size, the market is classified into up to 14", 14"-21", 21"-40", and 40" and above. The 14"-21" segment dominated the market, gaining a market share of 33.68% in 2022. The segment promises to register a CAGR of 5.92% during the forecast period. This category includes displays with a diagonal screen size between 14 and 21 inches. They are commonly used in industrial applications such as human-machine interfaces, point-of-sale systems, and kiosks.
Rising demand for handheld devices, tablets, and touch screens with rugged capabilities has propelled the demand for the 14”-21” segment. Moreover, the 14”-21” panel size is ideal for daily industrial operations and factory applications and generally includes TFT, LCD, or plasma technologies. These displays are designed to protect computers and screens from physical impact, dust, grease, oil, water splashes, metal shavings and filings, and theft.
The 21"-40" segment is anticipated to witness the fastest growth at a CAGR of 7.63% throughout the forecast period. This category includes displays with a diagonal screen size between 21 and 40 inches. They are commonly used in industrial applications such as factory automation, digital signage, and control rooms. The demand for touchscreen computer equipment in heavy-duty work environments is expected to propel the 21"-40" segment market. The monitors and touch screen panels include anodized coatings with stainless-steel chassis and are designed to offer operators better durability and operation across wide temperature ranges. The tablets and monitors are in-built with multiple input and output options and advanced touchscreen configurations.
End-use Insights
In terms of end-use, the market is classified into mining & metals, manufacturing, energy & power, chemical, oil & gas, and others. The manufacturing segment dominated the market, gaining a share of 34.59% in 2022, and is poised to register a CAGR of 6.13% during the forecast period. Manufacturing facilities employ industrial displays to show real-time statistics on production rates, machine status, and quality control information. Additionally, they can oversee and manage automated equipment like robotics and production lines. Industrial displays can also be used in production for communication, safety, and employee training. They can provide safety instructions, training movies, and other pertinent data to assist staff in performing their duties more proficiently and safely.
The energy & power sector is expected to account for a CAGR of 7.64% from 2023 to 2032. In the energy and power sector, industrial displays show real-time statistics on energy use and production, including electrical output, temperature, and pressure. They can also be used to operate and keep an eye on automated equipment, like power distribution systems, turbines, and generators. Industrial displays can be utilized in the energy and power sector for safety, communication, process management, and monitoring. To assist workers in remaining safe in potentially dangerous energy and power conditions, they can display safety regulations, emergency procedures, and other crucial information.
Regional Insights
Asia Pacific market dominated the total revenues in 2022, gaining a market share of 36.86%. It is expected to grow at a CAGR of 6.83% throughout the forecast period. The demand for industrial displays is being driven by the area, which is home to some of the biggest and fastest-growing economies in the world, including China, Japan, and India. China is the largest market for industrial displays in the Asia Pacific due to the rising need for automation and digitalization across various industries, including manufacturing, healthcare, and the automobile industry. Japan also witnesses significant growth in the industrial display industry due to the demand for high-quality displays in the automobile industry and other application areas.
The North America regional segment is anticipated to witness the fastest growth, growing at a CAGR of 7.64% throughout the forecast period. There is a wide demand for industrial displays in the U.S. and Canada in this region. Furthermore, the rising preference for using industrial displays can be attributed to rising automation, the increasing demand for safer and more effective workplaces, and rising expenditures on cutting-edge technology. Due to the growing adoption of automation and improved driver assistance systems, the demand for rugged and dependable displays is anticipated to increase, notably in the automotive and transportation sectors.
Industrial Display Market Segmentations:
By Type
By Application
By Technology
By Panel Size
By End-use
By Regional
Chapter 1. Introduction
1.1. Research Objective
1.2. Scope of the Study
1.3. Definition
Chapter 2. Research Methodology
2.1. Research Approach
2.2. Data Sources
2.3. Assumptions & Limitations
Chapter 3. Executive Summary
3.1. Market Snapshot
Chapter 4. Market Variables and Scope
4.1. Introduction
4.2. Market Classification and Scope
4.3. Industry Value Chain Analysis
4.3.1. Raw Material Procurement Analysis
4.3.2. Sales and Distribution Channel Analysis
4.3.3. Downstream Buyer Analysis
Chapter 5. COVID 19 Impact on Industrial Display Market
5.1. COVID-19 Landscape: Industrial Display Industry Impact
5.2. COVID 19 - Impact Assessment for the Industry
5.3. COVID 19 Impact: Global Major Government Policy
5.4. Market Trends and Opportunities in the COVID-19 Landscape
Chapter 6. Market Dynamics Analysis and Trends
6.1. Market Dynamics
6.1.1. Market Drivers
6.1.2. Market Restraints
6.1.3. Market Opportunities
6.2. Porter’s Five Forces Analysis
6.2.1. Bargaining power of suppliers
6.2.2. Bargaining power of buyers
6.2.3. Threat of substitute
6.2.4. Threat of new entrants
6.2.5. Degree of competition
Chapter 7. Competitive Landscape
7.1.1. Company Market Share/Positioning Analysis
7.1.2. Key Strategies Adopted by Players
7.1.3. Vendor Landscape
7.1.3.1. List of Suppliers
7.1.3.2. List of Buyers
Chapter 8. Global Industrial Display Market, By Type
8.1. Industrial Display Market, by Type, 2023-2032
8.1.1. Rugged Displays
8.1.1.1. Market Revenue and Forecast (2020-2032)
8.1.2. Open Frame Monitors
8.1.2.1. Market Revenue and Forecast (2020-2032)
8.1.3. Panel-Mount Monitors
8.1.3.1. Market Revenue and Forecast (2020-2032)
8.1.4. Marine Displays
8.1.4.1. Market Revenue and Forecast (2020-2032)
8.1.5. Video Walls
8.1.5.1. Market Revenue and Forecast (2020-2032)
Chapter 9. Global Industrial Display Market, By Application
9.1. Industrial Display Market, by Application, 2023-2032
9.1.1. HMI
9.1.1.1. Market Revenue and Forecast (2020-2032)
9.1.2. Remote Monitoring
9.1.2.1. Market Revenue and Forecast (2020-2032)
9.1.3. Interactive Display
9.1.3.1. Market Revenue and Forecast (2020-2032)
9.1.4. Digital Signage
9.1.4.1. Market Revenue and Forecast (2020-2032)
Chapter 10. Global Industrial Display Market, By Technology
10.1. Industrial Display Market, by Technology, 2023-2032
10.1.1. LCD
10.1.1.1. Market Revenue and Forecast (2020-2032)
10.1.2. LED
10.1.2.1. Market Revenue and Forecast (2020-2032)
10.1.3. OLED
10.1.3.1. Market Revenue and Forecast (2020-2032)
10.1.4. E-Paper
10.1.4.1. Market Revenue and Forecast (2020-2032)
Chapter 11. Global Industrial Display Market, By Panel Size
11.1. Industrial Display Market, by Panel Size, 2023-2032
11.1.1. Up to 14”
11.1.1.1. Market Revenue and Forecast (2020-2032)
11.1.2. 14-21”
11.1.2.1. Market Revenue and Forecast (2020-2032)
11.1.3. 21-40”
11.1.3.1. Market Revenue and Forecast (2020-2032)
11.1.4. 40” and above
11.1.4.1. Market Revenue and Forecast (2020-2032)
Chapter 12. Global Industrial Display Market, By End-use
12.1. Industrial Display Market, by End-use, 2023-2032
12.1.1. Manufacturing
12.1.1.1. Market Revenue and Forecast (2020-2032)
12.1.2. Mining & Metals
12.1.2.1. Market Revenue and Forecast (2020-2032)
12.1.3. Chemical, Oil, and Gas
12.1.3.1. Market Revenue and Forecast (2020-2032)
12.1.4. Energy & Power
12.1.4.1. Market Revenue and Forecast (2020-2032)
12.1.5. Others
12.1.5.1. Market Revenue and Forecast (2020-2032)
Chapter 13. Global Industrial Display Market, Regional Estimates and Trend Forecast
13.1. North America
13.1.1. Market Revenue and Forecast, by Type (2020-2032)
13.1.2. Market Revenue and Forecast, by Application (2020-2032)
13.1.3. Market Revenue and Forecast, by Technology (2020-2032)
13.1.4. Market Revenue and Forecast, by Panel Size (2020-2032)
13.1.5. Market Revenue and Forecast, by End-use (2020-2032)
13.1.6. U.S.
13.1.6.1. Market Revenue and Forecast, by Type (2020-2032)
13.1.6.2. Market Revenue and Forecast, by Application (2020-2032)
13.1.6.3. Market Revenue and Forecast, by Technology (2020-2032)
13.1.6.4. Market Revenue and Forecast, by Panel Size (2020-2032)
13.1.7. Market Revenue and Forecast, by End-use (2020-2032)
13.1.8. Rest of North America
13.1.8.1. Market Revenue and Forecast, by Type (2020-2032)
13.1.8.2. Market Revenue and Forecast, by Application (2020-2032)
13.1.8.3. Market Revenue and Forecast, by Technology (2020-2032)
13.1.8.4. Market Revenue and Forecast, by Panel Size (2020-2032)
13.1.8.5. Market Revenue and Forecast, by End-use (2020-2032)
13.2. Europe
13.2.1. Market Revenue and Forecast, by Type (2020-2032)
13.2.2. Market Revenue and Forecast, by Application (2020-2032)
13.2.3. Market Revenue and Forecast, by Technology (2020-2032)
13.2.4. Market Revenue and Forecast, by Panel Size (2020-2032)
13.2.5. Market Revenue and Forecast, by End-use (2020-2032)
13.2.6. UK
13.2.6.1. Market Revenue and Forecast, by Type (2020-2032)
13.2.6.2. Market Revenue and Forecast, by Application (2020-2032)
13.2.6.3. Market Revenue and Forecast, by Technology (2020-2032)
13.2.7. Market Revenue and Forecast, by Panel Size (2020-2032)
13.2.8. Market Revenue and Forecast, by End-use (2020-2032)
13.2.9. Germany
13.2.9.1. Market Revenue and Forecast, by Type (2020-2032)
13.2.9.2. Market Revenue and Forecast, by Application (2020-2032)
13.2.9.3. Market Revenue and Forecast, by Technology (2020-2032)
13.2.10. Market Revenue and Forecast, by Panel Size (2020-2032)
13.2.11. Market Revenue and Forecast, by End-use (2020-2032)
13.2.12. France
13.2.12.1. Market Revenue and Forecast, by Type (2020-2032)
13.2.12.2. Market Revenue and Forecast, by Application (2020-2032)
13.2.12.3. Market Revenue and Forecast, by Technology (2020-2032)
13.2.12.4. Market Revenue and Forecast, by Panel Size (2020-2032)
13.2.13. Market Revenue and Forecast, by End-use (2020-2032)
13.2.14. Rest of Europe
13.2.14.1. Market Revenue and Forecast, by Type (2020-2032)
13.2.14.2. Market Revenue and Forecast, by Application (2020-2032)
13.2.14.3. Market Revenue and Forecast, by Technology (2020-2032)
13.2.14.4. Market Revenue and Forecast, by Panel Size (2020-2032)
13.2.15. Market Revenue and Forecast, by End-use (2020-2032)
13.3. APAC
13.3.1. Market Revenue and Forecast, by Type (2020-2032)
13.3.2. Market Revenue and Forecast, by Application (2020-2032)
13.3.3. Market Revenue and Forecast, by Technology (2020-2032)
13.3.4. Market Revenue and Forecast, by Panel Size (2020-2032)
13.3.5. Market Revenue and Forecast, by End-use (2020-2032)
13.3.6. India
13.3.6.1. Market Revenue and Forecast, by Type (2020-2032)
13.3.6.2. Market Revenue and Forecast, by Application (2020-2032)
13.3.6.3. Market Revenue and Forecast, by Technology (2020-2032)
13.3.6.4. Market Revenue and Forecast, by Panel Size (2020-2032)
13.3.7. Market Revenue and Forecast, by End-use (2020-2032)
13.3.8. China
13.3.8.1. Market Revenue and Forecast, by Type (2020-2032)
13.3.8.2. Market Revenue and Forecast, by Application (2020-2032)
13.3.8.3. Market Revenue and Forecast, by Technology (2020-2032)
13.3.8.4. Market Revenue and Forecast, by Panel Size (2020-2032)
13.3.9. Market Revenue and Forecast, by End-use (2020-2032)
13.3.10. Japan
13.3.10.1. Market Revenue and Forecast, by Type (2020-2032)
13.3.10.2. Market Revenue and Forecast, by Application (2020-2032)
13.3.10.3. Market Revenue and Forecast, by Technology (2020-2032)
13.3.10.4. Market Revenue and Forecast, by Panel Size (2020-2032)
13.3.10.5. Market Revenue and Forecast, by End-use (2020-2032)
13.3.11. Rest of APAC
13.3.11.1. Market Revenue and Forecast, by Type (2020-2032)
13.3.11.2. Market Revenue and Forecast, by Application (2020-2032)
13.3.11.3. Market Revenue and Forecast, by Technology (2020-2032)
13.3.11.4. Market Revenue and Forecast, by Panel Size (2020-2032)
13.3.11.5. Market Revenue and Forecast, by End-use (2020-2032)
13.4. MEA
13.4.1. Market Revenue and Forecast, by Type (2020-2032)
13.4.2. Market Revenue and Forecast, by Application (2020-2032)
13.4.3. Market Revenue and Forecast, by Technology (2020-2032)
13.4.4. Market Revenue and Forecast, by Panel Size (2020-2032)
13.4.5. Market Revenue and Forecast, by End-use (2020-2032)
13.4.6. GCC
13.4.6.1. Market Revenue and Forecast, by Type (2020-2032)
13.4.6.2. Market Revenue and Forecast, by Application (2020-2032)
13.4.6.3. Market Revenue and Forecast, by Technology (2020-2032)
13.4.6.4. Market Revenue and Forecast, by Panel Size (2020-2032)
13.4.7. Market Revenue and Forecast, by End-use (2020-2032)
13.4.8. North Africa
13.4.8.1. Market Revenue and Forecast, by Type (2020-2032)
13.4.8.2. Market Revenue and Forecast, by Application (2020-2032)
13.4.8.3. Market Revenue and Forecast, by Technology (2020-2032)
13.4.8.4. Market Revenue and Forecast, by Panel Size (2020-2032)
13.4.9. Market Revenue and Forecast, by End-use (2020-2032)
13.4.10. South Africa
13.4.10.1. Market Revenue and Forecast, by Type (2020-2032)
13.4.10.2. Market Revenue and Forecast, by Application (2020-2032)
13.4.10.3. Market Revenue and Forecast, by Technology (2020-2032)
13.4.10.4. Market Revenue and Forecast, by Panel Size (2020-2032)
13.4.10.5. Market Revenue and Forecast, by End-use (2020-2032)
13.4.11. Rest of MEA
13.4.11.1. Market Revenue and Forecast, by Type (2020-2032)
13.4.11.2. Market Revenue and Forecast, by Application (2020-2032)
13.4.11.3. Market Revenue and Forecast, by Technology (2020-2032)
13.4.11.4. Market Revenue and Forecast, by Panel Size (2020-2032)
13.4.11.5. Market Revenue and Forecast, by End-use (2020-2032)
13.5. Latin America
13.5.1. Market Revenue and Forecast, by Type (2020-2032)
13.5.2. Market Revenue and Forecast, by Application (2020-2032)
13.5.3. Market Revenue and Forecast, by Technology (2020-2032)
13.5.4. Market Revenue and Forecast, by Panel Size (2020-2032)
13.5.5. Market Revenue and Forecast, by End-use (2020-2032)
13.5.6. Brazil
13.5.6.1. Market Revenue and Forecast, by Type (2020-2032)
13.5.6.2. Market Revenue and Forecast, by Application (2020-2032)
13.5.6.3. Market Revenue and Forecast, by Technology (2020-2032)
13.5.6.4. Market Revenue and Forecast, by Panel Size (2020-2032)
13.5.7. Market Revenue and Forecast, by End-use (2020-2032)
13.5.8. Rest of LATAM
13.5.8.1. Market Revenue and Forecast, by Type (2020-2032)
13.5.8.2. Market Revenue and Forecast, by Application (2020-2032)
13.5.8.3. Market Revenue and Forecast, by Technology (2020-2032)
13.5.8.4. Market Revenue and Forecast, by Panel Size (2020-2032)
13.5.8.5. Market Revenue and Forecast, by End-use (2020-2032)
Chapter 14. Company Profiles
14.1. LG Display Co., Ltd.
14.1.1. Company Overview
14.1.2. Product Offerings
14.1.3. Financial Performance
14.1.4. Recent Initiatives
14.2. Samsung Display
14.2.1. Company Overview
14.2.2. Product Offerings
14.2.3. Financial Performance
14.2.4. Recent Initiatives
14.3. Pepperl+Fuchs GmbH
14.3.1. Company Overview
14.3.2. Product Offerings
14.3.3. Financial Performance
14.3.4. Recent Initiatives
14.4. Advantech Co., Ltd.
14.4.1. Company Overview
14.4.2. Product Offerings
14.4.3. Financial Performance
14.4.4. Recent Initiatives
14.5. Planar Systems, Inc.
14.5.1. Company Overview
14.5.2. Product Offerings
14.5.3. Financial Performance
14.5.4. Recent Initiatives
14.6. WinMate, Inc.
14.6.1. Company Overview
14.6.2. Product Offerings
14.6.3. Financial Performance
14.6.4. Recent Initiatives
14.7. Sharp NEC Display Solutions
14.7.1. Company Overview
14.7.2. Product Offerings
14.7.3. Financial Performance
14.7.4. Recent Initiatives
14.8. Maple Systems, Inc.
14.8.1. Company Overview
14.8.2. Product Offerings
14.8.3. Financial Performance
14.8.4. Recent Initiatives
14.9. Japan Display, Inc.
14.9.1. Company Overview
14.9.2. Product Offerings
14.9.3. Financial Performance
14.9.4. Recent Initiatives
14.10. Innolux Corporation
14.10.1. Company Overview
14.10.2. Product Offerings
14.10.3. Financial Performance
14.10.4. Recent Initiatives
Chapter 15. Research Methodology
15.1. Primary Research
15.2. Secondary Research
15.3. Assumptions
Chapter 16. Appendix
16.1. About Us
16.2. Glossary of Terms
 Cross-segment Market Size and Analysis for
Mentioned Segments
Additional Company Profiles (Upto 5 With No Cost)
Additional Countries (Apart From Mentioned Countries)
Country/Region-specific Report
Go To Market Strategy
Region Specific Market DynamicsRegion Level Market Share Import Export AnalysisProduction AnalysisOthers
Cross-segment Market Size and Analysis for
Mentioned Segments
Additional Company Profiles (Upto 5 With No Cost)
Additional Countries (Apart From Mentioned Countries)
Country/Region-specific Report
Go To Market Strategy
Region Specific Market DynamicsRegion Level Market Share Import Export AnalysisProduction AnalysisOthers