Industrial Distribution Market Size, Share | Report 2023-2032
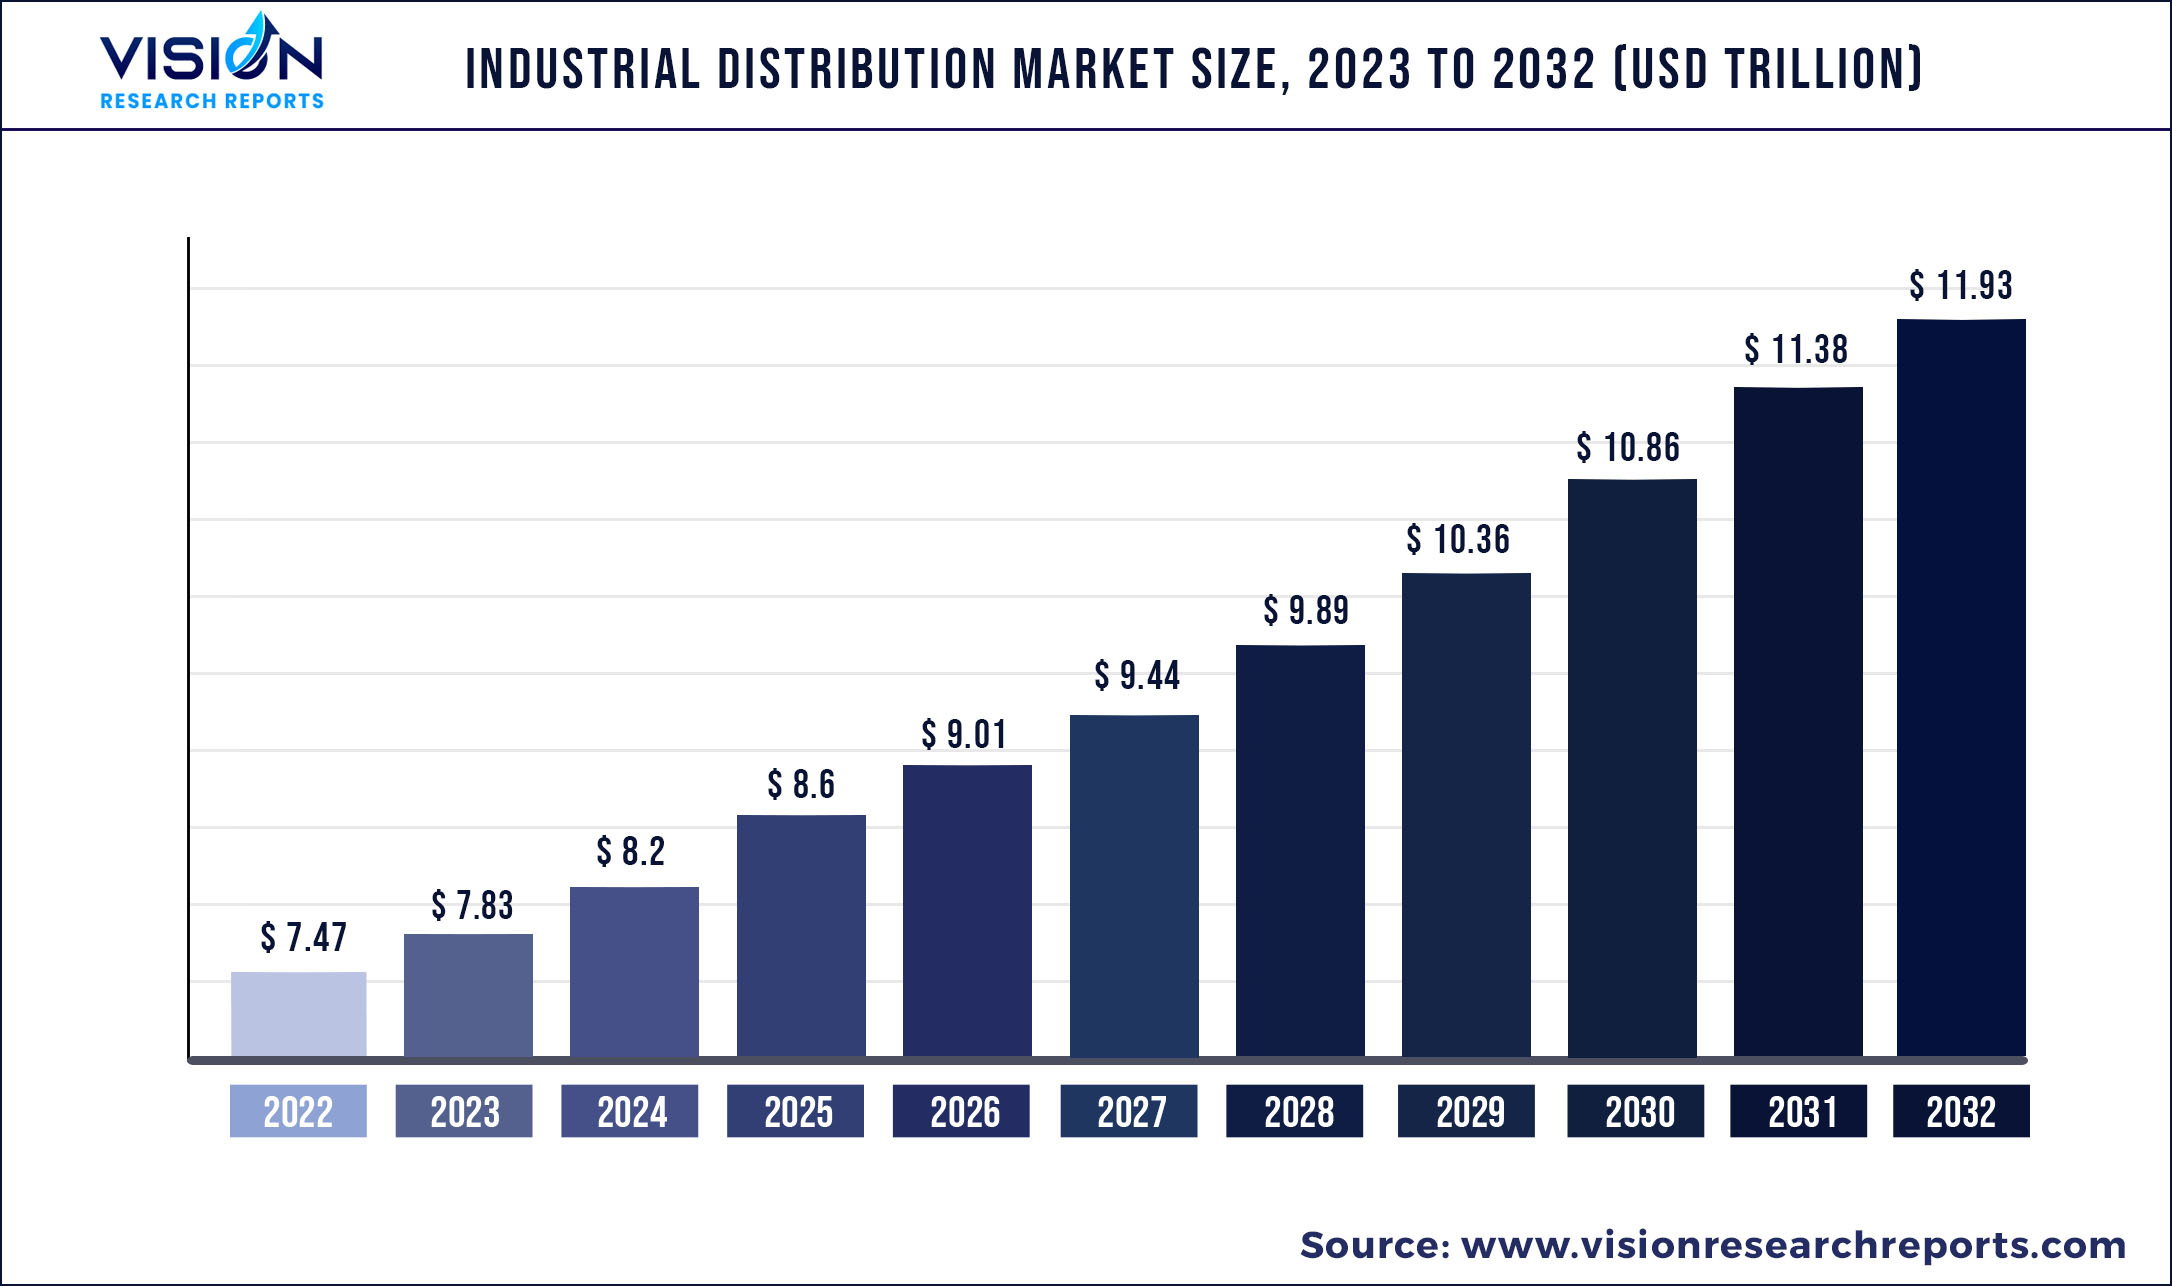
The global industrial distribution market was surpassed at USD 7.47 trillion in 2022 and is expected to hit around USD 11.93 trillion by 2032, growing at a CAGR of 4.79% from 2023 to 2032.
Key Pointers
Report Scope of the Industrial Distribution Market
| Report Coverage | Details |
| Market Size in 2022 | USD 7.47 trillion |
| Revenue Forecast by 2032 | USD 11.93 trillion |
| Growth rate from 2023 to 2032 | CAGR of 4.79% |
| Base Year | 2022 |
| Forecast Period | 2023 to 2032 |
| Market Analysis (Terms Used) | Value (US$ Million/Billion) or (Volume/Units) |
| Regions Covered | North America, Europe, Asia Pacific, Latin America, Middle East & Africa |
| Companies Covered | W.W. Grainger; Sonepar USA (Industrial); Airgas, Air Liquide, US; WESCO International (Industrial); Würth Industry (USA); Border States (Industrial); Wolseley Industrial Group; DXP Enterprises, Inc.; F.W. Webb; Kaman Distribution Group; Edgen Murray; Motion Industries; HD Supply; Rexel USA, Inc.; Fastenal Company; Descours et Cabaud; Winsupply Inc.; MRC Global; Applied Industrial Technologies; MSC Industrial Supply |
Industrial distribution is the transfer of industrial goods from their manufacturing hub to the end consumers through an industrial supply chain. Over the past 30 years, industrial distribution has rapidly expanded. It has been fueled by the pressure of constantly rising selling expenses and user demands quick service. Industrial businesses that once oversaw their direct salesforces now need to learn how to choose distributors and are discovering the challenges of developing and directing distributors' sales efforts. An industrial distributor is a sales firm that typically aids in moving the products to the end consumer via the supply chain, providing both corporate clients and suppliers with a helpful service. Industrial distributors are responsible for working alongside producers and accepting accountability for the goods they distribute. These businesses typically buy products in large quantities from producers and distribute them to businesses that use them for production or manufacturing. Industrial manufacturing has enabled ease of operations for various e-commerce and retail companies.
Market Dynamics:
Drivers:
Numerous benefits of industrial distribution: Companies not selling directly to customers can use alternate strategies provided by industrial distributors. Companies may reduce their carbon footprints, avoid offshore outsourcing, and reduce the cost of shipping with the help of industrial distribution. The industrial distribution sector is expanding in terms of technological innovation, and initiatives have been taken to satisfy consumer needs. Businesses can use industrial distribution centers to store their finished merchandise, parts, and manufacturing resources. Due to the system's homogeneity, the industrial distribution system has advantages when it comes to educating employees and administrators to manage and oversee the centers. The industrial distribution facilities are arranged to utilize software to track inventories and the flow of manufactured goods.
Restraints:
Mishandling of products- Industrial distribution facilities usually deal in large numbers of shipments of various organizations, which may sometimes lead to mishandling of the products. The product or the packaging can get damaged, which would ultimately increase the lead time. Therefore, the mishandling of products or their packaging is one of the critical factors that may hinder the market's growth over the forecast period.
Opportunities:
Expansion of the e-commerce industry- Over the past ten years, the sales channel with the quickest growth has been e-commerce. According to many surveys, the digital transaction will account for 50 percent of the absolute value growth in the worldwide retail sector between 2020 and 2025. As more products are sold online, it translates to an increase in the total value of USD 1.4 trillion. As would be expected, given the two biggest e-commerce marketplaces in the world, China and the U.S. will account for 55% of the value growth in e-commerce potential. Latin America, a developing e-commerce market, saw a faster adoption of e-commerce due to the crisis as more people turned to online shopping for essentials.
Challenges:
Prone to cyberattacks – The advancements in the industrial distribution field are leading to machine learning and artificial intelligence adoption. Due to this, the software used in the maintenance and operation of industrial distribution is often prone to cyber security threats. Cyberattacks have increased in the recent decade, which is a challenge for market growth.
Industrial Distribution Market Segmentations:
| By Product | By Applications |
|
MRO Supplies Electrical Equipment and Supplies OEM Supplies Hand Tools and Power Tools Bearings Office Equipment and Supplies Others |
eCommerce Offline |
Chapter 1. Introduction
1.1. Research Objective
1.2. Scope of the Study
1.3. Definition
Chapter 2. Research Methodology
2.1. Research Approach
2.2. Data Sources
2.3. Assumptions & Limitations
Chapter 3. Executive Summary
3.1. Market Snapshot
Chapter 4. Market Variables and Scope
4.1. Introduction
4.2. Market Classification and Scope
4.3. Industry Value Chain Analysis
4.3.1. Raw Material Procurement Analysis
4.3.2. Sales and Distribution Channel Analysis
4.3.3. Downstream Buyer Analysis
Chapter 5. COVID 19 Impact on Industrial Distribution Market
5.1. COVID-19 Landscape: Industrial Distribution Industry Impact
5.2. COVID 19 - Impact Assessment for the Industry
5.3. COVID 19 Impact: Global Major Government Policy
5.4. Market Trends and Opportunities in the COVID-19 Landscape
Chapter 6. Market Dynamics Analysis and Trends
6.1. Market Dynamics
6.1.1. Market Drivers
6.1.2. Market Restraints
6.1.3. Market Opportunities
6.2. Porter’s Five Forces Analysis
6.2.1. Bargaining power of suppliers
6.2.2. Bargaining power of buyers
6.2.3. Threat of substitute
6.2.4. Threat of new entrants
6.2.5. Degree of competition
Chapter 7. Competitive Landscape
7.1.1. Company Market Share/Positioning Analysis
7.1.2. Key Strategies Adopted by Players
7.1.3. Vendor Landscape
7.1.3.1. List of Suppliers
7.1.3.2. List of Buyers
Chapter 8. Global Industrial Distribution Market, By Product
8.1. Industrial Distribution Market, by Product, 2023-2032
8.1.1. MRO Supplies
8.1.1.1. Market Revenue and Forecast (2020-2032)
8.1.2. Electrical Equipment and Supplies
8.1.2.1. Market Revenue and Forecast (2020-2032)
8.1.3. OEM Supplies
8.1.3.1. Market Revenue and Forecast (2020-2032)
8.1.4. Hand Tools and Power Tools
8.1.4.1. Market Revenue and Forecast (2020-2032)
8.1.5. Bearings
8.1.5.1. Market Revenue and Forecast (2020-2032)
8.1.6. Office Equipment and Supplies
8.1.6.1. Market Revenue and Forecast (2020-2032)
8.1.7. Others
8.1.7.1. Market Revenue and Forecast (2020-2032)
Chapter 9. Global Industrial Distribution Market, By Applications
9.1. Industrial Distribution Market, by Applications, 2023-2032
9.1.1. eCommerce
9.1.1.1. Market Revenue and Forecast (2020-2032)
9.1.2. Offline
9.1.2.1. Market Revenue and Forecast (2020-2032)
Chapter 10. Global Industrial Distribution Market, Regional Estimates and Trend Forecast
10.1. North America
10.1.1. Market Revenue and Forecast, by Product (2020-2032)
10.1.2. Market Revenue and Forecast, by Applications (2020-2032)
10.1.3. U.S.
10.1.3.1. Market Revenue and Forecast, by Product (2020-2032)
10.1.3.2. Market Revenue and Forecast, by Applications (2020-2032)
10.1.4. Rest of North America
10.1.4.1. Market Revenue and Forecast, by Product (2020-2032)
10.1.4.2. Market Revenue and Forecast, by Applications (2020-2032)
10.2. Europe
10.2.1. Market Revenue and Forecast, by Product (2020-2032)
10.2.2. Market Revenue and Forecast, by Applications (2020-2032)
10.2.3. UK
10.2.3.1. Market Revenue and Forecast, by Product (2020-2032)
10.2.3.2. Market Revenue and Forecast, by Applications (2020-2032)
10.2.4. Germany
10.2.4.1. Market Revenue and Forecast, by Product (2020-2032)
10.2.4.2. Market Revenue and Forecast, by Applications (2020-2032)
10.2.5. France
10.2.5.1. Market Revenue and Forecast, by Product (2020-2032)
10.2.5.2. Market Revenue and Forecast, by Applications (2020-2032)
10.2.6. Rest of Europe
10.2.6.1. Market Revenue and Forecast, by Product (2020-2032)
10.2.6.2. Market Revenue and Forecast, by Applications (2020-2032)
10.3. APAC
10.3.1. Market Revenue and Forecast, by Product (2020-2032)
10.3.2. Market Revenue and Forecast, by Applications (2020-2032)
10.3.3. India
10.3.3.1. Market Revenue and Forecast, by Product (2020-2032)
10.3.3.2. Market Revenue and Forecast, by Applications (2020-2032)
10.3.4. China
10.3.4.1. Market Revenue and Forecast, by Product (2020-2032)
10.3.4.2. Market Revenue and Forecast, by Applications (2020-2032)
10.3.5. Japan
10.3.5.1. Market Revenue and Forecast, by Product (2020-2032)
10.3.5.2. Market Revenue and Forecast, by Applications (2020-2032)
10.3.6. Rest of APAC
10.3.6.1. Market Revenue and Forecast, by Product (2020-2032)
10.3.6.2. Market Revenue and Forecast, by Applications (2020-2032)
10.4. MEA
10.4.1. Market Revenue and Forecast, by Product (2020-2032)
10.4.2. Market Revenue and Forecast, by Applications (2020-2032)
10.4.3. GCC
10.4.3.1. Market Revenue and Forecast, by Product (2020-2032)
10.4.3.2. Market Revenue and Forecast, by Applications (2020-2032)
10.4.4. North Africa
10.4.4.1. Market Revenue and Forecast, by Product (2020-2032)
10.4.4.2. Market Revenue and Forecast, by Applications (2020-2032)
10.4.5. South Africa
10.4.5.1. Market Revenue and Forecast, by Product (2020-2032)
10.4.5.2. Market Revenue and Forecast, by Applications (2020-2032)
10.4.6. Rest of MEA
10.4.6.1. Market Revenue and Forecast, by Product (2020-2032)
10.4.6.2. Market Revenue and Forecast, by Applications (2020-2032)
10.5. Latin America
10.5.1. Market Revenue and Forecast, by Product (2020-2032)
10.5.2. Market Revenue and Forecast, by Applications (2020-2032)
10.5.3. Brazil
10.5.3.1. Market Revenue and Forecast, by Product (2020-2032)
10.5.3.2. Market Revenue and Forecast, by Applications (2020-2032)
10.5.4. Rest of LATAM
10.5.4.1. Market Revenue and Forecast, by Product (2020-2032)
10.5.4.2. Market Revenue and Forecast, by Applications (2020-2032)
Chapter 11. Company Profiles
11.1. W.W. Grainger
11.1.1. Company Overview
11.1.2. Product Offerings
11.1.3. Financial Performance
11.1.4. Recent Initiatives
11.2. Sonepar USA (Industrial)
11.2.1. Company Overview
11.2.2. Product Offerings
11.2.3. Financial Performance
11.2.4. Recent Initiatives
11.3. Airgas
11.3.1. Company Overview
11.3.2. Product Offerings
11.3.3. Financial Performance
11.3.4. Recent Initiatives
11.4. Air Liquide, US
11.4.1. Company Overview
11.4.2. Product Offerings
11.4.3. Financial Performance
11.4.4. LTE Scientific
11.5. WESCO International (Industrial)
11.5.1. Company Overview
11.5.2. Product Offerings
11.5.3. Financial Performance
11.5.4. Recent Initiatives
11.6. Würth Industry (USA)
11.6.1. Company Overview
11.6.2. Product Offerings
11.6.3. Financial Performance
11.6.4. Recent Initiatives
11.7. Border States (Industrial)
11.7.1. Company Overview
11.7.2. Product Offerings
11.7.3. Financial Performance
11.7.4. Recent Initiatives
11.8. Wolseley Industrial Group
11.8.1. Company Overview
11.8.2. Product Offerings
11.8.3. Financial Performance
11.8.4. Recent Initiatives
11.9. DXP Enterprises, Inc.
11.9.1. Company Overview
11.9.2. Product Offerings
11.9.3. Financial Performance
11.9.4. Recent Initiatives
11.10. F.W. Webb
11.10.1. Company Overview
11.10.2. Product Offerings
11.10.3. Financial Performance
11.10.4. Recent Initiatives
Chapter 12. Research Methodology
12.1. Primary Research
12.2. Secondary Research
12.3. Assumptions
Chapter 13. Appendix
13.1. About Us
13.2. Glossary of Terms
 Cross-segment Market Size and Analysis for
Mentioned Segments
Additional Company Profiles (Upto 5 With No Cost)
Additional Countries (Apart From Mentioned Countries)
Country/Region-specific Report
Go To Market Strategy
Region Specific Market DynamicsRegion Level Market Share Import Export AnalysisProduction AnalysisOthers
Cross-segment Market Size and Analysis for
Mentioned Segments
Additional Company Profiles (Upto 5 With No Cost)
Additional Countries (Apart From Mentioned Countries)
Country/Region-specific Report
Go To Market Strategy
Region Specific Market DynamicsRegion Level Market Share Import Export AnalysisProduction AnalysisOthers