Intraoperative Imaging Market Size, Trends, Share, Growth | Report 2023-2032
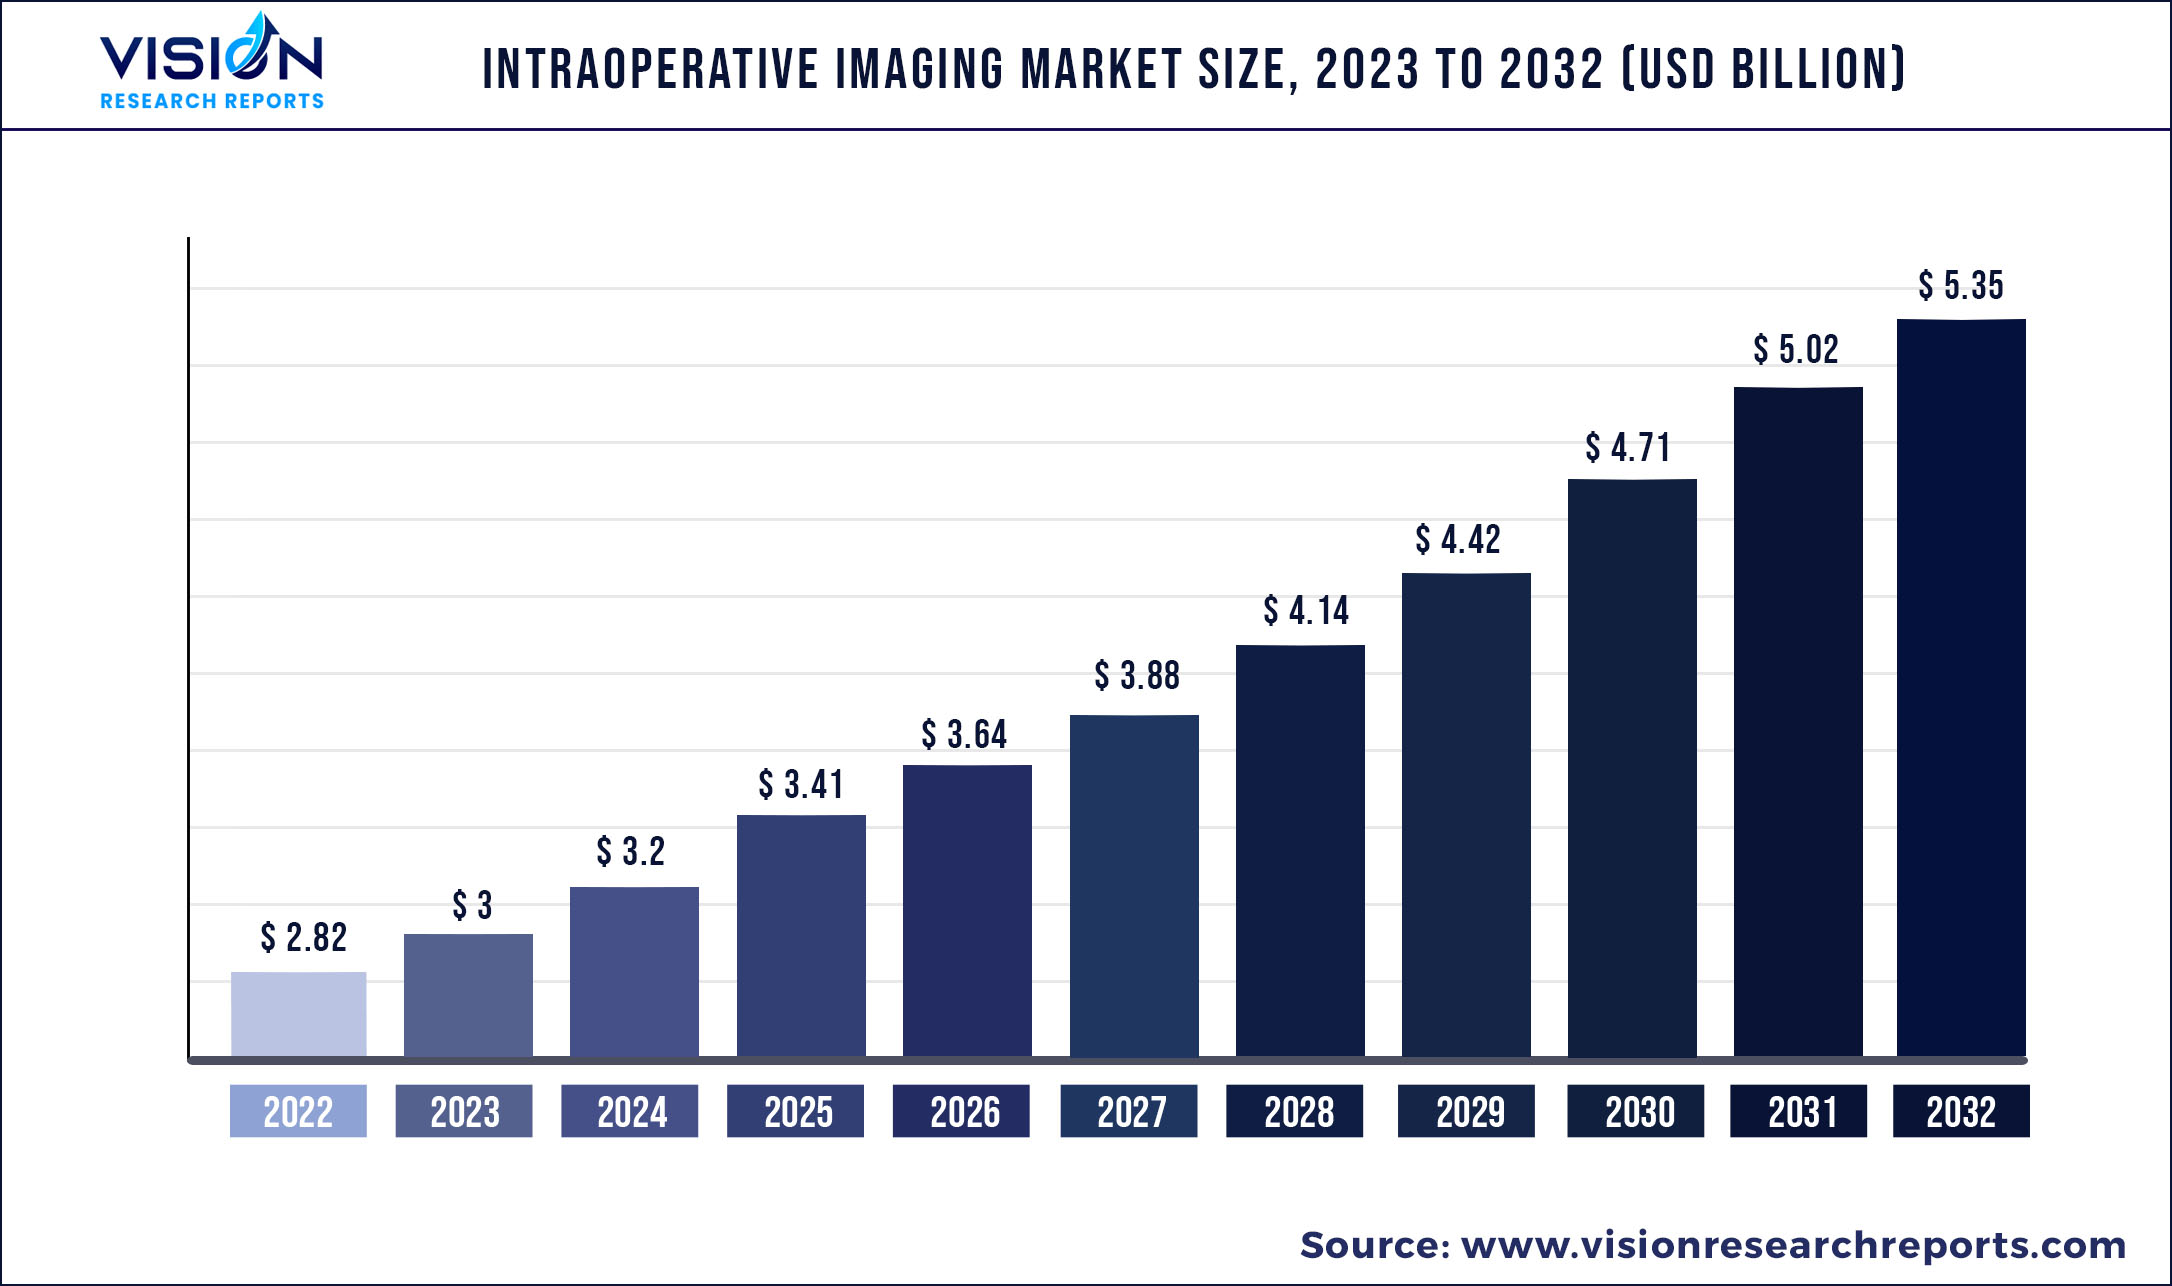
The global intraoperative imaging market was valued at USD 2.82 billion in 2022 and it is predicted to surpass around USD 5.35 billion by 2032 with a CAGR of 6.64% from 2023 to 2032.
Key Pointers
Report Scope of the Intraoperative Imaging Market
| Report Coverage | Details |
| Market Size in 2022 | USD 2.82 billion |
| Revenue Forecast by 2032 | USD 5.35 billion |
| Growth rate from 2023 to 2032 | CAGR of 6.64% |
| Base Year | 2022 |
| Forecast Period | 2023 to 2032 |
| Market Analysis (Terms Used) | Value (US$ Million/Billion) or (Volume/Units) |
| Regions Covered | North America, Europe, Asia Pacific, Latin America, Middle East & Africa |
The market growth can be attributed to the increase in the adoption of minimally invasive surgeries coupled with technological advancements. In addition, the increasing prevalence of chronic disorders and the rise in the geriatric population are major factors contributing to the market growth. The global geriatric population has grown dramatically, putting them at risk for various disorders. As per the UN, in 2017, the global population of people aged 60 and above was 962 million, doubling in 2050 to reach over 2.1 billion.
Intraoperative imaging is getting popular as a critical tool for more precise and effective surgeries, which improves patient outcomes while also enhancing workflows and efficiencies for healthcare personnel in and out of the operating room.
Intraoperative imaging technologies, such as iUltrasound, C-arm, and iMRI, have greatly extended surgical possibilities. The ability to see bones and soft tissue with extreme precision has transformed the surgical care of a variety of disorders, including neurology, orthopedics, cardiology, vascular, and neurology. The constant advances in intraoperative imaging technologies, such as 3D technology and real-time imaging, are expected to boost market expansion. For instance, in March 2021, the FDA granted GE Healthcare clearance for OEC 3D, a surgical imaging system capable of both 3D and 2D imaging. By providing precise volumetric images, OEC 3D aims to set a benchmark for intraoperative 3D imaging for spine and orthopedic surgeries.
An increase in the adoption of minimally invasive surgeries, which is highly dependent on the imaging chain, as the medical team has to rely on indirect visualization of the surgical field during the entire procedure, is expected to promote market growth. However, constraints such as the high cost of intraoperative imaging systems and an increase in demand for refurbished imaging systems may hinder the market expansion throughout the projected period.
The COVID-19 pandemic has significantly affected the intraoperative imaging market. Delay in surgical procedures is the reason. The medical settings where these imaging systems are used are high-risk areas for the spread of the COVID-19 infection. However, guidelines for safe and effective surgical care will decrease pandemic implications during the forecast period. Furthermore, raw material shortages are causing broad business interruptions, resulting in a decline in imaging equipment manufacturing and transportation disruptions. On the other hand, now that the lockdown limitations have been lifted, the market is gradually getting back to normal.
Competitive Insights
The key players are working to improve their product offerings by upgrading their products, leveraging important cooperative drives, as well as considering acquisitions and government approvals to increase their client base and get a larger part of the entire industry. For instance, in September 2021, GE Healthcare agreed to acquire BK Medical, a leader in advanced surgical visualization. With this agreement, BK Medical's active imaging platform will be able to reach new customers and markets around the world. In addition, the combination of GE Healthcare's diagnostic imaging technology and BK's ability to enable decision-making and surgical visualization in the intervention will allow for better decision-making across the healthcare system. The following are some of the major participants in the global intraoperative imaging market:
Intraoperative Imaging Market Segmentations:
| By Product | By Component | By Application | By End-use |
|
iCT iUltrasound iMRI C-arm system |
System Software Services |
Neurosurgery Orthopedic ENT surgery Oncology surgery Trauma surgery/ emergency room Cardiovascular Others |
Hospital Others |
Chapter 1. Introduction
1.1. Research Objective
1.2. Scope of the Study
1.3. Definition
Chapter 2. Research Methodology
2.1. Research Approach
2.2. Data Sources
2.3. Assumptions & Limitations
Chapter 3. Executive Summary
3.1. Market Snapshot
Chapter 4. Market Variables and Scope
4.1. Introduction
4.2. Market Classification and Scope
4.3. Industry Value Chain Analysis
4.3.1. Raw Material Procurement Analysis
4.3.2. Sales and Distribution Channel Analysis
4.3.3. Downstream Buyer Analysis
Chapter 5. COVID 19 Impact on Intraoperative Imaging Market
5.1. COVID-19 Landscape: Intraoperative Imaging Industry Impact
5.2. COVID 19 - Impact Assessment for the Industry
5.3. COVID 19 Impact: Global Major Government Policy
5.4. Market Trends and Opportunities in the COVID-19 Landscape
Chapter 6. Market Dynamics Analysis and Trends
6.1. Market Dynamics
6.1.1. Market Drivers
6.1.2. Market Restraints
6.1.3. Market Opportunities
6.2. Porter’s Five Forces Analysis
6.2.1. Bargaining power of suppliers
6.2.2. Bargaining power of buyers
6.2.3. Threat of substitute
6.2.4. Threat of new entrants
6.2.5. Degree of competition
Chapter 7. Competitive Landscape
7.1.1. Company Market Share/Positioning Analysis
7.1.2. Key Strategies Adopted by Players
7.1.3. Vendor Landscape
7.1.3.1. List of Suppliers
7.1.3.2. List of Buyers
Chapter 8. Global Intraoperative Imaging Market, By Product
8.1. Intraoperative Imaging Market, by Product, 2023-2032
8.1.1. iCT
8.1.1.1. Market Revenue and Forecast (2020-2032)
8.1.2. iUltrasound
8.1.2.1. Market Revenue and Forecast (2020-2032)
8.1.3. iMRI
8.1.3.1. Market Revenue and Forecast (2020-2032)
8.1.4. C-arm system
8.1.4.1. Market Revenue and Forecast (2020-2032)
Chapter 9. Global Intraoperative Imaging Market, By Component
9.1. Intraoperative Imaging Market, by Component, 2023-2032
9.1.1. System
9.1.1.1. Market Revenue and Forecast (2020-2032)
9.1.2. Software
9.1.2.1. Market Revenue and Forecast (2020-2032)
9.1.3. Services
9.1.3.1. Market Revenue and Forecast (2020-2032)
Chapter 10. Global Intraoperative Imaging Market, By Application
10.1. Intraoperative Imaging Market, by Application, 2023-2032
10.1.1. Neurosurgery
10.1.1.1. Market Revenue and Forecast (2020-2032)
10.1.2. Orthopedic
10.1.2.1. Market Revenue and Forecast (2020-2032)
10.1.3. ENT surgery
10.1.3.1. Market Revenue and Forecast (2020-2032)
10.1.4. Oncology surgery
10.1.4.1. Market Revenue and Forecast (2020-2032)
10.1.5. Trauma surgery/ emergency room
10.1.5.1. Market Revenue and Forecast (2020-2032)
10.1.6. Cardiovascular
10.1.6.1. Market Revenue and Forecast (2020-2032)
10.1.7. Others
10.1.7.1. Market Revenue and Forecast (2020-2032)
Chapter 11. Global Intraoperative Imaging Market, By End-use
11.1. Intraoperative Imaging Market, by End-use, 2023-2032
11.1.1. Hospital
11.1.1.1. Market Revenue and Forecast (2020-2032)
11.1.2. Others
11.1.2.1. Market Revenue and Forecast (2020-2032)
Chapter 12. Global Intraoperative Imaging Market, Regional Estimates and Trend Forecast
12.1. North America
12.1.1. Market Revenue and Forecast, by Product (2020-2032)
12.1.2. Market Revenue and Forecast, by Component (2020-2032)
12.1.3. Market Revenue and Forecast, by Application (2020-2032)
12.1.4. Market Revenue and Forecast, by End-use (2020-2032)
12.1.5. U.S.
12.1.5.1. Market Revenue and Forecast, by Product (2020-2032)
12.1.5.2. Market Revenue and Forecast, by Component (2020-2032)
12.1.5.3. Market Revenue and Forecast, by Application (2020-2032)
12.1.5.4. Market Revenue and Forecast, by End-use (2020-2032)
12.1.6. Rest of North America
12.1.6.1. Market Revenue and Forecast, by Product (2020-2032)
12.1.6.2. Market Revenue and Forecast, by Component (2020-2032)
12.1.6.3. Market Revenue and Forecast, by Application (2020-2032)
12.1.6.4. Market Revenue and Forecast, by End-use (2020-2032)
12.2. Europe
12.2.1. Market Revenue and Forecast, by Product (2020-2032)
12.2.2. Market Revenue and Forecast, by Component (2020-2032)
12.2.3. Market Revenue and Forecast, by Application (2020-2032)
12.2.4. Market Revenue and Forecast, by End-use (2020-2032)
12.2.5. UK
12.2.5.1. Market Revenue and Forecast, by Product (2020-2032)
12.2.5.2. Market Revenue and Forecast, by Component (2020-2032)
12.2.5.3. Market Revenue and Forecast, by Application (2020-2032)
12.2.5.4. Market Revenue and Forecast, by End-use (2020-2032)
12.2.6. Germany
12.2.6.1. Market Revenue and Forecast, by Product (2020-2032)
12.2.6.2. Market Revenue and Forecast, by Component (2020-2032)
12.2.6.3. Market Revenue and Forecast, by Application (2020-2032)
12.2.6.4. Market Revenue and Forecast, by End-use (2020-2032)
12.2.7. France
12.2.7.1. Market Revenue and Forecast, by Product (2020-2032)
12.2.7.2. Market Revenue and Forecast, by Component (2020-2032)
12.2.7.3. Market Revenue and Forecast, by Application (2020-2032)
12.2.7.4. Market Revenue and Forecast, by End-use (2020-2032)
12.2.8. Rest of Europe
12.2.8.1. Market Revenue and Forecast, by Product (2020-2032)
12.2.8.2. Market Revenue and Forecast, by Component (2020-2032)
12.2.8.3. Market Revenue and Forecast, by Application (2020-2032)
12.2.8.4. Market Revenue and Forecast, by End-use (2020-2032)
12.3. APAC
12.3.1. Market Revenue and Forecast, by Product (2020-2032)
12.3.2. Market Revenue and Forecast, by Component (2020-2032)
12.3.3. Market Revenue and Forecast, by Application (2020-2032)
12.3.4. Market Revenue and Forecast, by End-use (2020-2032)
12.3.5. India
12.3.5.1. Market Revenue and Forecast, by Product (2020-2032)
12.3.5.2. Market Revenue and Forecast, by Component (2020-2032)
12.3.5.3. Market Revenue and Forecast, by Application (2020-2032)
12.3.5.4. Market Revenue and Forecast, by End-use (2020-2032)
12.3.6. China
12.3.6.1. Market Revenue and Forecast, by Product (2020-2032)
12.3.6.2. Market Revenue and Forecast, by Component (2020-2032)
12.3.6.3. Market Revenue and Forecast, by Application (2020-2032)
12.3.6.4. Market Revenue and Forecast, by End-use (2020-2032)
12.3.7. Japan
12.3.7.1. Market Revenue and Forecast, by Product (2020-2032)
12.3.7.2. Market Revenue and Forecast, by Component (2020-2032)
12.3.7.3. Market Revenue and Forecast, by Application (2020-2032)
12.3.7.4. Market Revenue and Forecast, by End-use (2020-2032)
12.3.8. Rest of APAC
12.3.8.1. Market Revenue and Forecast, by Product (2020-2032)
12.3.8.2. Market Revenue and Forecast, by Component (2020-2032)
12.3.8.3. Market Revenue and Forecast, by Application (2020-2032)
12.3.8.4. Market Revenue and Forecast, by End-use (2020-2032)
12.4. MEA
12.4.1. Market Revenue and Forecast, by Product (2020-2032)
12.4.2. Market Revenue and Forecast, by Component (2020-2032)
12.4.3. Market Revenue and Forecast, by Application (2020-2032)
12.4.4. Market Revenue and Forecast, by End-use (2020-2032)
12.4.5. GCC
12.4.5.1. Market Revenue and Forecast, by Product (2020-2032)
12.4.5.2. Market Revenue and Forecast, by Component (2020-2032)
12.4.5.3. Market Revenue and Forecast, by Application (2020-2032)
12.4.5.4. Market Revenue and Forecast, by End-use (2020-2032)
12.4.6. North Africa
12.4.6.1. Market Revenue and Forecast, by Product (2020-2032)
12.4.6.2. Market Revenue and Forecast, by Component (2020-2032)
12.4.6.3. Market Revenue and Forecast, by Application (2020-2032)
12.4.6.4. Market Revenue and Forecast, by End-use (2020-2032)
12.4.7. South Africa
12.4.7.1. Market Revenue and Forecast, by Product (2020-2032)
12.4.7.2. Market Revenue and Forecast, by Component (2020-2032)
12.4.7.3. Market Revenue and Forecast, by Application (2020-2032)
12.4.7.4. Market Revenue and Forecast, by End-use (2020-2032)
12.4.8. Rest of MEA
12.4.8.1. Market Revenue and Forecast, by Product (2020-2032)
12.4.8.2. Market Revenue and Forecast, by Component (2020-2032)
12.4.8.3. Market Revenue and Forecast, by Application (2020-2032)
12.4.8.4. Market Revenue and Forecast, by End-use (2020-2032)
12.5. Latin America
12.5.1. Market Revenue and Forecast, by Product (2020-2032)
12.5.2. Market Revenue and Forecast, by Component (2020-2032)
12.5.3. Market Revenue and Forecast, by Application (2020-2032)
12.5.4. Market Revenue and Forecast, by End-use (2020-2032)
12.5.5. Brazil
12.5.5.1. Market Revenue and Forecast, by Product (2020-2032)
12.5.5.2. Market Revenue and Forecast, by Component (2020-2032)
12.5.5.3. Market Revenue and Forecast, by Application (2020-2032)
12.5.5.4. Market Revenue and Forecast, by End-use (2020-2032)
12.5.6. Rest of LATAM
12.5.6.1. Market Revenue and Forecast, by Product (2020-2032)
12.5.6.2. Market Revenue and Forecast, by Component (2020-2032)
12.5.6.3. Market Revenue and Forecast, by Application (2020-2032)
12.5.6.4. Market Revenue and Forecast, by End-use (2020-2032)
Chapter 13. Company Profiles
13.1. GE Healthcare
13.1.1. Company Overview
13.1.2. Product Offerings
13.1.3. Financial Performance
13.1.4. Recent Initiatives
13.2. Siemens Healthineers AG
13.2.1. Company Overview
13.2.2. Product Offerings
13.2.3. Financial Performance
13.2.4. Recent Initiatives
13.3. Koninklijke Philips N.V.
13.3.1. Company Overview
13.3.2. Product Offerings
13.3.3. Financial Performance
13.3.4. Recent Initiatives
13.4. Medtronic
13.4.1. Company Overview
13.4.2. Product Offerings
13.4.3. Financial Performance
13.4.4. Recent Initiatives
13.5. Ziehm Imaging GmbH
13.5.1. Company Overview
13.5.2. Product Offerings
13.5.3. Financial Performance
13.5.4. Recent Initiatives
13.6. IMRIS
13.6.1. Company Overview
13.6.2. Product Offerings
13.6.3. Financial Performance
13.6.4. Recent Initiatives
13.7. Shimadzu Corporation
13.7.1. Company Overview
13.7.2. Product Offerings
13.7.3. Financial Performance
13.7.4. Recent Initiatives
13.8. NeuroLogica
13.8.1. Company Overview
13.8.2. Product Offerings
13.8.3. Financial Performance
13.8.4. Recent Initiatives
Chapter 14. Research Methodology
14.1. Primary Research
14.2. Secondary Research
14.3. Assumptions
Chapter 15. Appendix
15.1. About Us
15.2. Glossary of Terms
 Cross-segment Market Size and Analysis for
Mentioned Segments
Additional Company Profiles (Upto 5 With No Cost)
Additional Countries (Apart From Mentioned Countries)
Country/Region-specific Report
Go To Market Strategy
Region Specific Market DynamicsRegion Level Market Share Import Export AnalysisProduction AnalysisOthers
Cross-segment Market Size and Analysis for
Mentioned Segments
Additional Company Profiles (Upto 5 With No Cost)
Additional Countries (Apart From Mentioned Countries)
Country/Region-specific Report
Go To Market Strategy
Region Specific Market DynamicsRegion Level Market Share Import Export AnalysisProduction AnalysisOthers