Label-free Array Systems Market Size, Share | Report 2023-2032
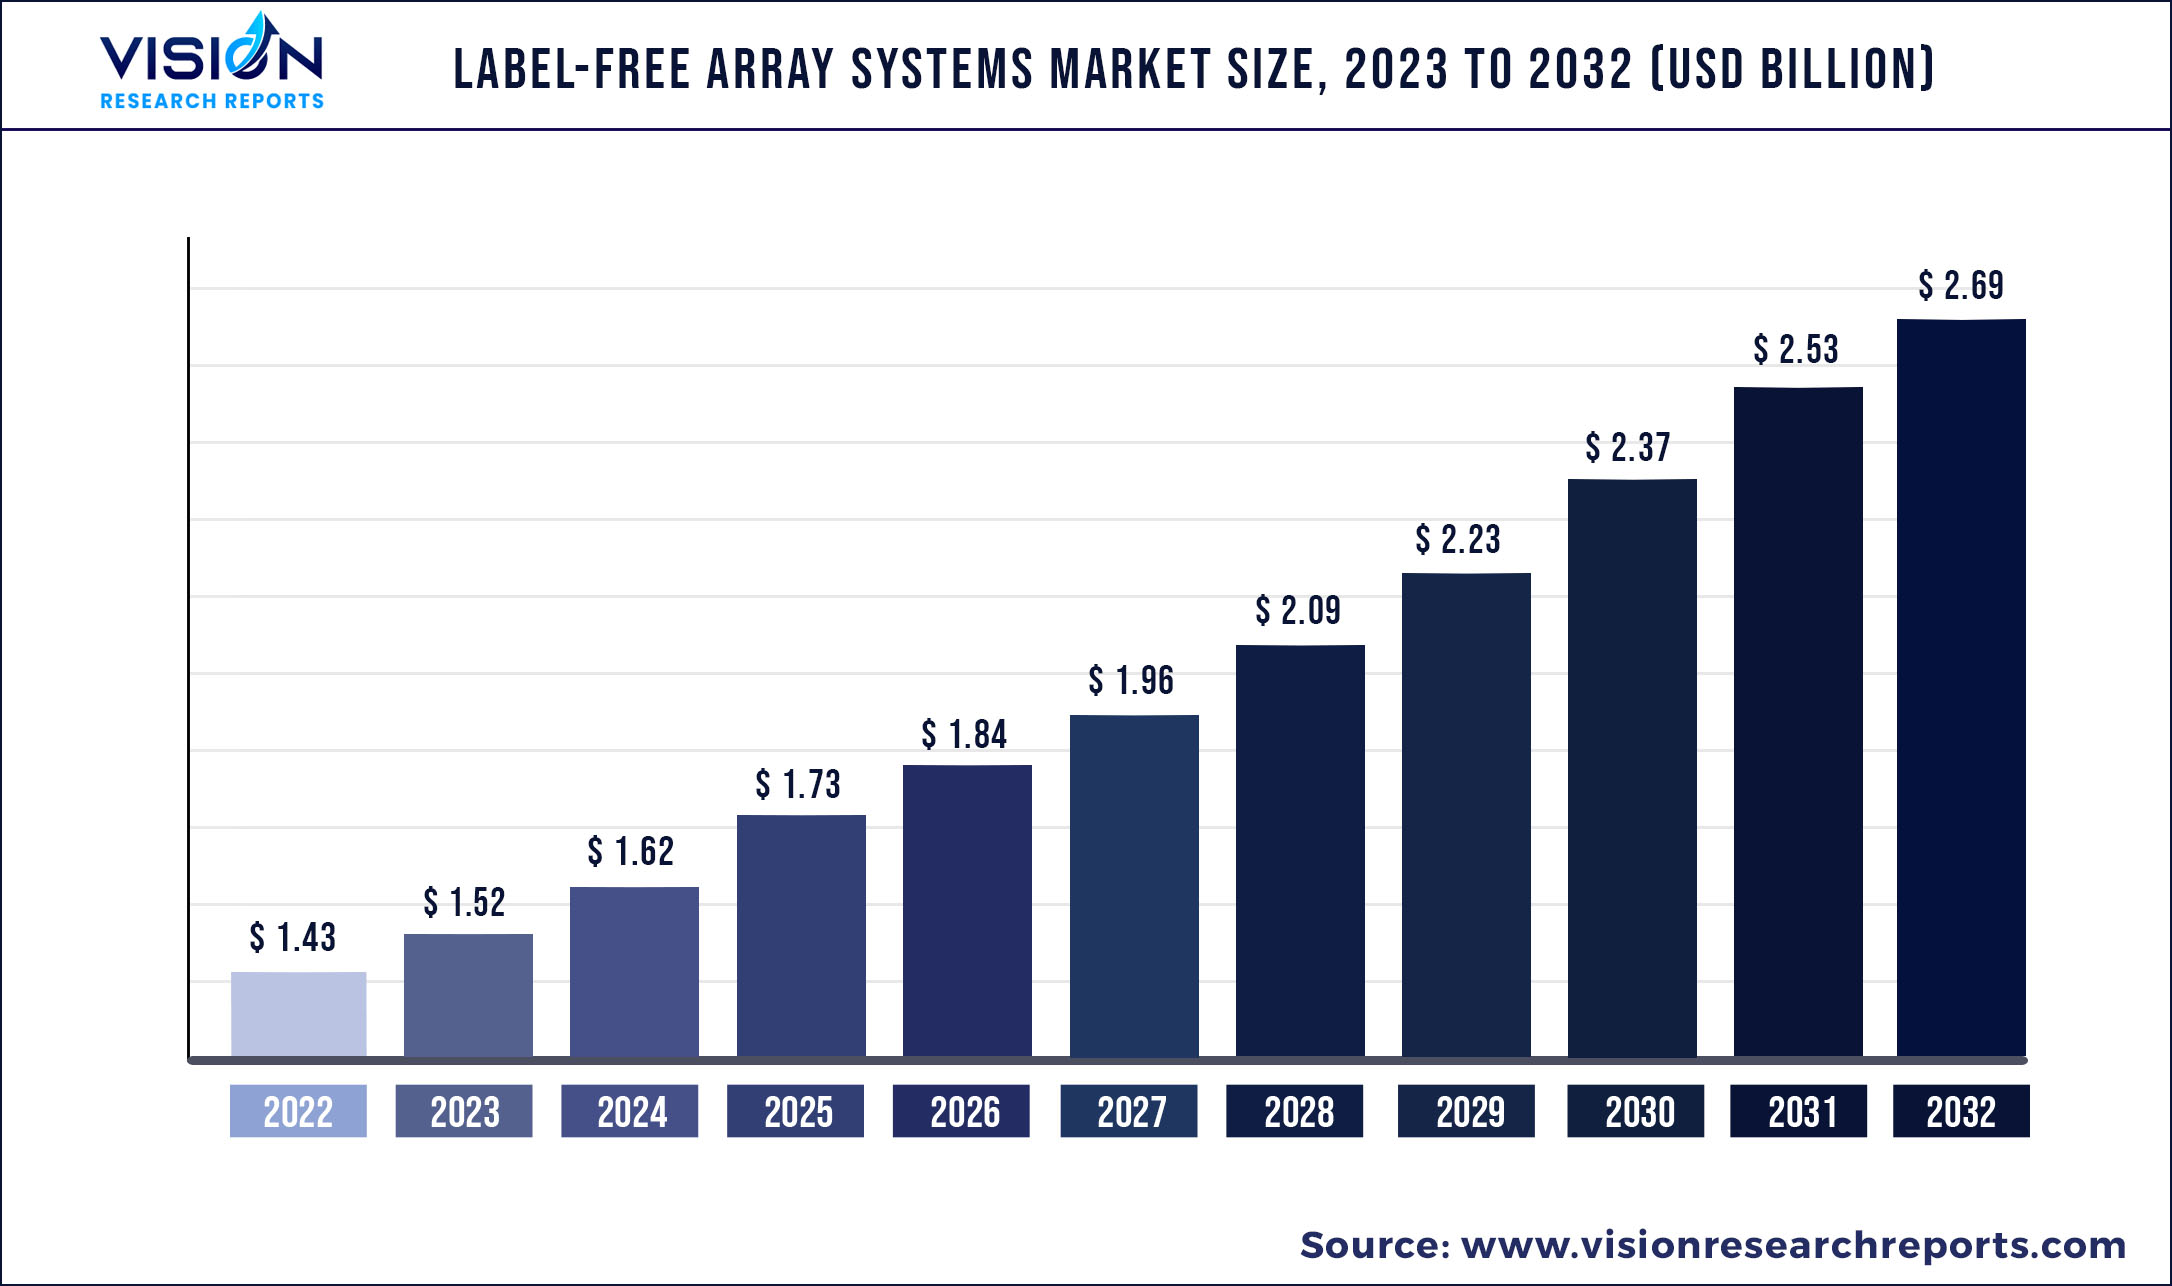
The global label-free array systems market was surpassed at USD 1.43 billion in 2022 and is expected to hit around USD 2.69 billion by 2032, growing at a CAGR of 6.55% from 2023 to 2032.
Label-free array systems are analytical technologies that are used to detect and quantify biomolecules in complex samples without the use of fluorescent or radioactive labels. These systems rely on the principle of Surface Plasmon resonance (SPR) which allows detecting changes in the reflected light and quantifying the binding of biomolecules to the surface of the array. One of the main advantages of label-free array systems is that they do not require the use of hazardous or expensive labeling agents, making them a safer and more cost-effective alternative to traditional labeling methods. Additionally, because they do not rely on fluorescence or radioactivity, label-free array systems can be used to study biomolecule interactions in real time, providing dynamic and quantitative information about the binding kinetics and affinity of the interacting molecules.
In recent years, a number of companies have entered the market for label-free array systems, for instance, in November 2018, Agilent Technologies that has acquired ACEA Biosciences, a company that develops and manufactures label-free array systems for the detection and analysis of biomolecules. This acquisition was likely made in order to expand Agilent's portfolio of products and services in the label-free array systems market. This highlights the growing demand for label-free detection methods in the field of biological and biomedical research.
| Report Coverage | Details |
| Market Size in 2022 | USD 1.43 billion |
| Revenue Forecast by 2032 | USD 2.69 billion |
| Growth rate from 2023 to 2032 | CAGR of 6.55% |
| Base Year | 2022 |
| Forecast Period | 2023 to 2032 |
| Regions Covered | North America, Europe, Asia Pacific, Latin America, Middle East & Africa |
| Companies Covered | Illumina, Inc., Thermo Fisher Scientific, Inc., Agilent Technologies, Inc., PerkinElmer, Inc., Merck KGaA, Danaher Corporation, Bio-Rad Laboratories, Inc., F. Hoffmann-La Roche AG, Becton, Dickinson and Company, and Sartorius AG. |
The label-free array systems market is driven by the increasing demand for personalized medicine, as well as a variety of other factors such as the prevalence of chronic diseases, increased research activities in biomedical science, the need for high-throughput screening, and the demand for cost-effective and efficient systems. Additionally, the focus on drug delivery efficiency, government funding for research activities and the emergence of new technologies such as nanotechnology are also contributing to the growth of the market. Companies such as Bruker are at the forefront of these developments, in June 2018 they launched new systems such as the Sierra SPR-32 system, which is equipped with R3 software that provides high sensitivity and the highest SPR throughput. This software increases the instrument's precision and productivity, and the label-free strategies will help accelerate the process of taking chemical entities to clinical trials.
The market is segmented based on type, application, end-user, and region. The type segment is divided into surface plasmon resonance, bio-layer interferometry, and cellular dielectric spectroscopy. The application segment is divided into drug discovery, protein interface analysis, antibody characterization, and others. The end-user segment is further segmented into pharmaceutical and biotechnology companies, academic and research institute, contract research organizations, and others
The label-free array systems market is expected to grow significantly in the coming years, driven by increasing demand from North America, Europe, and Asia Pacific. The U.S. and Canada, the UK, Germany, France, Japan, China, are India are the major contributors to the market. ForteBio is a leading provider of label-free array systems, such as the Octet Red system, which is a label-free, real-time biosensor used to study protein-protein interactions, protein-ligand interactions, and protein stability.
Label-free Array Systems Market Segmentations:
| By Type | By Application | By End user |
|
Surface Plasmon Resonance Bio-layer Interferometry Cellular Dielectric Spectroscopy Others |
Drug Discovery Protein Interface Analysis Antibody Characterization Others |
Pharmaceutical and Biotechnology Companies Academic and Research Institute Contract Research Organization Others |
Chapter 1. Introduction
1.1. Research Objective
1.2. Scope of the Study
1.3. Definition
Chapter 2. Research Methodology
2.1. Research Approach
2.2. Data Sources
2.3. Assumptions & Limitations
Chapter 3. Executive Summary
3.1. Market Snapshot
Chapter 4. Market Variables and Scope
4.1. Introduction
4.2. Market Classification and Scope
4.3. Industry Value Chain Analysis
4.3.1. Raw Material Procurement Analysis
4.3.2. Sales and Distribution Channel Analysis
4.3.3. Downstream Buyer Analysis
Chapter 5. COVID 19 Impact on Label-free Array Systems Market
5.1. COVID-19 Landscape: Label-free Array Systems Industry Impact
5.2. COVID 19 - Impact Assessment for the Industry
5.3. COVID 19 Impact: Global Major Government Policy
5.4. Market Trends and Opportunities in the COVID-19 Landscape
Chapter 6. Market Dynamics Analysis and Trends
6.1. Market Dynamics
6.1.1. Market Drivers
6.1.2. Market Restraints
6.1.3. Market Opportunities
6.2. Porter’s Five Forces Analysis
6.2.1. Bargaining power of suppliers
6.2.2. Bargaining power of buyers
6.2.3. Threat of substitute
6.2.4. Threat of new entrants
6.2.5. Degree of competition
Chapter 7. Competitive Landscape
7.1.1. Company Market Share/Positioning Analysis
7.1.2. Key Strategies Adopted by Players
7.1.3. Vendor Landscape
7.1.3.1. List of Suppliers
7.1.3.2. List of Buyers
Chapter 8. Global Label-free Array Systems Market, By Type
8.1. Label-free Array Systems Market, by Type, 2023-2032
8.1.1 Surface Plasmon Resonance
8.1.1.1. Market Revenue and Forecast (2020-2032)
8.1.2. Bio-layer Interferometry
8.1.2.1. Market Revenue and Forecast (2020-2032)
8.1.3. Cellular Dielectric Spectroscopy
8.1.3.1. Market Revenue and Forecast (2020-2032)
8.1.4. Others
8.1.4.1. Market Revenue and Forecast (2020-2032)
Chapter 9. Global Label-free Array Systems Market, By Application
9.1. Label-free Array Systems Market, by Application, 2023-2032
9.1.1. Drug Discovery
9.1.1.1. Market Revenue and Forecast (2020-2032)
9.1.2. Protein Interface Analysis
9.1.2.1. Market Revenue and Forecast (2020-2032)
9.1.3. Antibody Characterization
9.1.3.1. Market Revenue and Forecast (2020-2032)
9.1.4. Others
9.1.4.1. Market Revenue and Forecast (2020-2032)
Chapter 10. Global Label-free Array Systems Market, By End user
10.1. Label-free Array Systems Market, by End user, 2023-2032
10.1.1. Pharmaceutical and Biotechnology Companies
10.1.1.1. Market Revenue and Forecast (2020-2032)
10.1.2. Academic and Research Institute
10.1.2.1. Market Revenue and Forecast (2020-2032)
10.1.3. Contract Research Organization
10.1.3.1. Market Revenue and Forecast (2020-2032)
10.1.4. Others
10.1.4.1. Market Revenue and Forecast (2020-2032)
Chapter 11. Global Label-free Array Systems Market, Regional Estimates and Trend Forecast
11.1. North America
11.1.1. Market Revenue and Forecast, by Type (2020-2032)
11.1.2. Market Revenue and Forecast, by Application (2020-2032)
11.1.3. Market Revenue and Forecast, by End user (2020-2032)
11.1.4. U.S.
11.1.4.1. Market Revenue and Forecast, by Type (2020-2032)
11.1.4.2. Market Revenue and Forecast, by Application (2020-2032)
11.1.4.3. Market Revenue and Forecast, by End user (2020-2032)
11.1.5. Rest of North America
11.1.5.1. Market Revenue and Forecast, by Type (2020-2032)
11.1.5.2. Market Revenue and Forecast, by Application (2020-2032)
11.1.5.3. Market Revenue and Forecast, by End user (2020-2032)
11.2. Europe
11.2.1. Market Revenue and Forecast, by Type (2020-2032)
11.2.2. Market Revenue and Forecast, by Application (2020-2032)
11.2.3. Market Revenue and Forecast, by End user (2020-2032)
11.2.4. UK
11.2.4.1. Market Revenue and Forecast, by Type (2020-2032)
11.2.4.2. Market Revenue and Forecast, by Application (2020-2032)
11.2.4.3. Market Revenue and Forecast, by End user (2020-2032)
11.2.5. Germany
11.2.5.1. Market Revenue and Forecast, by Type (2020-2032)
11.2.5.2. Market Revenue and Forecast, by Application (2020-2032)
11.2.5.3. Market Revenue and Forecast, by End user (2020-2032)
11.2.6. France
11.2.6.1. Market Revenue and Forecast, by Type (2020-2032)
11.2.6.2. Market Revenue and Forecast, by Application (2020-2032)
11.2.6.3. Market Revenue and Forecast, by End user (2020-2032)
11.2.7. Rest of Europe
11.2.7.1. Market Revenue and Forecast, by Type (2020-2032)
11.2.7.2. Market Revenue and Forecast, by Application (2020-2032)
11.2.7.3. Market Revenue and Forecast, by End user (2020-2032)
11.3. APAC
11.3.1. Market Revenue and Forecast, by Type (2020-2032)
11.3.2. Market Revenue and Forecast, by Application (2020-2032)
11.3.3. Market Revenue and Forecast, by End user (2020-2032)
11.3.4. India
11.3.4.1. Market Revenue and Forecast, by Type (2020-2032)
11.3.4.2. Market Revenue and Forecast, by Application (2020-2032)
11.3.4.3. Market Revenue and Forecast, by End user (2020-2032)
11.3.5. China
11.3.5.1. Market Revenue and Forecast, by Type (2020-2032)
11.3.5.2. Market Revenue and Forecast, by Application (2020-2032)
11.3.5.3. Market Revenue and Forecast, by End user (2020-2032)
11.3.6. Japan
11.3.6.1. Market Revenue and Forecast, by Type (2020-2032)
11.3.6.2. Market Revenue and Forecast, by Application (2020-2032)
11.3.6.3. Market Revenue and Forecast, by End user (2020-2032)
11.3.7. Rest of APAC
11.3.7.1. Market Revenue and Forecast, by Type (2020-2032)
11.3.7.2. Market Revenue and Forecast, by Application (2020-2032)
11.3.7.3. Market Revenue and Forecast, by End user (2020-2032)
11.4. MEA
11.4.1. Market Revenue and Forecast, by Type (2020-2032)
11.4.2. Market Revenue and Forecast, by Application (2020-2032)
11.4.3. Market Revenue and Forecast, by End user (2020-2032)
11.4.4. GCC
11.4.4.1. Market Revenue and Forecast, by Type (2020-2032)
11.4.4.2. Market Revenue and Forecast, by Application (2020-2032)
11.4.4.3. Market Revenue and Forecast, by End user (2020-2032)
11.4.5. North Africa
11.4.5.1. Market Revenue and Forecast, by Type (2020-2032)
11.4.5.2. Market Revenue and Forecast, by Application (2020-2032)
11.4.5.3. Market Revenue and Forecast, by End user (2020-2032)
11.4.6. South Africa
11.4.6.1. Market Revenue and Forecast, by Type (2020-2032)
11.4.6.2. Market Revenue and Forecast, by Application (2020-2032)
11.4.6.3. Market Revenue and Forecast, by End user (2020-2032)
11.4.7. Rest of MEA
11.4.7.1. Market Revenue and Forecast, by Type (2020-2032)
11.4.7.2. Market Revenue and Forecast, by Application (2020-2032)
11.4.7.3. Market Revenue and Forecast, by End user (2020-2032)
11.5. Latin America
11.5.1. Market Revenue and Forecast, by Type (2020-2032)
11.5.2. Market Revenue and Forecast, by Application (2020-2032)
11.5.3. Market Revenue and Forecast, by End user (2020-2032)
11.5.4. Brazil
11.5.4.1. Market Revenue and Forecast, by Type (2020-2032)
11.5.4.2. Market Revenue and Forecast, by Application (2020-2032)
11.5.4.3. Market Revenue and Forecast, by End user (2020-2032)
11.5.5. Rest of LATAM
11.5.5.1. Market Revenue and Forecast, by Type (2020-2032)
11.5.5.2. Market Revenue and Forecast, by Application (2020-2032)
11.5.5.3. Market Revenue and Forecast, by End user (2020-2032)
Chapter 12. Company Profiles
12.1. Illumina, Inc.
12.1.1. Company Overview
12.1.2. Product Offerings
12.1.3. Financial Performance
12.1.4. Recent Initiatives
12.2. Thermo Fisher Scientific, Inc.
12.2.1. Company Overview
12.2.2. Product Offerings
12.2.3. Financial Performance
12.2.4. Recent Initiatives
12.3. Agilent Technologies, Inc.
12.3.1. Company Overview
12.3.2. Product Offerings
12.3.3. Financial Performance
12.3.4. Recent Initiatives
12.4. PerkinElmer, Inc.
12.4.1. Company Overview
12.4.2. Product Offerings
12.4.3. Financial Performance
12.4.4. Recent Initiatives
12.5. Merck KGaA
12.5.1. Company Overview
12.5.2. Product Offerings
12.5.3. Financial Performance
12.5.4. Recent Initiatives
12.6. Danaher Corporation
12.6.1. Company Overview
12.6.2. Product Offerings
12.6.3. Financial Performance
12.6.4. Recent Initiatives
12.7. Bio-Rad Laboratories, Inc.
12.7.1. Company Overview
12.7.2. Product Offerings
12.7.3. Financial Performance
12.7.4. Recent Initiatives
12.8. F. Hoffmann-La Roche AG
12.8.1. Company Overview
12.8.2. Product Offerings
12.8.3. Financial Performance
12.8.4. Recent Initiatives
12.9. Becton
12.9.1. Company Overview
12.9.2. Product Offerings
12.9.3. Financial Performance
12.9.4. Recent Initiatives
12.10. Dickinson and Company
12.10.1. Company Overview
12.10.2. Product Offerings
12.10.3. Financial Performance
12.10.4. Recent Initiatives
Chapter 13. Research Methodology
13.1. Primary Research
13.2. Secondary Research
13.3. Assumptions
Chapter 14. Appendix
14.1. About Us
14.2. Glossary of Terms
 Cross-segment Market Size and Analysis for
Mentioned Segments
Additional Company Profiles (Upto 5 With No Cost)
Additional Countries (Apart From Mentioned Countries)
Country/Region-specific Report
Go To Market Strategy
Region Specific Market DynamicsRegion Level Market Share Import Export AnalysisProduction AnalysisOthers
Cross-segment Market Size and Analysis for
Mentioned Segments
Additional Company Profiles (Upto 5 With No Cost)
Additional Countries (Apart From Mentioned Countries)
Country/Region-specific Report
Go To Market Strategy
Region Specific Market DynamicsRegion Level Market Share Import Export AnalysisProduction AnalysisOthers