Liquefied Petroleum Gas Market Size, Share, Growth, Trends | Report 2023-2032
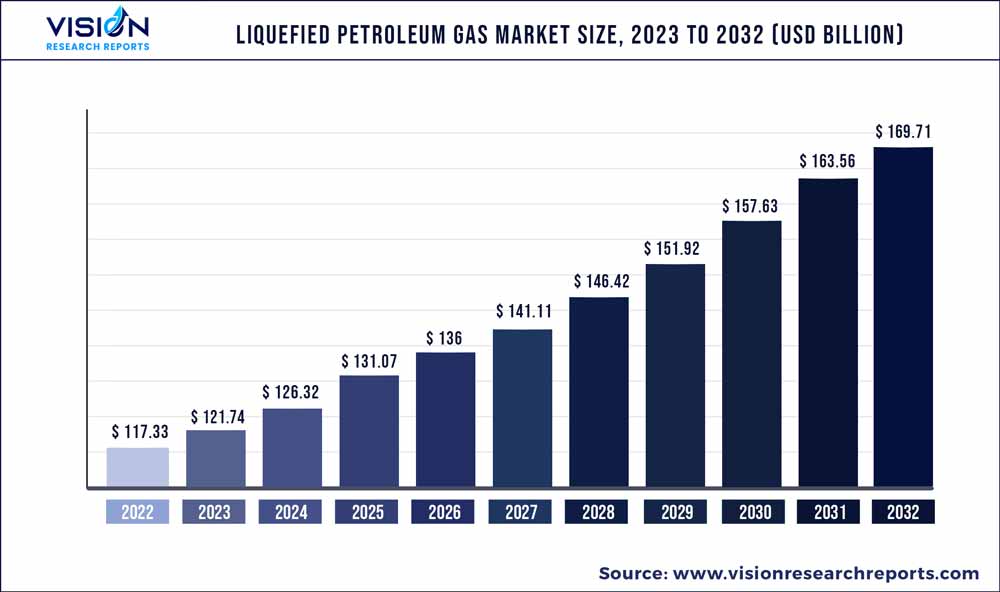
The global liquefied petroleum gas market was estimated at USD 117.33 billion in 2022 and it is expected to surpass around USD 169.71 billion by 2032, poised to grow at a CAGR of 3.76% from 2023 to 2032.
Key Pointers
Report Scope of the Liquefied Petroleum Gas Market
| Report Coverage | Details |
| Market Size in 2022 | USD 117.33 billion |
| Revenue Forecast by 2032 | USD 169.71 billion |
| Growth rate from 2023 to 2032 | CAGR of 3.76% |
| Base Year | 2022 |
| Forecast Period | 2023 to 2032 |
| Market Analysis (Terms Used) | Value (US$ Million/Billion) or (Volume/Units) |
| Regions Covered | North America, Europe, Asia Pacific, Latin America, Middle East & Africa |
| Companies Covered | Repsol; China Gas Holdings Ltd.; Saudi Arabian Oil Co.; FLAGA GmbH; Kleenheat; Bharat Petroleum Corporation Limited; JGC HOLDINGS CORPORATION; Phillips 66 Company; Chevron Corporation; Reliance Industries Limited; Exxon Mobil Corporation; Total; Royal Dutch Shell; Petroliam Nasional Berhad (PETRONAS); PetroChina Company Limited; Petredec Pte Limited; Qatargas Operating Company Limited; Petrofac Limited; Vitol; China Petroleum & Chemical Corporation; BP Plc. |
Growing demand for liquefied petroleum gas (LPG) from emerging countries is projected to drive the global market during the estimated period. Urbanization and industrialization have increased expressively across the world over the past few years. The flow of investments has changed from developed countries toward emerging countries owing to the low costs of labor and infrastructure.
Increasing prices of fuel and growing environmental concerns have upturned the countries’ attention towards LPG to be used as an alternative fuel, which is the main factor propelling the market growth. Some of the key government mandates such as Federal Emission Standards, and the California Air Resources Board Zero Emission Vehicle Mandate are turning the automotive industry towards more advanced technologies so as to reduce carbon emission and achieve fuel economy, which will directly increase the demand for LPG across the market.
Demand for LPG is anticipated to observe significant growth over the projected period on account of its numerous benefits, such as low cost, low-carbon emissions, and operational benefits. LPG is emerging as a striking option for the commercial sector, combined with low-carbon technologies and renewables to assimilate a reliable year with round the clock power supply with less carbon emissions.
The residential/commercial application segment accounted for a substantial share in 2019 and is estimated to witness significant growth in the next seven years. High demand for LPG as a heating fuel and for cooking purpose in the commercial as well as residential segments has been the major factor increasing its penetration in the sector.
The liquefied petroleum gas (LPG) market in the Asia Pacific conquered the global consumption and accounted for over 28.0% share of the total volume in 2019. The Asia Pacific is anticipated to witness significant growth during the forecast period. Increasing consumption of liquefied petroleum gas for domestic usage purposes, such as cooking fuel, coupled with initiatives taken by the government, mainly in India, China, and Indonesia, is projected to propel LPG demand across the region.
Source Insights
The non-associated gas source type accounted for more than USD 62.02 billion in 2022. The sources of the fuel differ from area to area, for example, in North America the majority of the gas is procured from natural gas processing units. However, Asia Pacific relies on its refineries for production. On a global scale, refineries are one of the primary sources of gas production. Escalating refining capacity, specifically in Saudi Arabia, Brazil, India, and China is projected to surge product supply over the upcoming years.
The demand for liquefied petroleum gas from associated gas in the Asia Pacific region was more than 17.0 million tons in 2022. It is likely to reach more than 23.0 million tons by 2032, increasing at an assessed CAGR of over 3.0% from 2023 to 2032. Non-associated sources accounted for a noteworthy revenue share and are projected to observe the fastest growth over the projected period.
The United States shale boom has occurred as a major drift resulting in excess in the global LPG market. The market has also witnessed substantial field developments in oil and gas wells coupled with growing on-site processing facilities mainly in Russia, China, the U.S., and Canada.
Application Insights
The chemical application type accounted for more than USD 19.03 billion in 2022. Commercial and residential application accounted for a substantial share in the LPG market. Extensive dependency on liquefied petroleum gas as a cooking fuel can be witnessed among the urban and rural residents across the regions such as Asia-Pacific and Central and South America.
Promising government subsidies and initiatives to endorse the product as the major substitute fuel to conventional fuels such as wood and coal that has been the key factors contributing towards market penetration. Liquefied petroleum gas is also replacing chlorofluorocarbon and hydrofluorocarbon as a refrigerant owed to nominal contribution toward the depletion of the ozone layer. This has led to amplified application opportunities in the commercial/residential segments in ventilating & heating applications in addition to cooking purposes.
Autogas is also projected to witness substantial growth in the near future owing to increasing alternate fuel demand in the transportation sector to minimize environmental concerns such as carbon emission levels and pollution levels. In addition, it is one of the cheapest energy sources, which is making it suitable for diesel and gasoline in the global transportation industry.
Regional Insights
Asia Pacific led to a surge in the global market with a net demand of more than 83.06 million tons in 2022. Population growth, ample resource availability, and high energy necessities coupled with easy affordability owed to the existence of government subsidies on LPG cylinders have been the key factors accountable for high market penetration. This is further maintained by the increasing petrochemical capacities across India, China, India, Thailand, and South Korea.
India is a prominent importer of liquefied petroleum gas demand in 2022, taking consignments at a steady rate from the United States and Middle East regions to fund domestic fuel usage. Prime Minister Narendra Modi announced that India had met its target to provide 80 million free cooking gas connections to the residents of the country, and 2020 demand will fulcrum on the capability of the government to sustain the market at low marketing prices. To that end, an entry of investment in liquefied petroleum gas receiving distribution pipelines (over 14 million mt/year) and terminals (over 12 million mt/year) will support LPG usage in India.
The LPG demand in Europe was more than USD 33.04 billion in 2022 and is expected to reach over USD 43.08 billion, growing at an estimated CAGR of over 3.01% from 2023 to 2032. Numerous summit meetings such as COP21 are taken into deliberation by many countries to decrease carbon emissions into the atmosphere. For instance, India is taking the initiative to use other cooking fuels for cooking purposes.
Mature economies of Europe and North America are anticipated to witness significant growth owing to growing awareness reduce carbon emissions. In Europe, Russia is forecasted to grow at the fastest CAGR of 4.9% in terms of revenue over the forecast period.
Liquefied Petroleum Gas Market Segmentations:
By Source
By Application
By Regional
Chapter 1. Introduction
1.1. Research Objective
1.2. Scope of the Study
1.3. Definition
Chapter 2. Research Methodology
2.1. Research Approach
2.2. Data Sources
2.3. Assumptions & Limitations
Chapter 3. Executive Summary
3.1. Market Snapshot
Chapter 4. Market Variables and Scope
4.1. Introduction
4.2. Market Classification and Scope
4.3. Industry Value Chain Analysis
4.3.1. Raw Material Procurement Analysis
4.3.2. Sales and Distribution Channel Analysis
4.3.3. Downstream Buyer Analysis
Chapter 5. COVID 19 Impact on Liquefied Petroleum Gas Market
5.1. COVID-19 Landscape: Liquefied Petroleum Gas Industry Impact
5.2. COVID 19 - Impact Assessment for the Industry
5.3. COVID 19 Impact: Global Major Government Policy
5.4. Market Trends and Opportunities in the COVID-19 Landscape
Chapter 6. Market Dynamics Analysis and Trends
6.1. Market Dynamics
6.1.1. Market Drivers
6.1.2. Market Restraints
6.1.3. Market Opportunities
6.2. Porter’s Five Forces Analysis
6.2.1. Bargaining power of suppliers
6.2.2. Bargaining power of buyers
6.2.3. Threat of substitute
6.2.4. Threat of new entrants
6.2.5. Degree of competition
Chapter 7. Competitive Landscape
7.1.1. Company Market Share/Positioning Analysis
7.1.2. Key Strategies Adopted by Players
7.1.3. Vendor Landscape
7.1.3.1. List of Suppliers
7.1.3.2. List of Buyers
Chapter 8. Global Liquefied Petroleum Gas Market, By Source
8.1. Liquefied Petroleum Gas Market, by Source, 2023-2032
8.1.1. Refinery
8.1.1.1. Market Revenue and Forecast (2020-2032)
8.1.2. Associated Gas
8.1.2.1. Market Revenue and Forecast (2020-2032)
8.1.3. Non-Associated Gas
8.1.3.1. Market Revenue and Forecast (2020-2032)
Chapter 9. Global Liquefied Petroleum Gas Market, By Application
9.1. Liquefied Petroleum Gas Market, by Application, 2023-2032
9.1.1. Residential/Commercial
9.1.1.1. Market Revenue and Forecast (2020-2032)
9.1.2. Chemical
9.1.2.1. Market Revenue and Forecast (2020-2032)
9.1.3. Industrial
9.1.3.1. Market Revenue and Forecast (2020-2032)
9.1.4. Autogas
9.1.4.1. Market Revenue and Forecast (2020-2032)
9.1.5. Refinery
9.1.5.1. Market Revenue and Forecast (2020-2032)
9.1.6. Others
9.1.6.1. Market Revenue and Forecast (2020-2032)
Chapter 10. Global Liquefied Petroleum Gas Market, Regional Estimates and Trend Forecast
10.1. North America
10.1.1. Market Revenue and Forecast, by Source (2020-2032)
10.1.2. Market Revenue and Forecast, by Application (2020-2032)
10.1.3. U.S.
10.1.3.1. Market Revenue and Forecast, by Source (2020-2032)
10.1.3.2. Market Revenue and Forecast, by Application (2020-2032)
10.1.4. Rest of North America
10.1.4.1. Market Revenue and Forecast, by Source (2020-2032)
10.1.4.2. Market Revenue and Forecast, by Application (2020-2032)
10.2. Europe
10.2.1. Market Revenue and Forecast, by Source (2020-2032)
10.2.2. Market Revenue and Forecast, by Application (2020-2032)
10.2.3. UK
10.2.3.1. Market Revenue and Forecast, by Source (2020-2032)
10.2.3.2. Market Revenue and Forecast, by Application (2020-2032)
10.2.4. Germany
10.2.4.1. Market Revenue and Forecast, by Source (2020-2032)
10.2.4.2. Market Revenue and Forecast, by Application (2020-2032)
10.2.5. France
10.2.5.1. Market Revenue and Forecast, by Source (2020-2032)
10.2.5.2. Market Revenue and Forecast, by Application (2020-2032)
10.2.6. Rest of Europe
10.2.6.1. Market Revenue and Forecast, by Source (2020-2032)
10.2.6.2. Market Revenue and Forecast, by Application (2020-2032)
10.3. APAC
10.3.1. Market Revenue and Forecast, by Source (2020-2032)
10.3.2. Market Revenue and Forecast, by Application (2020-2032)
10.3.3. India
10.3.3.1. Market Revenue and Forecast, by Source (2020-2032)
10.3.3.2. Market Revenue and Forecast, by Application (2020-2032)
10.3.4. China
10.3.4.1. Market Revenue and Forecast, by Source (2020-2032)
10.3.4.2. Market Revenue and Forecast, by Application (2020-2032)
10.3.5. Japan
10.3.5.1. Market Revenue and Forecast, by Source (2020-2032)
10.3.5.2. Market Revenue and Forecast, by Application (2020-2032)
10.3.6. Rest of APAC
10.3.6.1. Market Revenue and Forecast, by Source (2020-2032)
10.3.6.2. Market Revenue and Forecast, by Application (2020-2032)
10.4. MEA
10.4.1. Market Revenue and Forecast, by Source (2020-2032)
10.4.2. Market Revenue and Forecast, by Application (2020-2032)
10.4.3. GCC
10.4.3.1. Market Revenue and Forecast, by Source (2020-2032)
10.4.3.2. Market Revenue and Forecast, by Application (2020-2032)
10.4.4. North Africa
10.4.4.1. Market Revenue and Forecast, by Source (2020-2032)
10.4.4.2. Market Revenue and Forecast, by Application (2020-2032)
10.4.5. South Africa
10.4.5.1. Market Revenue and Forecast, by Source (2020-2032)
10.4.5.2. Market Revenue and Forecast, by Application (2020-2032)
10.4.6. Rest of MEA
10.4.6.1. Market Revenue and Forecast, by Source (2020-2032)
10.4.6.2. Market Revenue and Forecast, by Application (2020-2032)
10.5. Latin America
10.5.1. Market Revenue and Forecast, by Source (2020-2032)
10.5.2. Market Revenue and Forecast, by Application (2020-2032)
10.5.3. Brazil
10.5.3.1. Market Revenue and Forecast, by Source (2020-2032)
10.5.3.2. Market Revenue and Forecast, by Application (2020-2032)
10.5.4. Rest of LATAM
10.5.4.1. Market Revenue and Forecast, by Source (2020-2032)
10.5.4.2. Market Revenue and Forecast, by Application (2020-2032)
Chapter 11. Company Profiles
11.1. Repsol
11.1.1. Company Overview
11.1.2. Product Offerings
11.1.3. Financial Performance
11.1.4. Recent Initiatives
11.2. China Gas Holdings Ltd.
11.2.1. Company Overview
11.2.2. Product Offerings
11.2.3. Financial Performance
11.2.4. Recent Initiatives
11.3. Saudi Arabian Oil Co.
11.3.1. Company Overview
11.3.2. Product Offerings
11.3.3. Financial Performance
11.3.4. Recent Initiatives
11.4. FLAGA GmbH
11.4.1. Company Overview
11.4.2. Product Offerings
11.4.3. Financial Performance
11.4.4. LTE Scientific
11.5. Kleenheat
11.5.1. Company Overview
11.5.2. Product Offerings
11.5.3. Financial Performance
11.5.4. Recent Initiatives
11.6. Bharat Petroleum Corporation Limited
11.6.1. Company Overview
11.6.2. Product Offerings
11.6.3. Financial Performance
11.6.4. Recent Initiatives
11.7. JGC HOLDINGS CORPORATION
11.7.1. Company Overview
11.7.2. Product Offerings
11.7.3. Financial Performance
11.7.4. Recent Initiatives
11.8. Phillips 66 Company
11.8.1. Company Overview
11.8.2. Product Offerings
11.8.3. Financial Performance
11.8.4. Recent Initiatives
11.9. Chevron Corporation
11.9.1. Company Overview
11.9.2. Product Offerings
11.9.3. Financial Performance
11.9.4. Recent Initiatives
11.10. Reliance Industries Limited
11.10.1. Company Overview
11.10.2. Product Offerings
11.10.3. Financial Performance
11.10.4. Recent Initiatives
Chapter 12. Research Methodology
12.1. Primary Research
12.2. Secondary Research
12.3. Assumptions
Chapter 13. Appendix
13.1. About Us
13.2. Glossary of Terms
 Cross-segment Market Size and Analysis for
Mentioned Segments
Additional Company Profiles (Upto 5 With No Cost)
Additional Countries (Apart From Mentioned Countries)
Country/Region-specific Report
Go To Market Strategy
Region Specific Market DynamicsRegion Level Market Share Import Export AnalysisProduction AnalysisOthers
Cross-segment Market Size and Analysis for
Mentioned Segments
Additional Company Profiles (Upto 5 With No Cost)
Additional Countries (Apart From Mentioned Countries)
Country/Region-specific Report
Go To Market Strategy
Region Specific Market DynamicsRegion Level Market Share Import Export AnalysisProduction AnalysisOthers