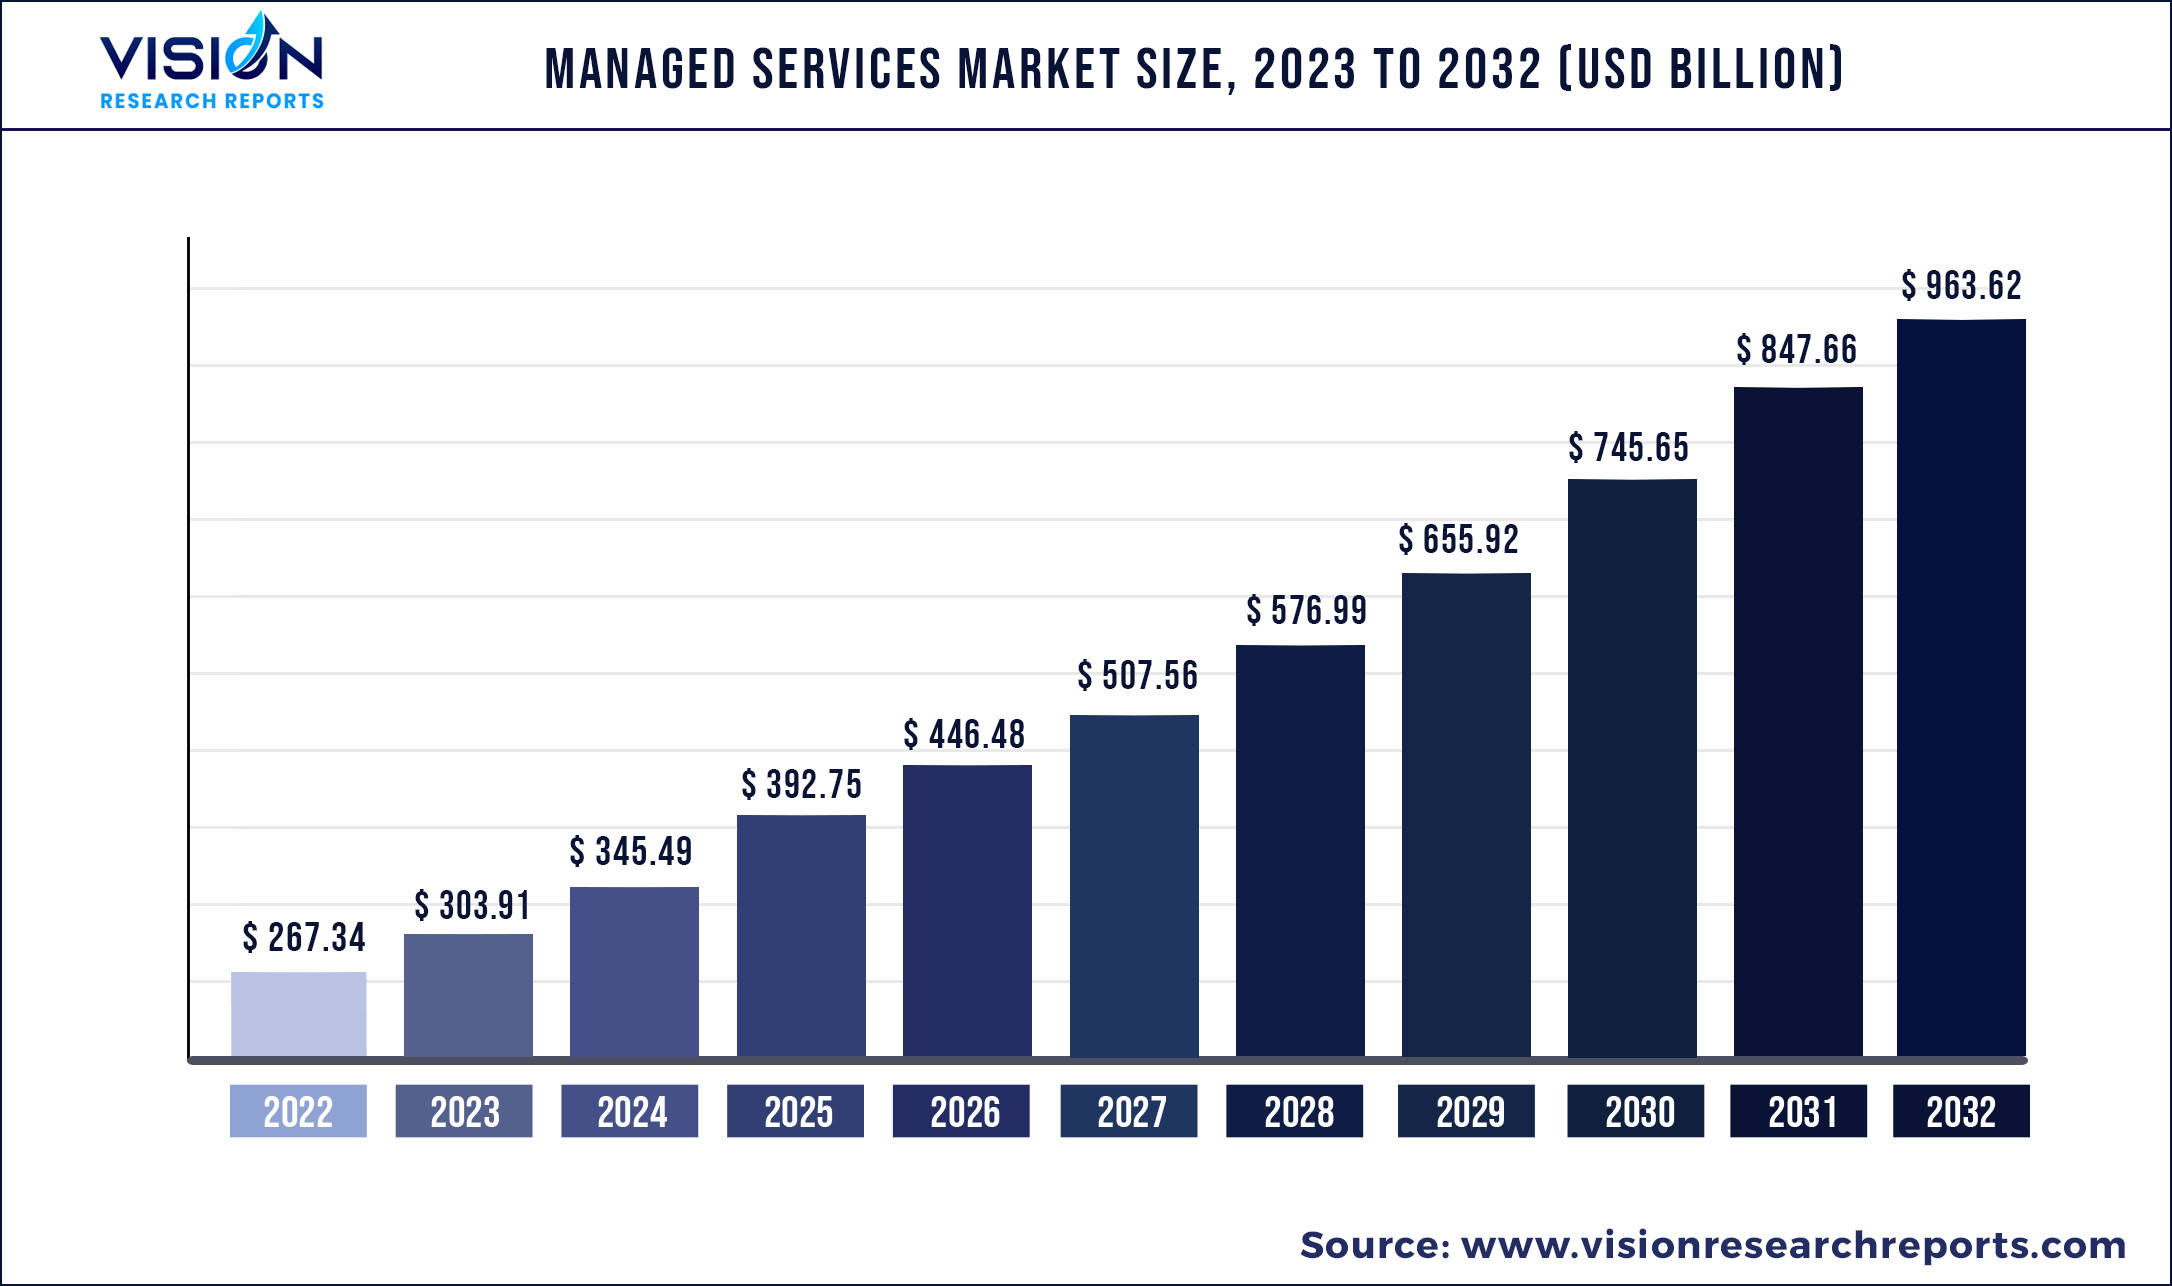
The global managed services market was surpassed at USD 267.34 billion in 2022 and is expected to hit around USD 963.62 billion by 2032, growing at a CAGR of 13.68% from 2023 to 2032.
Key Pointers
| Report Coverage | Details |
| Market Size in 2022 | USD 267.34 billion |
| Revenue Forecast by 2032 | USD 963.62 billion |
| Growth rate from 2023 to 2032 | CAGR of 13.68% |
| Base Year | 2022 |
| Forecast Period | 2023 to 2032 |
| Regions Covered | North America, Europe, Asia Pacific, Latin America, Middle East & Africa |
| Companies Covered | Accenture PLC; Fujitsu Limited; International Business Machines Corporation; Cisco Systems, Inc.; Ericsson; Lenovo Group Limited; DXC Technology Company; Hewlett Packard Enterprise Development LP. |
Managed services reduce downtime redundancy and provide customized value-added services like application testing, service catalog building, and expert consultancy. Multiple monitoring tools and several layers of infrastructure managed by isolated teams contribute to the market growth. For instance, in April 2021, BMC launched the "BMC Helix ITSM," a centralized, cloud-native, observability, and AIOps-integrated system. Data from IT infrastructure, application performance, network performance, and cloud monitoring tools is completely visible through this system. Additionally, individual and team dashboards are tailored to the requirements of each user.
Factors such as improving operational efficiency by focusing more effectively on core competencies, cutting operating expenses, and increasing the use of cloud-based technologies such as automation, IoT, blockchain, and cloud computing are driving the market growth. Moreover, managed services focus on providing secure and customized IT solutions and end-to-end hosting applications is expected to drive market growth. Additionally, the emergence of the COVID-19 pandemic led to disruption in business operations and the supply chain. Thus, with a sudden change in business operations and remote working solutions, employees required access to different work applications for company-owned devices. Organizations have therefore started relying more on managed services during the Covid-19 pandemic.
Managed services involve outsourcing management functions to a third party to advance business operations. The introduction of cloud-based technologies and their technological proliferation have led to managed services. Managed services assist businesses in improving operational efficiency and cutting down companies' operating expenses. The growing preference for outsourcing management functions to cloud service providers and managed service providers is anticipated to drive the market's growth over the forecast period.
The adoption of the latest technologies such as artificial intelligence (AI), cloud management, and others is eventually helping organizations meet various functional business requirements while driving business process optimization. Managed services deliver effective functionalities at minimal costs without compromising on quality. Additionally, managed services also support and ensure the reliability and consistency of services offered for various business processes.
As cyber threats become more prevalent, organizations are adopting managed security services (MSSs) into their business models. There is an increase in cyber threats in government sectors and enterprises. Thus, forcing MSPs to develop advanced offerings that can detect and address cyber risks. For instance. in June 2021, Internal Business Machines Corporation (IBM) announced the IBM Center for Government Cybersecurity, designed to meet the cybersecurity needs of federal agencies.
Managed Services Market Segmentations:
| By Solution | By Managed Information Service (MIS) | By Deployment | By Enterprise Size | By End-use |
|
Managed Data Center Managed Network Managed Mobility Managed Infrastructure Managed Backup and Recovery Managed Communication Managed Information Managed Security |
Business Process Outsourcing (BPO) Business Support Systems Project & Portfolio Management Others |
On-premise Hosted |
Small & Medium Enterprises (SMEs) Large Enterprises |
Financial Services Government Healthcare IT & Telecom Manufacturing Media & Entertainment Retail Others |
Chapter 1. Introduction
1.1. Research Objective
1.2. Scope of the Study
1.3. Definition
Chapter 2. Research Methodology
2.1. Research Approach
2.2. Data Sources
2.3. Assumptions & Limitations
Chapter 3. Executive Summary
3.1. Market Snapshot
Chapter 4. Market Variables and Scope
4.1. Introduction
4.2. Market Classification and Scope
4.3. Industry Value Chain Analysis
4.3.1. Raw Material Procurement Analysis
4.3.2. Sales and Distribution Channel Analysis
4.3.3. Downstream Buyer Analysis
Chapter 5. COVID 19 Impact on Managed Services Market
5.1. COVID-19 Landscape: Managed Services Industry Impact
5.2. COVID 19 - Impact Assessment for the Industry
5.3. COVID 19 Impact: Global Major Government Policy
5.4. Market Trends and Opportunities in the COVID-19 Landscape
Chapter 6. Market Dynamics Analysis and Trends
6.1. Market Dynamics
6.1.1. Market Drivers
6.1.2. Market Restraints
6.1.3. Market Opportunities
6.2. Porter’s Five Forces Analysis
6.2.1. Bargaining power of suppliers
6.2.2. Bargaining power of buyers
6.2.3. Threat of substitute
6.2.4. Threat of new entrants
6.2.5. Degree of competition
Chapter 7. Competitive Landscape
7.1.1. Company Market Share/Positioning Analysis
7.1.2. Key Strategies Adopted by Players
7.1.3. Vendor Landscape
7.1.3.1. List of Suppliers
7.1.3.2. List of Buyers
Chapter 8. Global Managed Services Market, By Solution
8.1. Managed Services Market, by Solution, 2023-2032
8.1.1. Managed Data Center
8.1.1.1. Market Revenue and Forecast (2020-2032)
8.1.2. Managed Network
8.1.2.1. Market Revenue and Forecast (2020-2032)
8.1.3. Managed Mobility
8.1.3.1. Market Revenue and Forecast (2020-2032)
8.1.4. Managed Infrastructure
8.1.4.1. Market Revenue and Forecast (2020-2032)
8.1.5. Managed Backup and Recovery
8.1.5.1. Market Revenue and Forecast (2020-2032)
8.1.6. Managed Communication
8.1.6.1. Market Revenue and Forecast (2020-2032)
8.1.7. Managed Information
8.1.7.1. Market Revenue and Forecast (2020-2032)
8.1.8. Managed Security
8.1.8.1. Market Revenue and Forecast (2020-2032)
Chapter 9. Global Managed Services Market, By Managed Information Service (MIS)
9.1. Managed Services Market, by Managed Information Service (MIS), 2023-2032
9.1.1. Business Process Outsourcing (BPO)
9.1.1.1. Market Revenue and Forecast (2020-2032)
9.1.2. Business Support Systems
9.1.2.1. Market Revenue and Forecast (2020-2032)
9.1.3. Project & Portfolio Management
9.1.3.1. Market Revenue and Forecast (2020-2032)
9.1.4. Others
9.1.4.1. Market Revenue and Forecast (2020-2032)
Chapter 10. Global Managed Services Market, By Deployment
10.1. Managed Services Market, by Deployment, 2023-2032
10.1.1. On-premise
10.1.1.1. Market Revenue and Forecast (2020-2032)
10.1.2. Hosted
10.1.2.1. Market Revenue and Forecast (2020-2032)
Chapter 11. Global Managed Services Market, By Enterprise Size
11.1. Managed Services Market, by Enterprise Size, 2023-2032
11.1.1. Small & Medium Enterprises (SMEs)
11.1.1.1. Market Revenue and Forecast (2020-2032)
11.1.2. Large Enterprises
11.1.2.1. Market Revenue and Forecast (2020-2032)
Chapter 12. Global Managed Services Market, By End-use
12.1. Managed Services Market, by End-use, 2023-2032
12.1.1. Financial Services
12.1.1.1. Market Revenue and Forecast (2020-2032)
12.1.2. Government
12.1.2.1. Market Revenue and Forecast (2020-2032)
12.1.3. Healthcare
12.1.3.1. Market Revenue and Forecast (2020-2032)
12.1.4. IT & Telecom
12.1.4.1. Market Revenue and Forecast (2020-2032)
12.1.5. Manufacturing
12.1.5.1. Market Revenue and Forecast (2020-2032)
12.1.6. Media & Entertainment
12.1.6.1. Market Revenue and Forecast (2020-2032)
12.1.7. Retail
12.1.7.1. Market Revenue and Forecast (2020-2032)
12.1.8. Others
12.1.8.1. Market Revenue and Forecast (2020-2032)
Chapter 13. Global Managed Services Market, Regional Estimates and Trend Forecast
13.1. North America
13.1.1. Market Revenue and Forecast, by Solution (2020-2032)
13.1.2. Market Revenue and Forecast, by Managed Information Service (MIS) (2020-2032)
13.1.3. Market Revenue and Forecast, by Deployment (2020-2032)
13.1.4. Market Revenue and Forecast, by Enterprise Size (2020-2032)
13.1.5. Market Revenue and Forecast, by End-use (2020-2032)
13.1.6. U.S.
13.1.6.1. Market Revenue and Forecast, by Solution (2020-2032)
13.1.6.2. Market Revenue and Forecast, by Managed Information Service (MIS) (2020-2032)
13.1.6.3. Market Revenue and Forecast, by Deployment (2020-2032)
13.1.6.4. Market Revenue and Forecast, by Enterprise Size (2020-2032)
13.1.7. Market Revenue and Forecast, by End-use (2020-2032)
13.1.8. Rest of North America
13.1.8.1. Market Revenue and Forecast, by Solution (2020-2032)
13.1.8.2. Market Revenue and Forecast, by Managed Information Service (MIS) (2020-2032)
13.1.8.3. Market Revenue and Forecast, by Deployment (2020-2032)
13.1.8.4. Market Revenue and Forecast, by Enterprise Size (2020-2032)
13.1.8.5. Market Revenue and Forecast, by End-use (2020-2032)
13.2. Europe
13.2.1. Market Revenue and Forecast, by Solution (2020-2032)
13.2.2. Market Revenue and Forecast, by Managed Information Service (MIS) (2020-2032)
13.2.3. Market Revenue and Forecast, by Deployment (2020-2032)
13.2.4. Market Revenue and Forecast, by Enterprise Size (2020-2032)
13.2.5. Market Revenue and Forecast, by End-use (2020-2032)
13.2.6. UK
13.2.6.1. Market Revenue and Forecast, by Solution (2020-2032)
13.2.6.2. Market Revenue and Forecast, by Managed Information Service (MIS) (2020-2032)
13.2.6.3. Market Revenue and Forecast, by Deployment (2020-2032)
13.2.7. Market Revenue and Forecast, by Enterprise Size (2020-2032)
13.2.8. Market Revenue and Forecast, by End-use (2020-2032)
13.2.9. Germany
13.2.9.1. Market Revenue and Forecast, by Solution (2020-2032)
13.2.9.2. Market Revenue and Forecast, by Managed Information Service (MIS) (2020-2032)
13.2.9.3. Market Revenue and Forecast, by Deployment (2020-2032)
13.2.10. Market Revenue and Forecast, by Enterprise Size (2020-2032)
13.2.11. Market Revenue and Forecast, by End-use (2020-2032)
13.2.12. France
13.2.12.1. Market Revenue and Forecast, by Solution (2020-2032)
13.2.12.2. Market Revenue and Forecast, by Managed Information Service (MIS) (2020-2032)
13.2.12.3. Market Revenue and Forecast, by Deployment (2020-2032)
13.2.12.4. Market Revenue and Forecast, by Enterprise Size (2020-2032)
13.2.13. Market Revenue and Forecast, by End-use (2020-2032)
13.2.14. Rest of Europe
13.2.14.1. Market Revenue and Forecast, by Solution (2020-2032)
13.2.14.2. Market Revenue and Forecast, by Managed Information Service (MIS) (2020-2032)
13.2.14.3. Market Revenue and Forecast, by Deployment (2020-2032)
13.2.14.4. Market Revenue and Forecast, by Enterprise Size (2020-2032)
13.2.15. Market Revenue and Forecast, by End-use (2020-2032)
13.3. APAC
13.3.1. Market Revenue and Forecast, by Solution (2020-2032)
13.3.2. Market Revenue and Forecast, by Managed Information Service (MIS) (2020-2032)
13.3.3. Market Revenue and Forecast, by Deployment (2020-2032)
13.3.4. Market Revenue and Forecast, by Enterprise Size (2020-2032)
13.3.5. Market Revenue and Forecast, by End-use (2020-2032)
13.3.6. India
13.3.6.1. Market Revenue and Forecast, by Solution (2020-2032)
13.3.6.2. Market Revenue and Forecast, by Managed Information Service (MIS) (2020-2032)
13.3.6.3. Market Revenue and Forecast, by Deployment (2020-2032)
13.3.6.4. Market Revenue and Forecast, by Enterprise Size (2020-2032)
13.3.7. Market Revenue and Forecast, by End-use (2020-2032)
13.3.8. China
13.3.8.1. Market Revenue and Forecast, by Solution (2020-2032)
13.3.8.2. Market Revenue and Forecast, by Managed Information Service (MIS) (2020-2032)
13.3.8.3. Market Revenue and Forecast, by Deployment (2020-2032)
13.3.8.4. Market Revenue and Forecast, by Enterprise Size (2020-2032)
13.3.9. Market Revenue and Forecast, by End-use (2020-2032)
13.3.10. Japan
13.3.10.1. Market Revenue and Forecast, by Solution (2020-2032)
13.3.10.2. Market Revenue and Forecast, by Managed Information Service (MIS) (2020-2032)
13.3.10.3. Market Revenue and Forecast, by Deployment (2020-2032)
13.3.10.4. Market Revenue and Forecast, by Enterprise Size (2020-2032)
13.3.10.5. Market Revenue and Forecast, by End-use (2020-2032)
13.3.11. Rest of APAC
13.3.11.1. Market Revenue and Forecast, by Solution (2020-2032)
13.3.11.2. Market Revenue and Forecast, by Managed Information Service (MIS) (2020-2032)
13.3.11.3. Market Revenue and Forecast, by Deployment (2020-2032)
13.3.11.4. Market Revenue and Forecast, by Enterprise Size (2020-2032)
13.3.11.5. Market Revenue and Forecast, by End-use (2020-2032)
13.4. MEA
13.4.1. Market Revenue and Forecast, by Solution (2020-2032)
13.4.2. Market Revenue and Forecast, by Managed Information Service (MIS) (2020-2032)
13.4.3. Market Revenue and Forecast, by Deployment (2020-2032)
13.4.4. Market Revenue and Forecast, by Enterprise Size (2020-2032)
13.4.5. Market Revenue and Forecast, by End-use (2020-2032)
13.4.6. GCC
13.4.6.1. Market Revenue and Forecast, by Solution (2020-2032)
13.4.6.2. Market Revenue and Forecast, by Managed Information Service (MIS) (2020-2032)
13.4.6.3. Market Revenue and Forecast, by Deployment (2020-2032)
13.4.6.4. Market Revenue and Forecast, by Enterprise Size (2020-2032)
13.4.7. Market Revenue and Forecast, by End-use (2020-2032)
13.4.8. North Africa
13.4.8.1. Market Revenue and Forecast, by Solution (2020-2032)
13.4.8.2. Market Revenue and Forecast, by Managed Information Service (MIS) (2020-2032)
13.4.8.3. Market Revenue and Forecast, by Deployment (2020-2032)
13.4.8.4. Market Revenue and Forecast, by Enterprise Size (2020-2032)
13.4.9. Market Revenue and Forecast, by End-use (2020-2032)
13.4.10. South Africa
13.4.10.1. Market Revenue and Forecast, by Solution (2020-2032)
13.4.10.2. Market Revenue and Forecast, by Managed Information Service (MIS) (2020-2032)
13.4.10.3. Market Revenue and Forecast, by Deployment (2020-2032)
13.4.10.4. Market Revenue and Forecast, by Enterprise Size (2020-2032)
13.4.10.5. Market Revenue and Forecast, by End-use (2020-2032)
13.4.11. Rest of MEA
13.4.11.1. Market Revenue and Forecast, by Solution (2020-2032)
13.4.11.2. Market Revenue and Forecast, by Managed Information Service (MIS) (2020-2032)
13.4.11.3. Market Revenue and Forecast, by Deployment (2020-2032)
13.4.11.4. Market Revenue and Forecast, by Enterprise Size (2020-2032)
13.4.11.5. Market Revenue and Forecast, by End-use (2020-2032)
13.5. Latin America
13.5.1. Market Revenue and Forecast, by Solution (2020-2032)
13.5.2. Market Revenue and Forecast, by Managed Information Service (MIS) (2020-2032)
13.5.3. Market Revenue and Forecast, by Deployment (2020-2032)
13.5.4. Market Revenue and Forecast, by Enterprise Size (2020-2032)
13.5.5. Market Revenue and Forecast, by End-use (2020-2032)
13.5.6. Brazil
13.5.6.1. Market Revenue and Forecast, by Solution (2020-2032)
13.5.6.2. Market Revenue and Forecast, by Managed Information Service (MIS) (2020-2032)
13.5.6.3. Market Revenue and Forecast, by Deployment (2020-2032)
13.5.6.4. Market Revenue and Forecast, by Enterprise Size (2020-2032)
13.5.7. Market Revenue and Forecast, by End-use (2020-2032)
13.5.8. Rest of LATAM
13.5.8.1. Market Revenue and Forecast, by Solution (2020-2032)
13.5.8.2. Market Revenue and Forecast, by Managed Information Service (MIS) (2020-2032)
13.5.8.3. Market Revenue and Forecast, by Deployment (2020-2032)
13.5.8.4. Market Revenue and Forecast, by Enterprise Size (2020-2032)
13.5.8.5. Market Revenue and Forecast, by End-use (2020-2032)
Chapter 14. Company Profiles
14.1. Accenture PLC
14.1.1. Company Overview
14.1.2. Product Offerings
14.1.3. Financial Performance
14.1.4. Recent Initiatives
14.2. Fujitsu Limited
14.2.1. Company Overview
14.2.2. Product Offerings
14.2.3. Financial Performance
14.2.4. Recent Initiatives
14.3. International Business Machines Corporation
14.3.1. Company Overview
14.3.2. Product Offerings
14.3.3. Financial Performance
14.3.4. Recent Initiatives
14.4. Cisco Systems, Inc.
14.4.1. Company Overview
14.4.2. Product Offerings
14.4.3. Financial Performance
14.4.4. Recent Initiatives
14.5. Ericsson
14.5.1. Company Overview
14.5.2. Product Offerings
14.5.3. Financial Performance
14.5.4. Recent Initiatives
14.6. Lenovo Group Limited
14.6.1. Company Overview
14.6.2. Product Offerings
14.6.3. Financial Performance
14.6.4. Recent Initiatives
14.7. DXC Technology Company
14.7.1. Company Overview
14.7.2. Product Offerings
14.7.3. Financial Performance
14.7.4. Recent Initiatives
14.8. Hewlett Packard Enterprise Development LP.
14.8.1. Company Overview
14.8.2. Product Offerings
14.8.3. Financial Performance
14.8.4. Recent Initiatives
Chapter 15. Research Methodology
15.1. Primary Research
15.2. Secondary Research
15.3. Assumptions
Chapter 16. Appendix
16.1. About Us
16.2. Glossary of Terms
 Cross-segment Market Size and Analysis for
Mentioned Segments
Additional Company Profiles (Upto 5 With No Cost)
Additional Countries (Apart From Mentioned Countries)
Country/Region-specific Report
Go To Market Strategy
Region Specific Market DynamicsRegion Level Market Share Import Export AnalysisProduction AnalysisOthers
Cross-segment Market Size and Analysis for
Mentioned Segments
Additional Company Profiles (Upto 5 With No Cost)
Additional Countries (Apart From Mentioned Countries)
Country/Region-specific Report
Go To Market Strategy
Region Specific Market DynamicsRegion Level Market Share Import Export AnalysisProduction AnalysisOthers