Marine Propulsion Engines Market Size, Trends, Share, Growth | Report 2023-2032
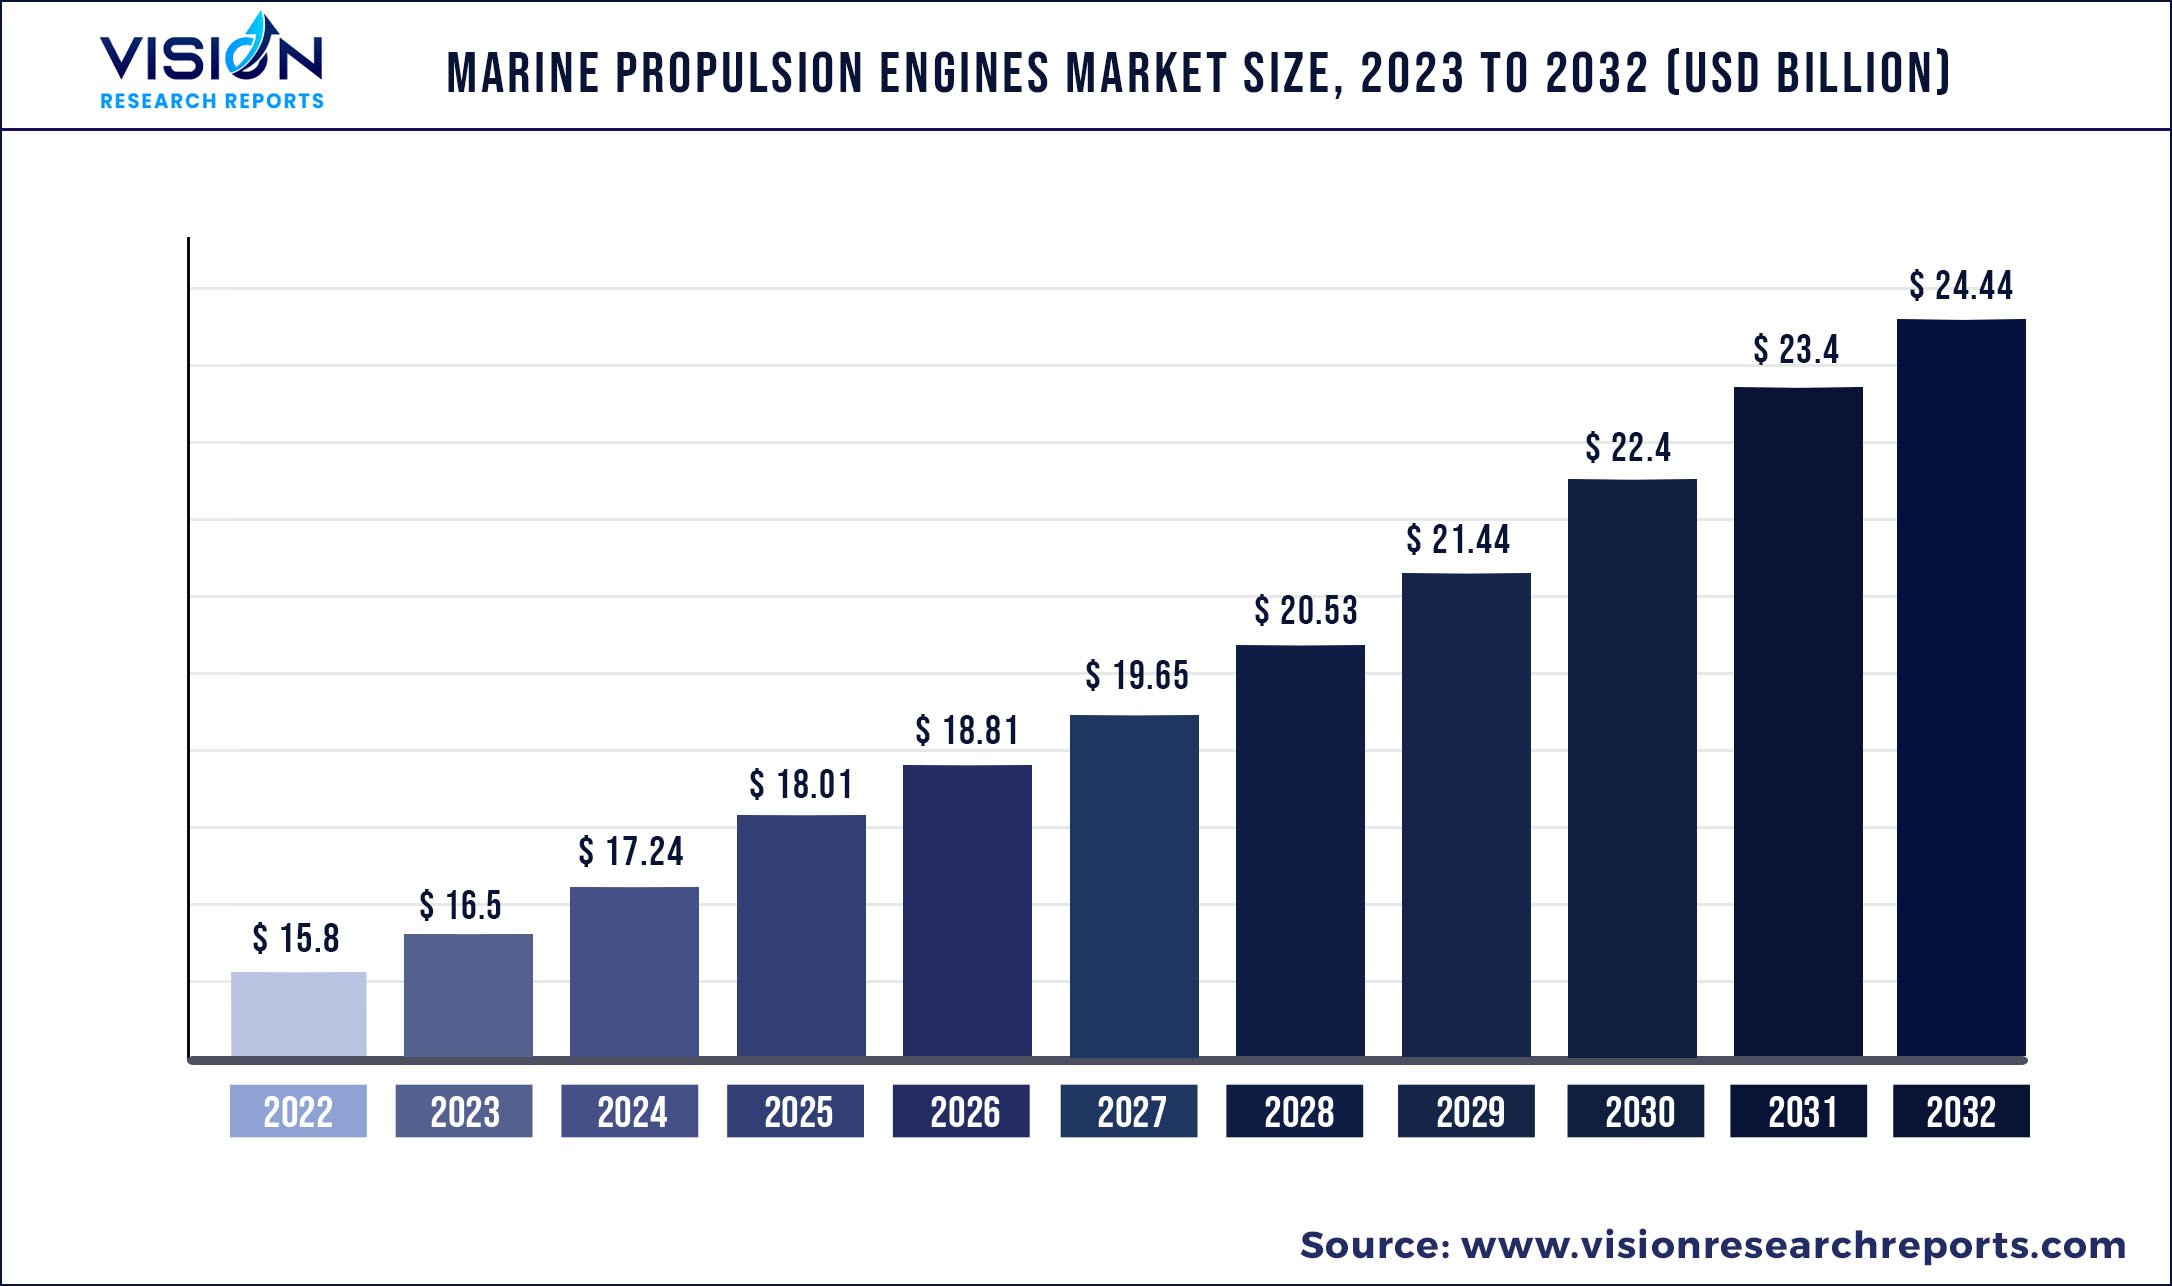
The global marine propulsion engines market was surpassed at USD 15.8 billion in 2022 and is expected to hit around USD 24.44 billion by 2032, growing at a CAGR of 4.46% from 2023 to 2032.
Key Pointers
| Report Coverage | Details |
| Market Size in 2022 | USD 15.8 billion |
| Revenue Forecast by 2032 | USD 24.44 billion |
| Growth rate from 2023 to 2032 | CAGR of 4.46% |
| Base Year | 2022 |
| Forecast Period | 2023 to 2032 |
| Regions Covered | North America, Europe, Asia Pacific, Latin America, Middle East & Africa |
| Companies Covered | Caterpillar; Hyundai Heavy Industries Co. Ltd.; Mitsubishi Heavy Industries Ltd.; Volvo Penta; Daihatsu Diesel MFG. Co. Ltd.; General Electric Company; Yanmar Holdings Co. Ltd.; IHI Power Systems Co. Ltd.; Wartsila; Rolls Royce Plc; Volkswagen Group (MAN Energy Solutions S.E.), Others |
The marine industry is increasing steadily due to dependency on the ships for transportation of goods required such as natural resources, and consumer supplies among other resources. The ships require high-performance engines for sailing the distance in lesser time and also powerful engines to bear the load of the ships. Such engines are usually powered by diesel engines, as they are reliable and require less maintenance as compared with other types of engines. The rising international trade on account of increasing globalization and industrialization is escalating the demand for container ship to transport various products such as oil, natural gas, and minerals.
The increasing focus on reducing fossil fuel consumption and improving efficiency is escalating the adoption of marine electric propulsion engines. The increase in the usage of LNG and nuclear propulsion, along with the rise in demand for the diesel-based marine propulsion engine market is driving the growth of the market. Moreover, as newer technologies engines that are installed in the ships are mostly based on nuclear power which works without refueling for more than 20 years, a small amount of nuclear fuel is also engaged in providing energy equivalent to a larger amount of coal and oil engines.
Dual-fuel diesel (DFD) marine propulsion engines have been installed as prime movers aboard LNG carriers to maximize natural gas use. LNG vessel propulsion systems are usually equipped with waste heat reduction systems (WHRs) as such systems help reduce emissions, enhanced fuel efficiency, and better engine performance. Switching to LNG-powered vessels is a complicated task for companies, however, they can combine modern WHRs with the engines to enhance their performance. Furthermore, the increased emphasis on decreasing fossil fuel use and improving energy efficiency encourages the global adoption of marine electric propulsion engines. Alternative fuels such as algal oils and bio-methane are also being utilized to power marine propulsion engines with minimal gas emissions as technology progresses and environmental awareness rises.
Regional Insights
Currently, Asia Pacific is witnessing strong maritime trade and shipping growth, resulting in an increase in demand for marine propulsion engines. The market is gaining momentum and is anticipated to reveal a CAGR of 4.06% during forecast period. China has become the world's largest exporter, necessitating a significant number of commercial ships, boosting the market expansion of the marine propulsion engines industry. Furthermore, Asian navies are expanding their maritime defense capabilities, likely raising market size.
North America is anticipated to have a significant impact on the marine propulsion engines market throughout the projected period. The area anticipates requiring marine engine producers to create motors that adhere to US EPA New Source Performance Standards (NSPS). Due to the expanding seaborne trade, the region's marine propulsion engine market is expected to develop faster than the world average.
Marine Propulsion Engines Market Segmentations:
By Fuel Type
By Application
By Power Range
Chapter 1. Introduction
1.1. Research Objective
1.2. Scope of the Study
1.3. Definition
Chapter 2. Research Methodology
2.1. Research Approach
2.2. Data Sources
2.3. Assumptions & Limitations
Chapter 3. Executive Summary
3.1. Market Snapshot
Chapter 4. Market Variables and Scope
4.1. Introduction
4.2. Market Classification and Scope
4.3. Industry Value Chain Analysis
4.3.1. Raw Material Procurement Analysis
4.3.2. Sales and Distribution Channel Analysis
4.3.3. Downstream Buyer Analysis
Chapter 5. COVID 19 Impact on Marine Propulsion Engines Market
5.1. COVID-19 Landscape: Marine Propulsion Engines Industry Impact
5.2. COVID 19 - Impact Assessment for the Industry
5.3. COVID 19 Impact: Global Major Government Policy
5.4. Market Trends and Opportunities in the COVID-19 Landscape
Chapter 6. Market Dynamics Analysis and Trends
6.1. Market Dynamics
6.1.1. Market Drivers
6.1.2. Market Restraints
6.1.3. Market Opportunities
6.2. Porter’s Five Forces Analysis
6.2.1. Bargaining power of suppliers
6.2.2. Bargaining power of buyers
6.2.3. Threat of substitute
6.2.4. Threat of new entrants
6.2.5. Degree of competition
Chapter 7. Competitive Landscape
7.1.1. Company Market Share/Positioning Analysis
7.1.2. Key Strategies Adopted by Players
7.1.3. Vendor Landscape
7.1.3.1. List of Suppliers
7.1.3.2. List of Buyers
Chapter 8. Global Marine Propulsion Engines Market, By Fuel Type
8.1. Marine Propulsion Engines Market, by Fuel Type, 2023-2032
8.1.1 Diesel
8.1.1.1. Market Revenue and Forecast (2020-2032)
8.1.2. Heavy Fuel Oil
8.1.2.1. Market Revenue and Forecast (2020-2032)
8.1.3. Natural Gas
8.1.3.1. Market Revenue and Forecast (2020-2032)
8.1.4. Other Fuels
8.1.4.1. Market Revenue and Forecast (2020-2032)
Chapter 9. Global Marine Propulsion Engines Market, By Application
9.1. Marine Propulsion Engines Market, by Application, 2023-2032
9.1.1. Commercial
9.1.1.1. Market Revenue and Forecast (2020-2032)
9.1.2. Defense
9.1.2.1. Market Revenue and Forecast (2020-2032)
9.1.3. Passenger
9.1.3.1. Market Revenue and Forecast (2020-2032)
Chapter 10. Global Marine Propulsion Engines Market, By Power Range
10.1. Marine Propulsion Engines Market, by Power Range, 2023-2032
10.1.1. 0-1,000 HP
10.1.1.1. Market Revenue and Forecast (2020-2032)
10.1.2. 1,001-5,000 HP
10.1.2.1. Market Revenue and Forecast (2020-2032)
10.1.3. 5,001-10,000 HP
10.1.3.1. Market Revenue and Forecast (2020-2032)
10.1.4. 10,001-20,000 HP
10.1.4.1. Market Revenue and Forecast (2020-2032)
10.1.5. Above 20,000 HP
10.1.5.1. Market Revenue and Forecast (2020-2032)
Chapter 11. Global Marine Propulsion Engines Market, Regional Estimates and Trend Forecast
11.1. North America
11.1.1. Market Revenue and Forecast, by Fuel Type (2020-2032)
11.1.2. Market Revenue and Forecast, by Application (2020-2032)
11.1.3. Market Revenue and Forecast, by Power Range (2020-2032)
11.1.4. U.S.
11.1.4.1. Market Revenue and Forecast, by Fuel Type (2020-2032)
11.1.4.2. Market Revenue and Forecast, by Application (2020-2032)
11.1.4.3. Market Revenue and Forecast, by Power Range (2020-2032)
11.1.5. Rest of North America
11.1.5.1. Market Revenue and Forecast, by Fuel Type (2020-2032)
11.1.5.2. Market Revenue and Forecast, by Application (2020-2032)
11.1.5.3. Market Revenue and Forecast, by Power Range (2020-2032)
11.2. Europe
11.2.1. Market Revenue and Forecast, by Fuel Type (2020-2032)
11.2.2. Market Revenue and Forecast, by Application (2020-2032)
11.2.3. Market Revenue and Forecast, by Power Range (2020-2032)
11.2.4. UK
11.2.4.1. Market Revenue and Forecast, by Fuel Type (2020-2032)
11.2.4.2. Market Revenue and Forecast, by Application (2020-2032)
11.2.4.3. Market Revenue and Forecast, by Power Range (2020-2032)
11.2.5. Germany
11.2.5.1. Market Revenue and Forecast, by Fuel Type (2020-2032)
11.2.5.2. Market Revenue and Forecast, by Application (2020-2032)
11.2.5.3. Market Revenue and Forecast, by Power Range (2020-2032)
11.2.6. France
11.2.6.1. Market Revenue and Forecast, by Fuel Type (2020-2032)
11.2.6.2. Market Revenue and Forecast, by Application (2020-2032)
11.2.6.3. Market Revenue and Forecast, by Power Range (2020-2032)
11.2.7. Rest of Europe
11.2.7.1. Market Revenue and Forecast, by Fuel Type (2020-2032)
11.2.7.2. Market Revenue and Forecast, by Application (2020-2032)
11.2.7.3. Market Revenue and Forecast, by Power Range (2020-2032)
11.3. APAC
11.3.1. Market Revenue and Forecast, by Fuel Type (2020-2032)
11.3.2. Market Revenue and Forecast, by Application (2020-2032)
11.3.3. Market Revenue and Forecast, by Power Range (2020-2032)
11.3.4. India
11.3.4.1. Market Revenue and Forecast, by Fuel Type (2020-2032)
11.3.4.2. Market Revenue and Forecast, by Application (2020-2032)
11.3.4.3. Market Revenue and Forecast, by Power Range (2020-2032)
11.3.5. China
11.3.5.1. Market Revenue and Forecast, by Fuel Type (2020-2032)
11.3.5.2. Market Revenue and Forecast, by Application (2020-2032)
11.3.5.3. Market Revenue and Forecast, by Power Range (2020-2032)
11.3.6. Japan
11.3.6.1. Market Revenue and Forecast, by Fuel Type (2020-2032)
11.3.6.2. Market Revenue and Forecast, by Application (2020-2032)
11.3.6.3. Market Revenue and Forecast, by Power Range (2020-2032)
11.3.7. Rest of APAC
11.3.7.1. Market Revenue and Forecast, by Fuel Type (2020-2032)
11.3.7.2. Market Revenue and Forecast, by Application (2020-2032)
11.3.7.3. Market Revenue and Forecast, by Power Range (2020-2032)
11.4. MEA
11.4.1. Market Revenue and Forecast, by Fuel Type (2020-2032)
11.4.2. Market Revenue and Forecast, by Application (2020-2032)
11.4.3. Market Revenue and Forecast, by Power Range (2020-2032)
11.4.4. GCC
11.4.4.1. Market Revenue and Forecast, by Fuel Type (2020-2032)
11.4.4.2. Market Revenue and Forecast, by Application (2020-2032)
11.4.4.3. Market Revenue and Forecast, by Power Range (2020-2032)
11.4.5. North Africa
11.4.5.1. Market Revenue and Forecast, by Fuel Type (2020-2032)
11.4.5.2. Market Revenue and Forecast, by Application (2020-2032)
11.4.5.3. Market Revenue and Forecast, by Power Range (2020-2032)
11.4.6. South Africa
11.4.6.1. Market Revenue and Forecast, by Fuel Type (2020-2032)
11.4.6.2. Market Revenue and Forecast, by Application (2020-2032)
11.4.6.3. Market Revenue and Forecast, by Power Range (2020-2032)
11.4.7. Rest of MEA
11.4.7.1. Market Revenue and Forecast, by Fuel Type (2020-2032)
11.4.7.2. Market Revenue and Forecast, by Application (2020-2032)
11.4.7.3. Market Revenue and Forecast, by Power Range (2020-2032)
11.5. Latin America
11.5.1. Market Revenue and Forecast, by Fuel Type (2020-2032)
11.5.2. Market Revenue and Forecast, by Application (2020-2032)
11.5.3. Market Revenue and Forecast, by Power Range (2020-2032)
11.5.4. Brazil
11.5.4.1. Market Revenue and Forecast, by Fuel Type (2020-2032)
11.5.4.2. Market Revenue and Forecast, by Application (2020-2032)
11.5.4.3. Market Revenue and Forecast, by Power Range (2020-2032)
11.5.5. Rest of LATAM
11.5.5.1. Market Revenue and Forecast, by Fuel Type (2020-2032)
11.5.5.2. Market Revenue and Forecast, by Application (2020-2032)
11.5.5.3. Market Revenue and Forecast, by Power Range (2020-2032)
Chapter 12. Company Profiles
12.1. Caterpillar
12.1.1. Company Overview
12.1.2. Product Offerings
12.1.3. Financial Performance
12.1.4. Recent Initiatives
12.2. Hyundai Heavy Industries Co. Ltd.
12.2.1. Company Overview
12.2.2. Product Offerings
12.2.3. Financial Performance
12.2.4. Recent Initiatives
12.3. Mitsubishi Heavy Industries Ltd.
12.3.1. Company Overview
12.3.2. Product Offerings
12.3.3. Financial Performance
12.3.4. Recent Initiatives
12.4. Volvo Penta
12.4.1. Company Overview
12.4.2. Product Offerings
12.4.3. Financial Performance
12.4.4. Recent Initiatives
12.5. Daihatsu Diesel MFG. Co. Ltd.
12.5.1. Company Overview
12.5.2. Product Offerings
12.5.3. Financial Performance
12.5.4. Recent Initiatives
12.6. General Electric Company
12.6.1. Company Overview
12.6.2. Product Offerings
12.6.3. Financial Performance
12.6.4. Recent Initiatives
12.7. Yanmar Holdings Co. Ltd.
12.7.1. Company Overview
12.7.2. Product Offerings
12.7.3. Financial Performance
12.7.4. Recent Initiatives
12.8. IHI Power Systems Co. Ltd.
12.8.1. Company Overview
12.8.2. Product Offerings
12.8.3. Financial Performance
12.8.4. Recent Initiatives
12.9. Wartsila
12.9.1. Company Overview
12.9.2. Product Offerings
12.9.3. Financial Performance
12.9.4. Recent Initiatives
12.10. Rolls Royce Plc
12.10.1. Company Overview
12.10.2. Product Offerings
12.10.3. Financial Performance
12.10.4. Recent Initiatives
Chapter 13. Research Methodology
13.1. Primary Research
13.2. Secondary Research
13.3. Assumptions
Chapter 14. Appendix
14.1. About Us
14.2. Glossary of Terms
 Cross-segment Market Size and Analysis for
Mentioned Segments
Additional Company Profiles (Upto 5 With No Cost)
Additional Countries (Apart From Mentioned Countries)
Country/Region-specific Report
Go To Market Strategy
Region Specific Market DynamicsRegion Level Market Share Import Export AnalysisProduction AnalysisOthers
Cross-segment Market Size and Analysis for
Mentioned Segments
Additional Company Profiles (Upto 5 With No Cost)
Additional Countries (Apart From Mentioned Countries)
Country/Region-specific Report
Go To Market Strategy
Region Specific Market DynamicsRegion Level Market Share Import Export AnalysisProduction AnalysisOthers