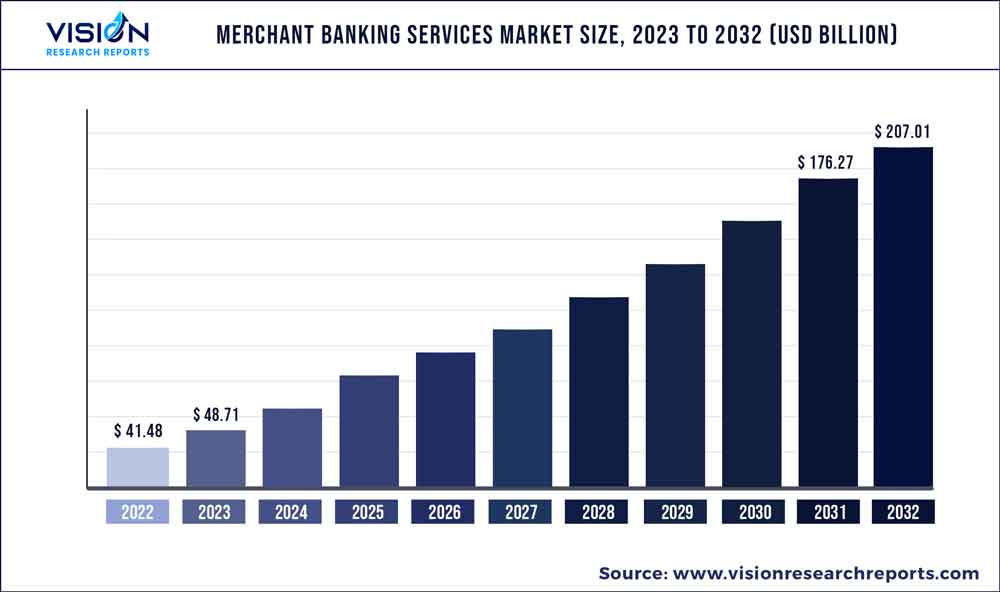
The global merchant banking services market size was estimated at around USD 41.48 billion in 2022 and it is projected to hit around USD 207.01 billion by 2032, growing at a CAGR of 17.44% from 2023 to 2032. The merchant banking services market in the United States was accounted for USD 9 billion in 2022.

Key Pointers
Report Scope of the Merchant Banking Services Market
| Report Coverage | Details |
| Revenue Share of North America in 2022 | 29% |
| Revenue Forecast by 2032 | USD 207.01 billion |
| Growth Rate from 2023 to 2032 | CAGR of 17.44% |
| Base Year | 2022 |
| Forecast Period | 2023 to 2032 |
| Market Analysis (Terms Used) | Value (US$ Million/Billion) or (Volume/Units) |
| Companies Covered |
U.S. Capital Advisors LLC; JP Morgan Chase & Co; Bank Of America Corporation; DBS Bank Ltd; NIBL Ace Capital Limited; Bryant Park Capital; Morgan Stanley; HSBC Bank USA N.A.; Royal Bank Of Canada Website; BERENBERG; Lazard |
A merchant bank can be a banking and non-banking firm that offers several services such as fundraising, loan services, and financial advising to its customers, including High-Net-Worth Individuals (HNWI), small & medium enterprises, and startups. The merchant banking services growth can be attributed to increasing globalization. For instance, the expansion in international trade and commerce has driven the demand for specialized financial services to facilitate transactions and manage risks associated with cross-border trade.
Merchant banking service providers offer advice on mergers & acquisitions, restructuring, and project financing. The growth in merger and acquisition deals worldwide has allowed the market players to boost their sales and revenues. For instance, according to IMAA analysis, the number of M&A deals reached 25,170 in 2021 from 18,422 deals in 2020. Moreover, the growth in demand for merchant banking and financial services across the globe is expected to drive the market’s growth.
The growing technological advancements across various industries, including the banking and finance industries, are anticipated to drive the merchant banking services market growth over the forecast period. Leveraging technologies such as digital platforms to promote and provide merchant banking services enables market players to reach a broader range of clients and provide them with real-time information and analytics. Furthermore, increasing launches of merchant banking services over digital platforms are also expected to drive the market’s growth. For instance, in April 2023, Greengage, a UK-based digital merchant banking company, announced the launch of e-money accounts services. The company also facilitated GBP and EUR payments and cards targeting SMEs, digital assets firms, and HNWs.
Merchant banks assist companies in being listed on stock exchanges, also known as Initial Public Offering (IPO). IPO management responsibilities include conducting due diligence, appointing intermediaries, filing requisite documents, advertising, calculating issue size, and redressal of investor grievances. The recent surge in IPO participation is a direct factor contributing to the growth of merchant banking services. For instance, in August 2021, OYO Hotels and Homes, a SoftBank-backed hospitality company, announced that the company had hired a minimum of 3 merchant banks, including JPMorgan Chase & Co., Kotak Mahindra Capital Company, and Citigroup Inc, to raise USD 1.2 billion by launching its initial public offering (IPO).
The primary challenge of merchant banking services is their high costs, making them more expensive than traditional banking services. Merchant banking services are not available to the public since they serve only wealthy individuals, known as HNIs, who meet minimum asset size requirements. Additionally, merchant banking services are not guaranteed success and still have associated risks. Moreover, in terms of business clients, merchant banks do not help raise funds for startups but those businesses with good fundamentals that need help scaling.
Services Insights
The business restructuring segment dominated the market in 2022, accounting for a revenue share of more than 30%. Business restructuring involves significantly changing a company's operations, structure, or financing to improve its operational efficiency and financial position. The growth of the segment can be attributed to the rising need for business restructuring to improve their operations, reduce costs, and increase efficiency, making them more competitive in the market. For instance, in December 2019, JPMorgan Chase & Co. announced that it had reorganized its wealth management businesses. This business restructuring aimed to better compete with its rivals, including Morgan Stanley, among others.
The credit syndication segment is anticipated to register significant growth over the forecast period. Credit syndication consolidates debt with a single lending source, a financial institution, or a consortium. The growing use of merchant banks for credit syndication can be attributed to their ability to reduce the cost of debt and improve balance sheets. Moreover, with the rise in competition and the need for capital to fund business expansions and other strategies, companies are increasingly attracted toward credit syndication to secure financing.
Service Provider Insights
The banks segment dominated the market in 2022, accounting for more than a 57% revenue share. The dominance of the banks segment is primarily due to the large scale of operations. Investors banks, due to the trust factor embedded with big names and their ability to deploy funds and resources, often optimally undertake such operations to maximize return on investments. Furthermore, banks are subject to stringent regulations with less room for oversight. Additionally, the banks have started to offer a wide range of financial services, including loans, credit facilities, and investment advice, which are critical to the growth and success of businesses.
The non-banking institutions segment is anticipated to register significant growth over the forecast period. Non-banking institutions segment includes private companies, investment firms, or even proprietary ownerships. The most common non-banking institutions apart from investment firms include hedge funds and insurance companies. The main point of difference is that non-banking entities help in arranging for capital but are not fully licensed to be classified as banks and hence are not permitted to accept deposits.
End-use Insights
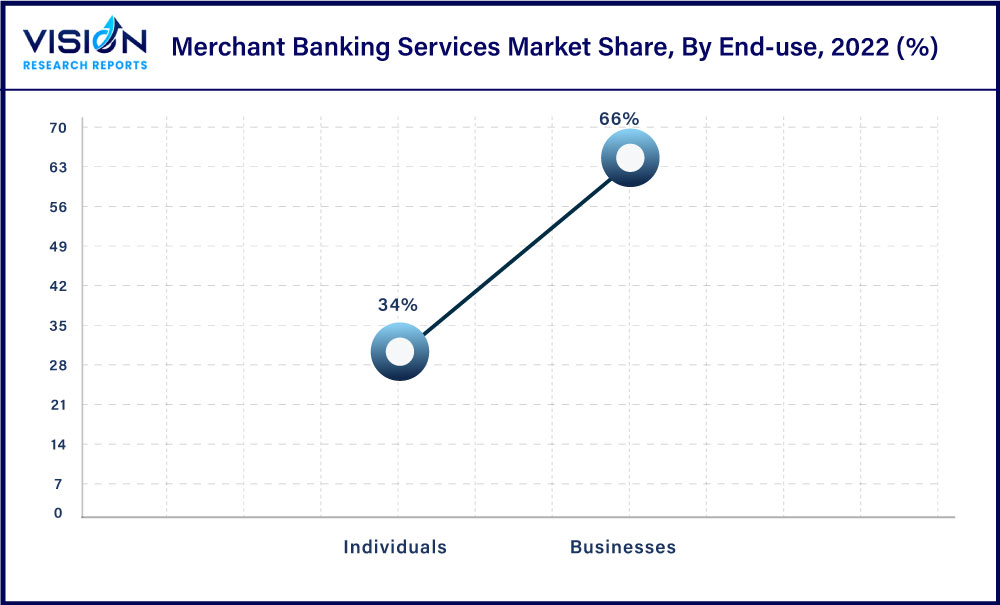
The business segment dominated the market in 2022 and accounted for a global revenue share of more than 66%. Business clients leveraging merchant banking services include pension funds, government institutions, global corporates, and charity organizations. Business clients are responsible for managing significant assets and resort to merchant banking service providers for active portfolio management to minimize risk and generate a return on equity. Moreover, merchant banking consulting and advisory services may also assist businesses in assessing the cost and benefits of projects to determine the payback period.

The individual segment is expected to register significant growth over the forecast period. Merchant banks mainly assist HNIs with portfolio management services. The primary responsibilities include buying and selling underlying securities in their portfolios while adapting to market conditions (market timing). The segment's growth can be attributed to the building and execution of investment strategies to meet specific investment objectives.
Regional Insights
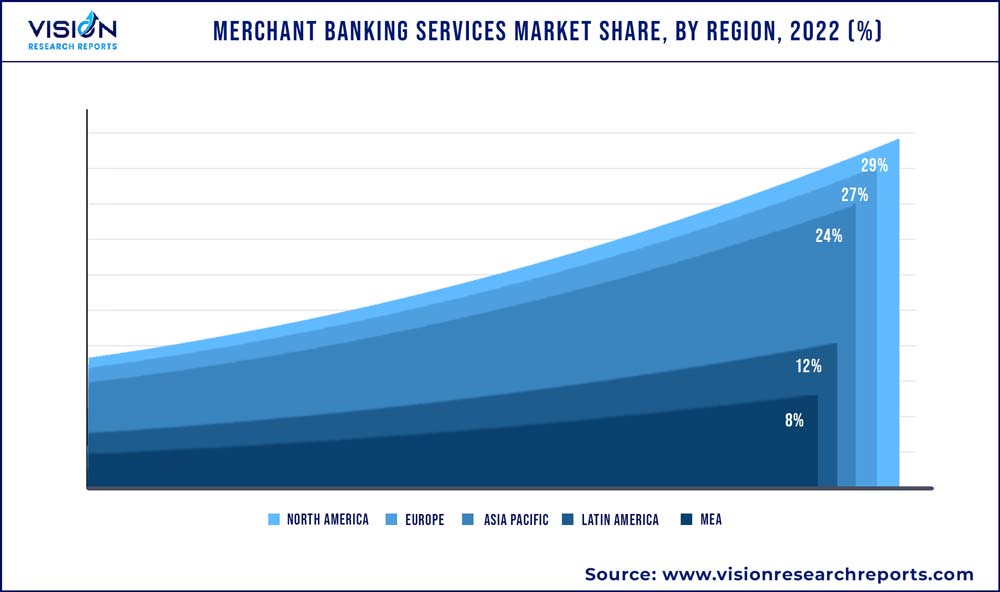
North America dominated the merchant banking services market in 2022 and accounted for more than 29% of revenue share. The presence of prominent merchant banking service providers such as the U.S. Capital Advisors LLC; Bank of America Corporation; and JPMorgan Chase & Co across the region is anticipated to fuel the market’s growth. Furthermore, local companies seek to enter new markets, as illustrated by real estate development company Panatonni, which forayed into the Indian market in July 2022. Additionally, a developed capital market and business environment are further expected the boost the merchant banking services industry.

Asia Pacific is expected to emerge as the fastest-growing region over the forecast period. The growth can be attributed to favorable demographics, rising income levels, and growing regional businesses. Moreover, the global Foreign Direct Investment (FDI) Annual Report reported a rise in foreign direct investments in greenfield projects in the region by 17% in 2021. Prominent merchant banking service providers such as JPMorgan Chase & Co. have expanded offerings in the Asia Pacific region, recognizing the potential opportunity.
Merchant Banking Services Market Segmentations:
By Services
By Services
By End-use
By Regional
Chapter 1. Introduction
1.1. Research Objective
1.2. Scope of the Study
1.3. Definition
Chapter 2. Research Methodology
2.1. Research Approach
2.2. Data Sources
2.3. Assumptions & Limitations
Chapter 3. Executive Summary
3.1. Market Snapshot
Chapter 4. Market Variables and Scope
4.1. Introduction
4.2. Market Classification and Scope
4.3. Industry Value Chain Analysis
4.3.1. Raw Material Procurement Analysis
4.3.2. Sales and Distribution Services Analysis
4.3.3. Downstream Buyer Analysis
Chapter 5. COVID 19 Impact on Merchant Banking Services Market
5.1. COVID-19 Landscape: Merchant Banking Services Industry Impact
5.2. COVID 19 - Impact Assessment for the Industry
5.3. COVID 19 Impact: Global Major Government Policy
5.4. Market Trends and Opportunities in the COVID-19 Landscape
Chapter 6. Market Dynamics Analysis and Trends
6.1. Market Dynamics
6.1.1. Market Drivers
6.1.2. Market Restraints
6.1.3. Market Opportunities
6.2. Porter’s Five Forces Analysis
6.2.1. Bargaining power of suppliers
6.2.2. Bargaining power of buyers
6.2.3. Threat of substitute
6.2.4. Threat of new entrants
6.2.5. Degree of competition
Chapter 7. Competitive Landscape
7.1.1. Company Market Share/Positioning Analysis
7.1.2. Key Strategies Adopted by Players
7.1.3. Vendor Landscape
7.1.3.1. List of Suppliers
7.1.3.2. List of Buyers
Chapter 8. Global Merchant Banking Services Market, By Services
8.1. Merchant Banking Services Market, by Services, 2023-2032
8.1.1 Portfolio Management
8.1.1.1. Market Revenue and Forecast (2020-2032)
8.1.2. Business Restructuring
8.1.2.1. Market Revenue and Forecast (2020-2032)
8.1.3. Credit Syndication
8.1.3.1. Market Revenue and Forecast (2020-2032)
8.1.4. Others
8.1.4.1. Market Revenue and Forecast (2020-2032)
Chapter 9. Global Merchant Banking Services Market, By Services Provider
9.1. Merchant Banking Services Market, by Services Provider, 2023-2032
9.1.1. Banks
9.1.1.1. Market Revenue and Forecast (2020-2032)
9.1.2. Non-Banking Institutions
9.1.2.1. Market Revenue and Forecast (2020-2032)
Chapter 10. Global Merchant Banking Services Market, By End-user
10.1. Merchant Banking Services Market, by End-user, 2023-2032
10.1.1. Businesses
10.1.1.1. Market Revenue and Forecast (2020-2032)
10.1.2. Individuals
10.1.2.1. Market Revenue and Forecast (2020-2032)
Chapter 11. Global Merchant Banking Services Market, Regional Estimates and Trend Forecast
11.1. North America
11.1.1. Market Revenue and Forecast, by Services (2020-2032)
11.1.2. Market Revenue and Forecast, by Services Provider (2020-2032)
11.1.3. Market Revenue and Forecast, by End-user (2020-2032)
11.1.4. U.S.
11.1.4.1. Market Revenue and Forecast, by Services (2020-2032)
11.1.4.2. Market Revenue and Forecast, by Services Provider (2020-2032)
11.1.4.3. Market Revenue and Forecast, by End-user (2020-2032)
11.1.5. Rest of North America
11.1.5.1. Market Revenue and Forecast, by Services (2020-2032)
11.1.5.2. Market Revenue and Forecast, by Services Provider (2020-2032)
11.1.5.3. Market Revenue and Forecast, by End-user (2020-2032)
11.2. Europe
11.2.1. Market Revenue and Forecast, by Services (2020-2032)
11.2.2. Market Revenue and Forecast, by Services Provider (2020-2032)
11.2.3. Market Revenue and Forecast, by End-user (2020-2032)
11.2.4. UK
11.2.4.1. Market Revenue and Forecast, by Services (2020-2032)
11.2.4.2. Market Revenue and Forecast, by Services Provider (2020-2032)
11.2.4.3. Market Revenue and Forecast, by End-user (2020-2032)
11.2.5. Germany
11.2.5.1. Market Revenue and Forecast, by Services (2020-2032)
11.2.5.2. Market Revenue and Forecast, by Services Provider (2020-2032)
11.2.5.3. Market Revenue and Forecast, by End-user (2020-2032)
11.2.6. France
11.2.6.1. Market Revenue and Forecast, by Services (2020-2032)
11.2.6.2. Market Revenue and Forecast, by Services Provider (2020-2032)
11.2.6.3. Market Revenue and Forecast, by End-user (2020-2032)
11.2.7. Rest of Europe
11.2.7.1. Market Revenue and Forecast, by Services (2020-2032)
11.2.7.2. Market Revenue and Forecast, by Services Provider (2020-2032)
11.2.7.3. Market Revenue and Forecast, by End-user (2020-2032)
11.3. APAC
11.3.1. Market Revenue and Forecast, by Services (2020-2032)
11.3.2. Market Revenue and Forecast, by Services Provider (2020-2032)
11.3.3. Market Revenue and Forecast, by End-user (2020-2032)
11.3.4. India
11.3.4.1. Market Revenue and Forecast, by Services (2020-2032)
11.3.4.2. Market Revenue and Forecast, by Services Provider (2020-2032)
11.3.4.3. Market Revenue and Forecast, by End-user (2020-2032)
11.3.5. China
11.3.5.1. Market Revenue and Forecast, by Services (2020-2032)
11.3.5.2. Market Revenue and Forecast, by Services Provider (2020-2032)
11.3.5.3. Market Revenue and Forecast, by End-user (2020-2032)
11.3.6. Japan
11.3.6.1. Market Revenue and Forecast, by Services (2020-2032)
11.3.6.2. Market Revenue and Forecast, by Services Provider (2020-2032)
11.3.6.3. Market Revenue and Forecast, by End-user (2020-2032)
11.3.7. Rest of APAC
11.3.7.1. Market Revenue and Forecast, by Services (2020-2032)
11.3.7.2. Market Revenue and Forecast, by Services Provider (2020-2032)
11.3.7.3. Market Revenue and Forecast, by End-user (2020-2032)
11.4. MEA
11.4.1. Market Revenue and Forecast, by Services (2020-2032)
11.4.2. Market Revenue and Forecast, by Services Provider (2020-2032)
11.4.3. Market Revenue and Forecast, by End-user (2020-2032)
11.4.4. GCC
11.4.4.1. Market Revenue and Forecast, by Services (2020-2032)
11.4.4.2. Market Revenue and Forecast, by Services Provider (2020-2032)
11.4.4.3. Market Revenue and Forecast, by End-user (2020-2032)
11.4.5. North Africa
11.4.5.1. Market Revenue and Forecast, by Services (2020-2032)
11.4.5.2. Market Revenue and Forecast, by Services Provider (2020-2032)
11.4.5.3. Market Revenue and Forecast, by End-user (2020-2032)
11.4.6. South Africa
11.4.6.1. Market Revenue and Forecast, by Services (2020-2032)
11.4.6.2. Market Revenue and Forecast, by Services Provider (2020-2032)
11.4.6.3. Market Revenue and Forecast, by End-user (2020-2032)
11.4.7. Rest of MEA
11.4.7.1. Market Revenue and Forecast, by Services (2020-2032)
11.4.7.2. Market Revenue and Forecast, by Services Provider (2020-2032)
11.4.7.3. Market Revenue and Forecast, by End-user (2020-2032)
11.5. Latin America
11.5.1. Market Revenue and Forecast, by Services (2020-2032)
11.5.2. Market Revenue and Forecast, by Services Provider (2020-2032)
11.5.3. Market Revenue and Forecast, by End-user (2020-2032)
11.5.4. Brazil
11.5.4.1. Market Revenue and Forecast, by Services (2020-2032)
11.5.4.2. Market Revenue and Forecast, by Services Provider (2020-2032)
11.5.4.3. Market Revenue and Forecast, by End-user (2020-2032)
11.5.5. Rest of LATAM
11.5.5.1. Market Revenue and Forecast, by Services (2020-2032)
11.5.5.2. Market Revenue and Forecast, by Services Provider (2020-2032)
11.5.5.3. Market Revenue and Forecast, by End-user (2020-2032)
Chapter 12. Company Profiles
12.1. U.S. Capital Advisors LLC
12.1.1. Company Overview
12.1.2. Product Offerings
12.1.3. Financial Performance
12.1.4. Recent Initiatives
12.2. JP Morgan Chase & Co
12.2.1. Company Overview
12.2.2. Product Offerings
12.2.3. Financial Performance
12.2.4. Recent Initiatives
12.3. Bank Of America Corporation
12.3.1. Company Overview
12.3.2. Product Offerings
12.3.3. Financial Performance
12.3.4. Recent Initiatives
12.4. DBS Bank Ltd
12.4.1. Company Overview
12.4.2. Product Offerings
12.4.3. Financial Performance
12.4.4. Recent Initiatives
12.5. NIBL Ace Capital Limited
12.5.1. Company Overview
12.5.2. Product Offerings
12.5.3. Financial Performance
12.5.4. Recent Initiatives
12.6. Bryant Park Capital
12.6.1. Company Overview
12.6.2. Product Offerings
12.6.3. Financial Performance
12.6.4. Recent Initiatives
12.7. Morgan Stanley
12.7.1. Company Overview
12.7.2. Product Offerings
12.7.3. Financial Performance
12.7.4. Recent Initiatives
12.8. HSBC Bank USA N.A.
12.8.1. Company Overview
12.8.2. Product Offerings
12.8.3. Financial Performance
12.8.4. Recent Initiatives
12.9. Royal Bank Of Canada Website
12.9.1. Company Overview
12.9.2. Product Offerings
12.9.3. Financial Performance
12.9.4. Recent Initiatives
12.10. BERENBERG
12.10.1. Company Overview
12.10.2. Product Offerings
12.10.3. Financial Performance
12.10.4. Recent Initiatives
Chapter 13. Research Methodology
13.1. Primary Research
13.2. Secondary Research
13.3. Assumptions
Chapter 14. Appendix
14.1. About Us
14.2. Glossary of Terms
 Cross-segment Market Size and Analysis for
Mentioned Segments
 Additional Company Profiles (Upto 5 With No Cost)
 Additional Countries (Apart From Mentioned Countries)
 Country/Region-specific Report
 Go To Market Strategy
 Region Specific Market Dynamics
 Region Level Market Share
 Import Export Analysis
 Production Analysis
 Others